hehe now i got it…the green arrow shows that am into a trade and is positive…if negative-arrow turns red…its part of the software and i can’t add or remove it…
just want to give thanks to TMB, inspira, & cashdemon for your help this week; it has been somewhat of a breakout week for me and some things finally clicked, all those pics really help; being able to communicate with people from all over with a common goal through this thread is great, hope everyone has a wonderful weekend.
Totally agree! I’ve posted very little here but already found it quite usefull! I think this is a great collaboration we have here! Let’s keep it up! Good weekend to you all! See ya on monday! 
Me too. I’d like to thank TMB for kick starting the discussion as it appeared dead for couple of weeks. Additionally, I extend gratitude to inspira, cashdemon, dbear0398, and martinius for keeping the discussion going.
Looking forward to the next week of more collaboration and interesting setups.
in the spirit of thanksgiving…
i just wanted to say …all i have posted in here is thanks to T M B and his explanation and dedication…
i have entered forex world with babypips school some time ago…/for all moderators and admins reading this-CHEERS/
to TMB- double CHEERS
to all who can’t understand my posts…SORRY…im still learning english:D
Do to personal events going on this and next month I will only be available to teach and analyze the market Mon-Friday from 2am-6am. As a result My partner will still be trading from 2am-12pm and w/e he finds past the 6am mark I will make sure he posts them up for you guys. In addition, during that new time frame, I will still be available to trade live with those on skype who have added me. If you have not done so yet, simply msg me and I will send you the info. Thanks for your patience and happy trading.
Bellow we have 4 patterns bullish patterns developing:
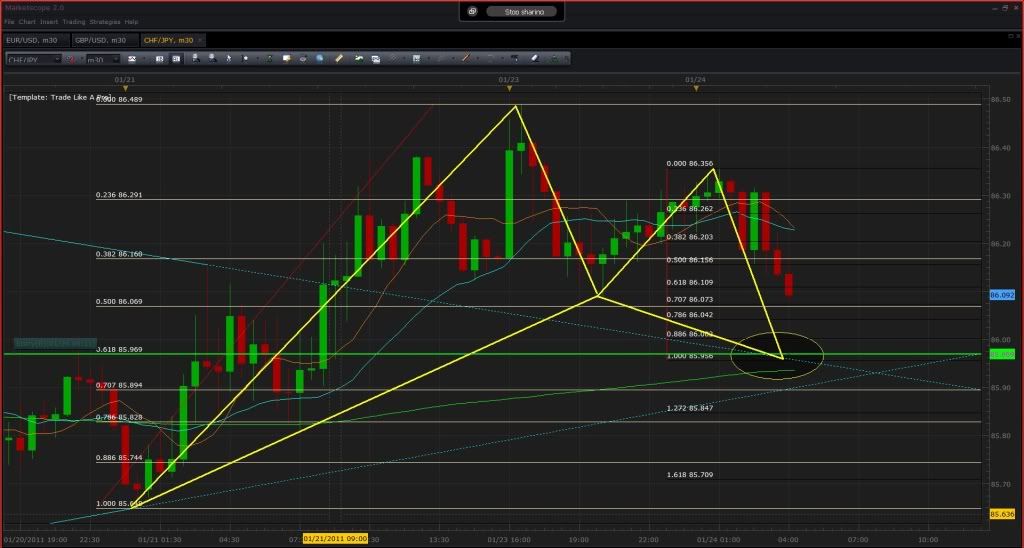
Here in the CHF/JPY the .618 of XA is converging with the 100% of CD. In addition to this, we have 2 trend lines crossing around the same area adding to its confirmation.
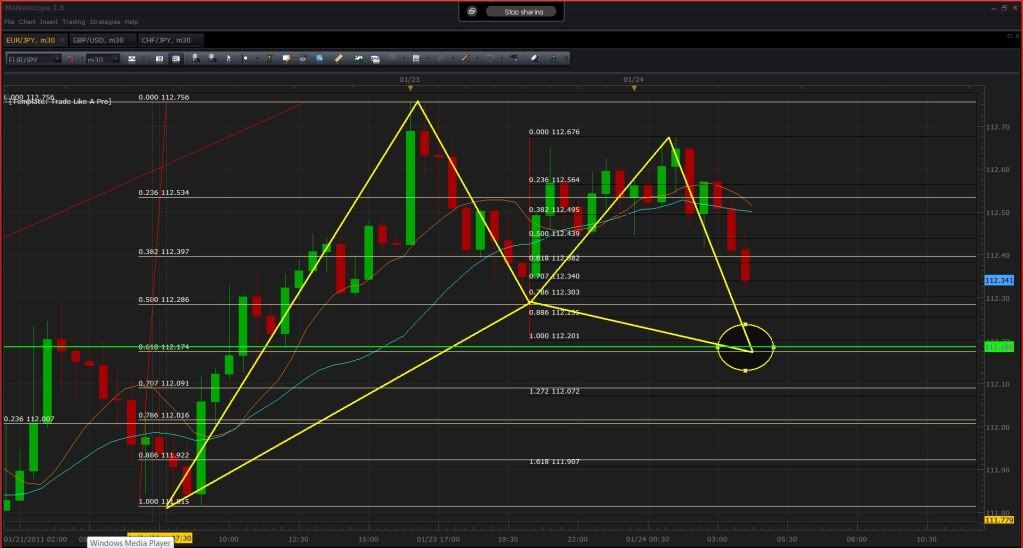
Above we have the .618 of XA converging with the 100% CD. I like this gartley not only because of its good convergence and previous respect of the fib points, but also because it is flowing similar to the CHF/JPY meaning that they both are reaching 100% CD points with .618 XA’s and are relatively around the same distance away from competing the patterns.
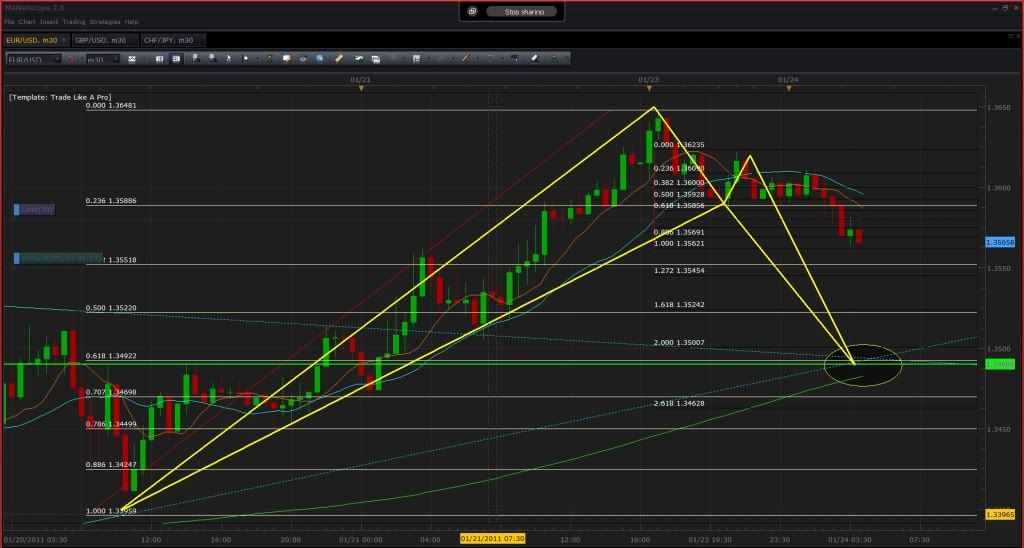
Here we have a bullish setup where the .618 of XA converges with the 200% of CD. In addition, we have 2 trend lines crossing with the fibs adding support for to the level.
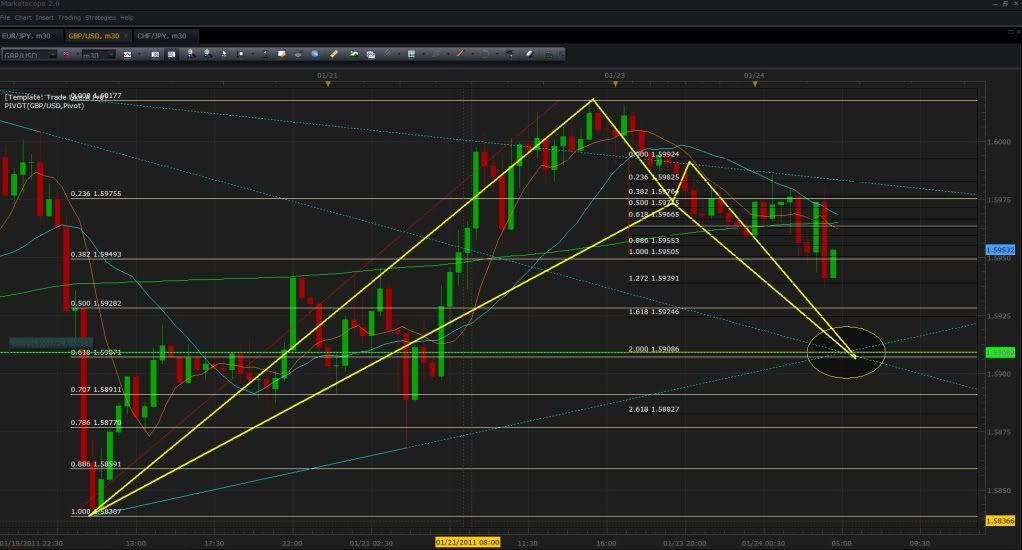
Above the .618 of XA converges with the 200% of CD. Normally I would take the convergence at the .500 of this pair, but the fact that I have 2 trend lines crossing at the .618 and this area is relatively the same distance from the D point as the EUR/USD pattern indicates that this should be the D area. Also if I where to use the next swing for my CD, 127% would land right on top of this convergence.
*The green line indicates where my entry would be (look to the far right for the price level in green).
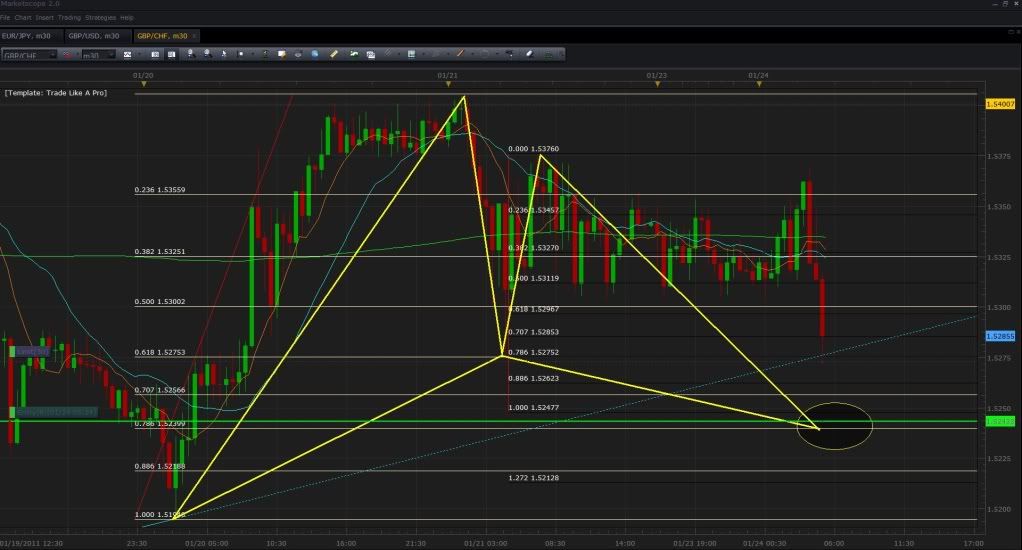
The GBP/CHF looks like its developing a nice pattern where the .786 of XA converges with 100% CD. If you take a closer look at this pair, the past 3-6 patterns have worked quite well.
Here is a little goodie I found around! Have a look at it!
Our friend Fibonacci says:
AB=0.618 of XA (Divergence of 2-3 pips)
BC=0.707 of AB (Right on)
D=1.41 of BC + 0.786 of XA + BA projection converges at 100%
Also to note is that price handle of 0.9900 that is spot on the D.
Happy trading!
Edit: Be aware of some important USD news (CB Consumer Confidence) at 03.00 PM (GMT) if you trade this pattern.


1HR USDCAD bearish pattern headed towards parity, will be interesting to see how the US news will affect this if at all; I know my consumer confidence still sucks but they have never gotten around to surveying my household
Like CashDemon, I don’t but I know people who do… from memory they traded some kind of trendline break.
Someone asked the same question awhile back, so you’re not alone. 
Some nice sentiments for a “thanks-giving” weekend by the way. ;p
I liked this one purely coz the 00… RRR was not great for me.
Jeez, that EURGBP really took off since last week, right past our AOI (area of interest).
Be careful out there, bit jittery…
What do you mean by RRR? Bit ignorant when it comes to acronyms!
Anyway, I traded the pattern as planned, but it sure is choppy. I jumped out of the trade with a little profit also because of the upcoming news.
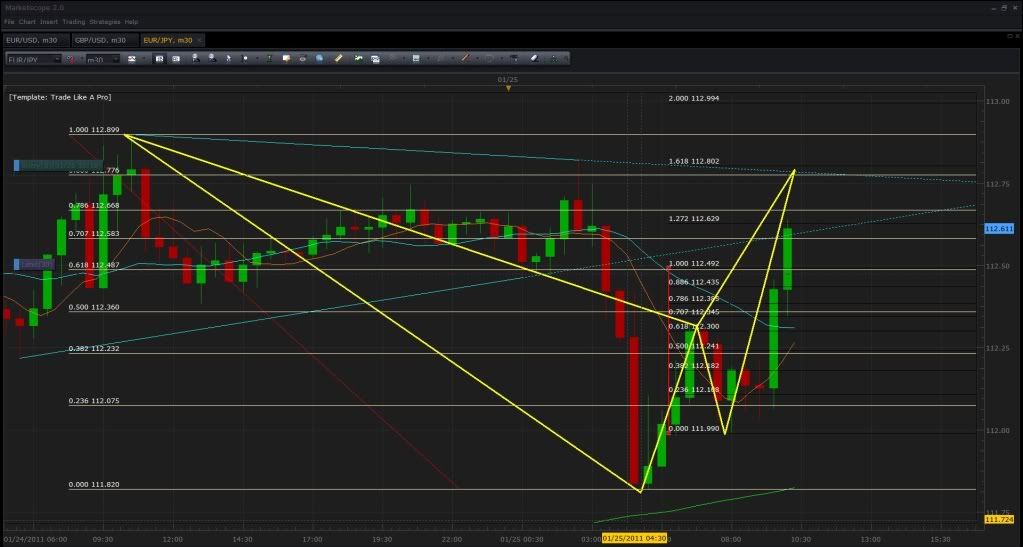
Hey Guys, just want to let u guys know that im seeing this pattern developing on the EUR/JPY (Where the .886 of XA converges with the 161% of CD and the high to high trend line 30 min chart). The fail of this pattern is a close above the convergence and you should be mindful that it is moving very violently. As a result we are taking the higher convergence rather then the .786.
Good trading and make sure to analyze your charts 3-4 times before entering in days such as these.
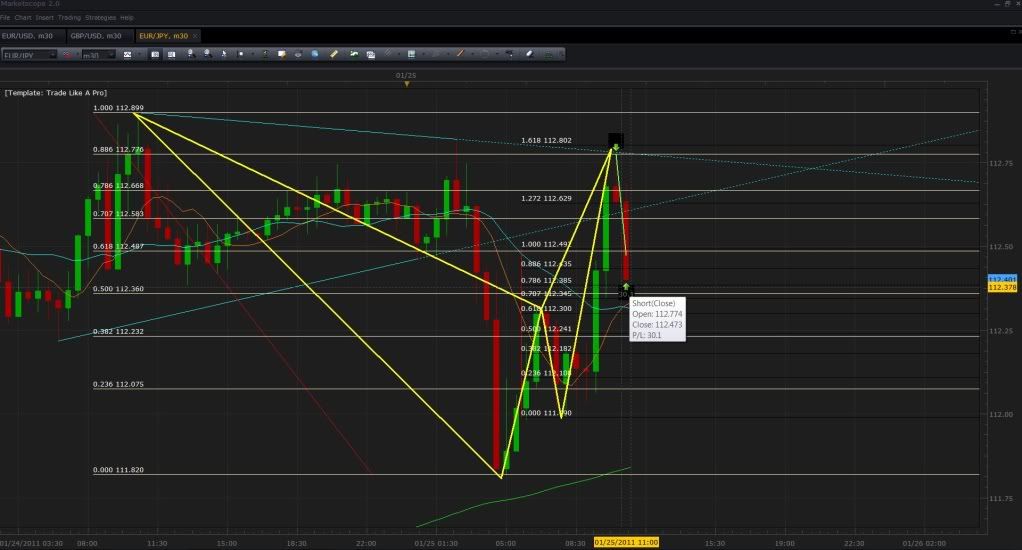
As you can see, even in volatile days such as this their is money to be made. With a proper analysis and consideration to the movement rate of the pairs, we where able to predict a successful D on the EUR/JPY and complete our 30 pips for the day. Congratulations to who ever jumped in on this trade and for those who did not, please take the time to analyze this pattern for it happens frequently in similar pairs and during critical news times.
Here are two overlaying patterns, the one bat overlayed with a 5-0 pattern showing a potential reversal down to the C point, enjoy.

Upcoming 4H USDCHF bullish retracement pattern with a tight convergence area: XA.886, AB1.272, and BC2.00. D is a round number .9350 and in a support zone as well. Only question remains if its going to make it there.

hi geltmantic…this is my deal on usd/chf…i just exited…the setup you have posted looks nice and the convergence lvl is in the same lvl where is 2.000 XA and 2.000 CD on the setup ive posted…
cheers

By radofx at 2011-01-26
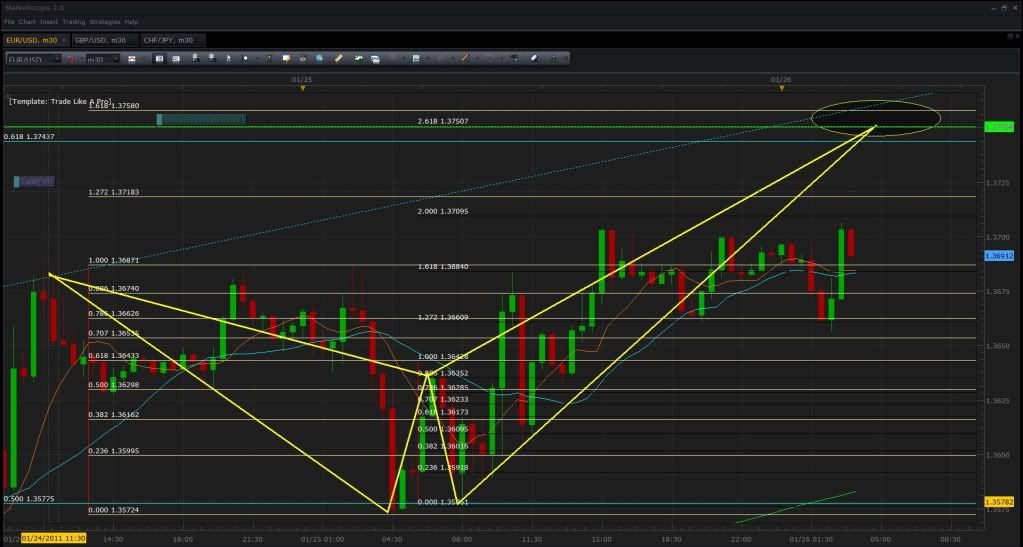
Above we have a Bearish Butterfly forming on the EUR/USD. Where the 1.618 of XA not only converges with the 261% extreme of CD but it is also converging with the .618 of the four hour and the high of the channel where price had previously bounced from at 1/24 11am est.
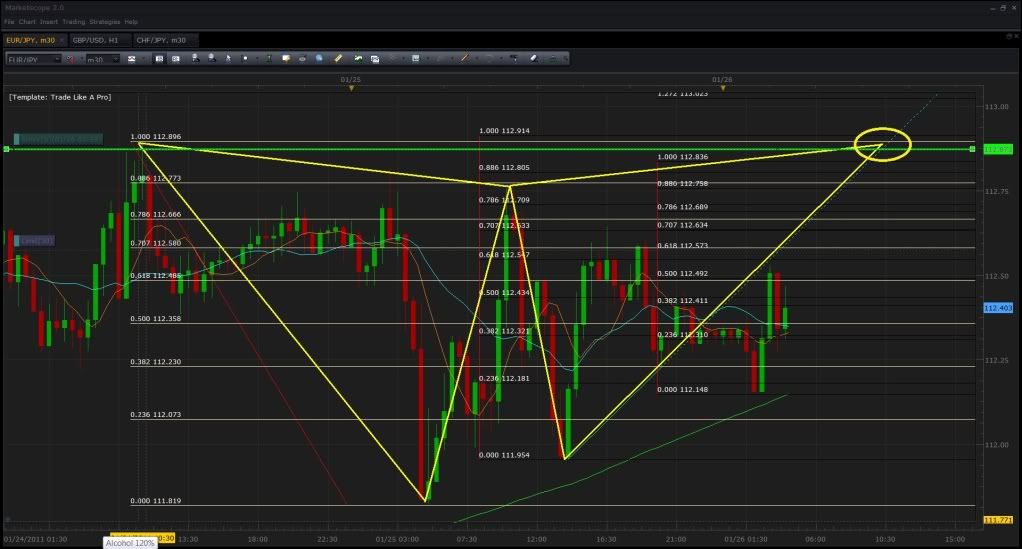
Above the EUR/JPY is reaching a rare Gartley pattern with a similar distance of that presented by the EUR/USD. Here we see that the 1.0 of XA converges with the 100% of CD. Typically I wouldn’t take this rare trade, but their additional convergence to validate the entry. To clarify, on the CD Leg their is also another 1.0 XA converging with its respective 100% CD.
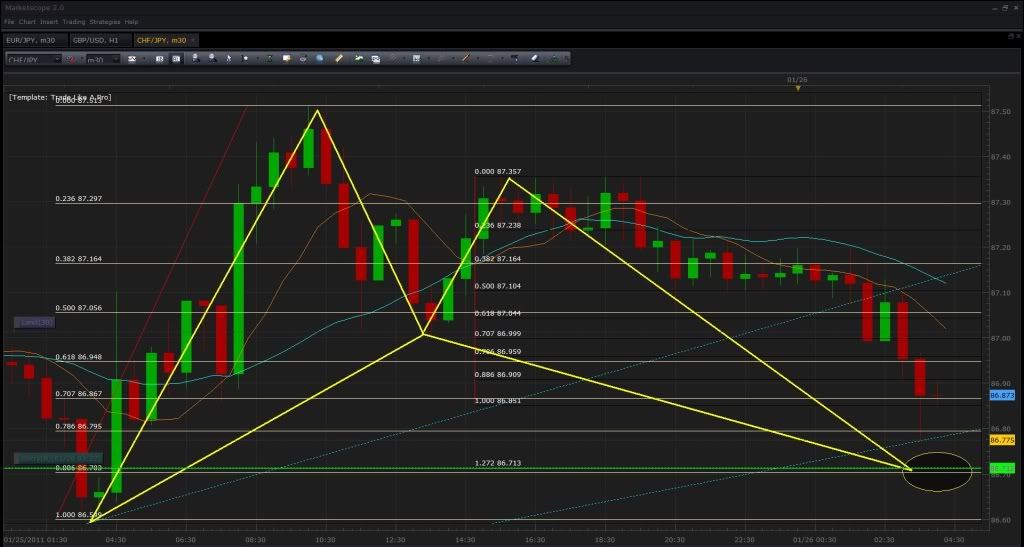
Here we have a nice Bullish Gartley developing on the CHF/JPY. Where the .886 of XA converges with the 127% CD. As you can see, price is currently holding up on the .786 and 100% CD convergence and can definitely take off from here. The reason why my trade is lower though, is because it closed too close to the convergence for my comfort on this pair and a retest of the .886 price area seems logical.
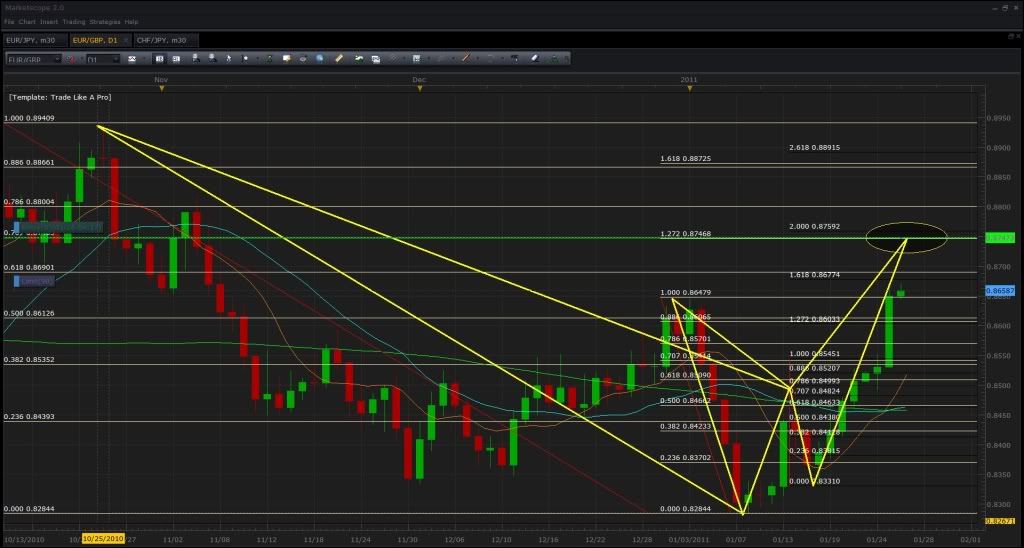
Now for all of you who have been waiting for a major retracement on the EUR/GBP, look no further. Above you will note that on the daily a the .707 of XA is converging with the 127% of CD. Not only is their a major Gartley forming itself here but when using a closer X point, a butterfly forms where the 1.272 of its XA also converges with the same 127% CD. As a result, look for major moves around this area.
*The green horizontal line indicates where my entry is or should be.
