CHF/JPY 15min Bearish Gartley convertion 500 of AX with 127% CD, also converges with P1 Povit
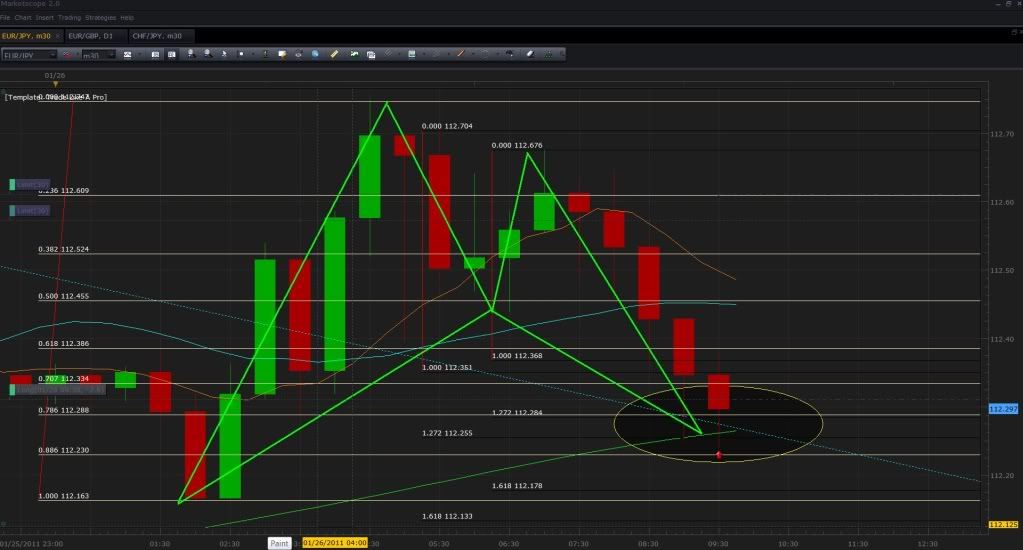
Bellow we have a 2 Gartley’s forming around the same area for the EUR/JPY. When I use the most recent leg, the .786 of XA converges with the 1.272 of CD. Not only is their convergence but previously a hammer had developed from the initial hit and when using the first 2 swings both of the CD’s have the convergence with relatively the same length. In addition to this, when we use the further X the .618 converges with this fibs along side the 200 moving average that is also holding up price. As a result, we’ve decided to jump into this trade for the risk seems minimal after a close and the news that is about to come out can most definitely spike price up towards our original targets.
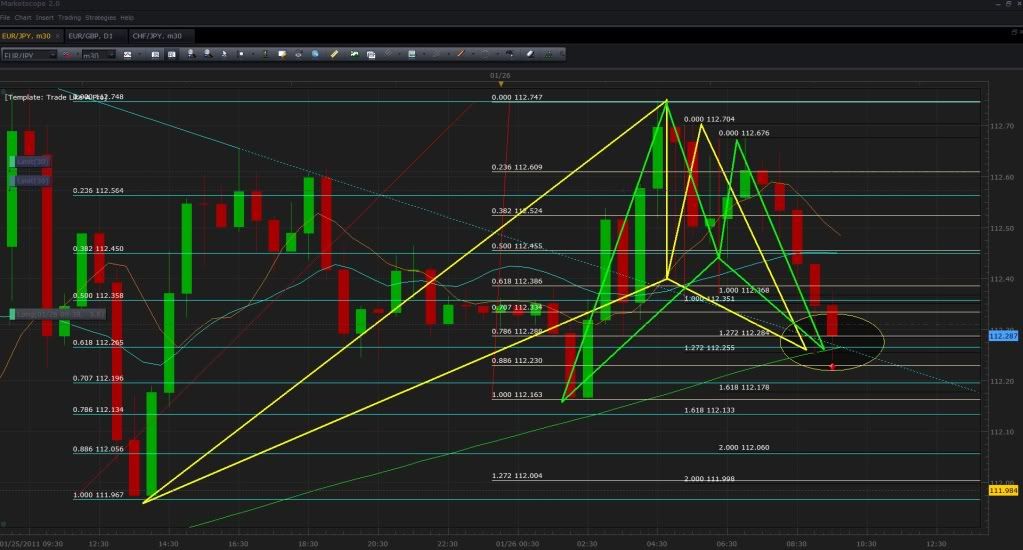
Well, our EUR/JPY trade was successful and we have received our 30 pips for the day. As for those of you who are confused to why the pair moved so bullish even though great US news had come out. Well, what you must now is that if the USD is doing great then that means the USD/JPY will be bullish which in turn weakens the JPY. As a result pairs like the EUR/JPY CHF/JPY and GBP/JPY take advantage of this and can move towards the predicted direction given the right technical support as we had seen today. Furthermore, the EUR is still at a stronger level then that of the GBP fundamentally and technically at this moment. In conclusion, bellow is my chart illustrating the move and I will most definitely be waiting for a sell on the EUR/GBP around .87473
Sorry mate, Risk Reward Ratio…
It’s crucial to understand this concept if you want to survive in this business imho… pretty sure i’ve blabbered about it before. ;p
Ahhh feels good to be back… just say’n 
Ah! Now I get it thanks! 
Yeah, RRR is an issue especially when it comes to the Gartley Pattern.
Personally I prefer pattern such as the Butterfly, Bat and simply AB=CD where stop losses can be tighter. On the Gartley it seems to be mandatory to put the stop loss at the XA level or even above which is quite a wide area from D.
Anyway thanks for the input and happy trading See you soon for some more Pattern Hunting! 
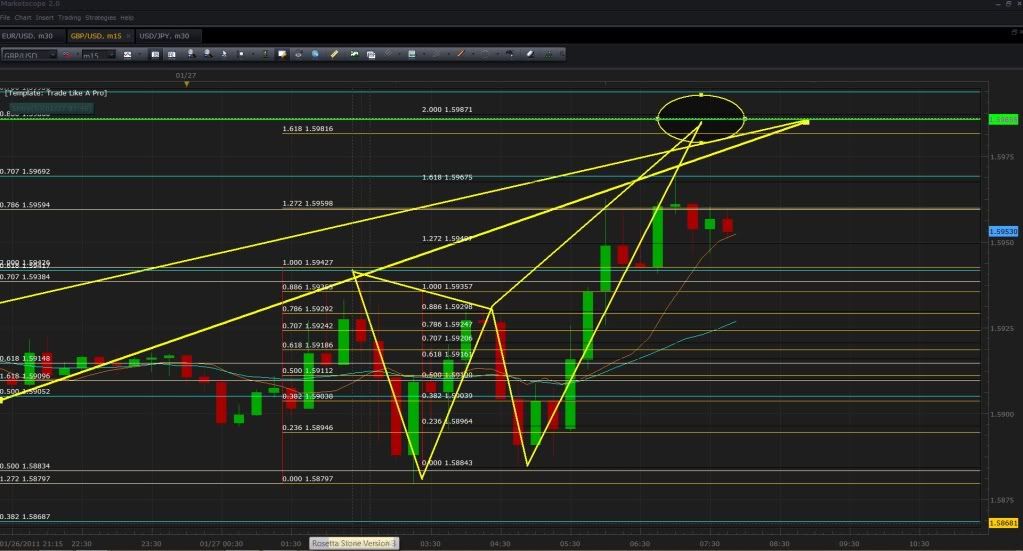
hi all …this is a EUR/JPY setup i exited just now…
just wanted to say it is the same setup TMB posted on post 4679…
what is more interesting for me to see was the setup TMB posted on post 4683…it was the same move up,that brought the price up to the bigger bearish pattern im posting…
is this pair harmonic or what

By radofx at 2011-01-26
lol…nice
Hey TMB, I PM’d you a few days ago regarding the live room. When you get a spare min could you reply please.
Regards
Dan
Hi guys! I am getting a little confused lately looking at the various Gartleys and Butterflies posted here. Probably because I’m quite a textbook pattern trader. If the convergences and all ain’t REALLY on spot I usually don’t trade them. An example would be the Gartley that I never trade if D isn’t a .768 retracement of XA. Same applies for the butterfly where D MUST BE (or so they say) a 127.2 extension of XA to be valid. Or that the AB must be a .786 of XA for a butterfly to be valid… I see often many exeption to these rules in the patterns posted here and still they work good. Could anybody give me some help with “valid exeptions” when it comes to these patterns? Thank you so much!
If the BC retracement is less then .382 then expect the market to not be symmetrical and avoid such a pattern as tempting as it may be.
If the BC is a .382 retracement (meaning it respected and bounce from the .382 an could not reach the .500), then expect the CD to reach the extentions for it has an 80% chance of blowing through or faking out the 100% CD and moving on to the 127% CD.
If the BC is a .500 - 1.0 retracement then expect resistance/support at the 100% CD (In my experience the further the retracement from the .500 the more likely it will respect the 100% CD).
All in all apart from what is mentioned above, use your logic and make sure to validate every convergence area you see with the basics such as trend lines, triangle retests, candle stick patterns, etc. (This is key in avoiding fake outs and spotting the correct convergence). Also, go over the patterns presented in the beginning of the thread. This is explained in more detailed and illustrated if you do so.
In addition, always remember to make sure to note what pair respects what fib. To clarify, if I’m trading the EUR/GBP and I see multiple convergences forming on the .382, .618, and the .786, I would take the .786 convergence for the trade because I know it has its preference towards that fib level (unless I have additional confirmation indicating that the other another fib point will be respected).
Nice, I see you limited out on the MVA’s I gave you heh. Really wish I was on to take that trade, but I’m glad you made money on it! Congrats!
Well I thought I’d post this for any traders whom trade the larger harmonic patterns. Seems like a valid set-up, and it plays out from an elliott wave perspective with maaad fib support @ the convergence range from 0.9432 - 0.94028… there’s actually a thick fib cluster right there.
I’m off to bed soon, looking to trade in the room starting @ 7 est, if you around say hi!
Chart.ly - jay_mtf: long $usdchf .9430, stop @ 93.90

Yup, you got it!
I rarely trade Gartley’s for that very reason, much prefer the 3 others + 5-0’s.


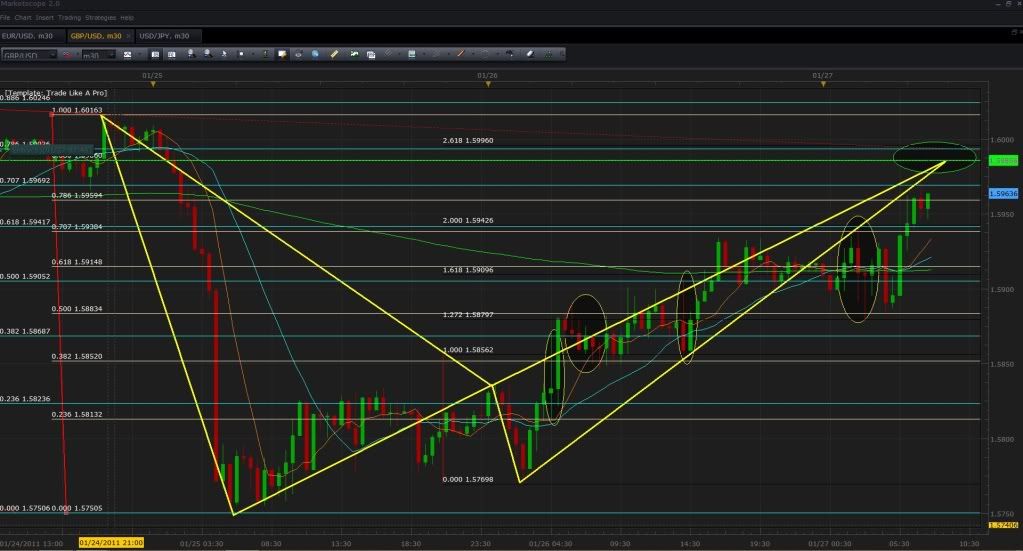
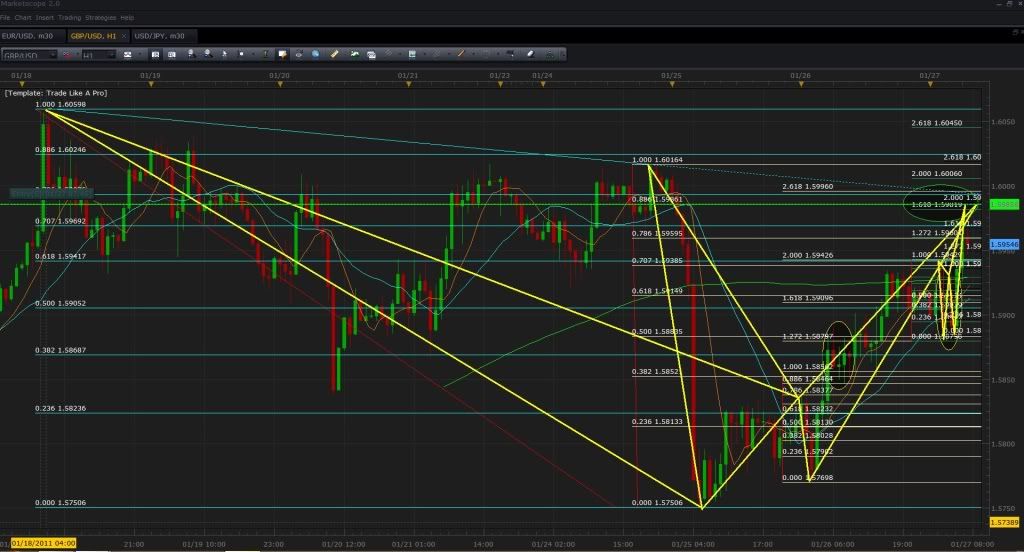
Bellow we have a few bearish patterns developing on the GBP/USD.
First their is a 30 min Gartley pattern where the .886 of XA converges with the 261% extreme of CD. Second, a 1H Gartley pattern where the .786 of XA converges with the same CD point. Last, a 15 min pattern where the 1.618 of XA converges with the 200% CD. All these patterns land its target just about the same area. In addition, the previous convergence points shown on the chart by the yellow circles have all respected the fibs and moved 30+ pips. As a result, I expect major movement at these up and coming convergence points.
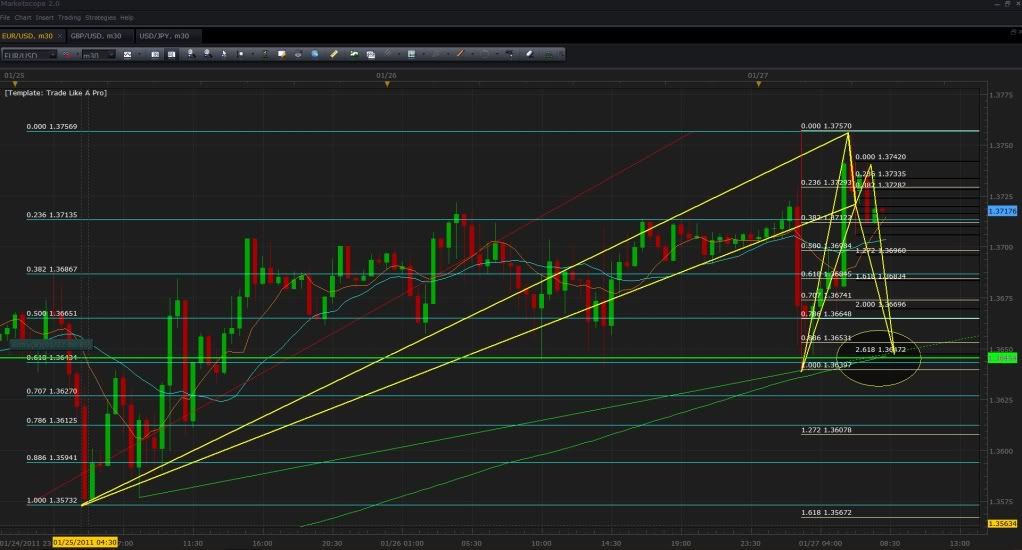
Here we have a Bullish Gartley pattern developing no the EUR/USD. As you can see, I’m showing to X points because the .382 of the smaller X and the .236 of the bigger X where both respected. This will in turn help me find the correct convergence point for a developing D point. Bellow you will note that my entry is placed at the .618 of the bigger X which converges with 261% of CD which also converges with the .886 of the smaller X. In addition, I have a low to low trend line confirming the convergence along side a 200 moving avg.
Hi Jason, I am looking to short the same setup but my reversal zone for the D is a bit higher between 83.40 & 83.50 upto R3 pivot resistance and X is anchored at 83.112 – USDJPY pair can be a very difficult pair to trade(at least in my experience lol) w\ unpredictable moves where it can easily go through yours and my zone before deciding to reverse.
Good luck.
