Does anyone know about TMoneyBags live room, how can i access it ? ive tried PM TMB but he wont reply ?
TMB thank you for GU Gartley as it already made 30 pips!!!
Here is another retracement bearish pattern that I am watching on 30m EG but far from a formation yet. There are two possible Ds: D1 at XA .618 w\ confluence of CD 1.00 and BC 1.217 as well appears to be a minor resistance area; D2 at XA .786 w\ confluence of CD 1.217 and BC 1.618 along w\ R1 pivot right in the reversal zone.

no idea… i tried PM myself, still haven’t gotten anything back, i’m sure there’s someone one here that received a message back 


Sorry guys for not drawing out the fibs, its just it was really messy with all the fibs on the chart to post, but there’s the idea of 2 patterns pointing in the same direction, as well as a trendline acting as a resistance  the pair is eur/chf on the 1hr chart if cant see
Well if TMoneyBags could just reply then we would know
lol, ill send you guys my info after I post my results. Sorry if I missed yall :rolleyes:
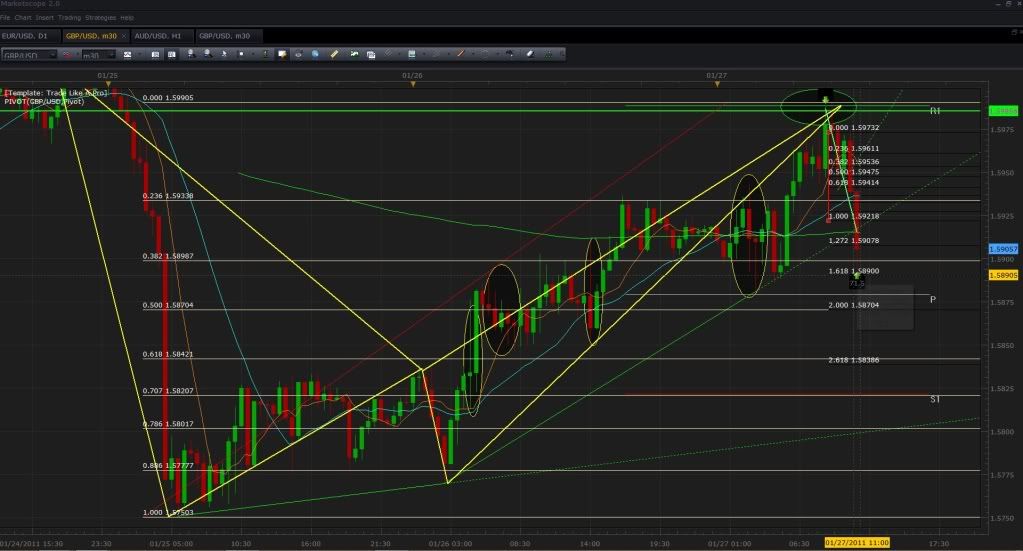
Hmpf, so after waking up late I found out that my partner HMoney messed up a bit on the trading and it was up to me to recover. This is the reason why I took my trade past 30 pips and limited out at 71.5 pips. I was able to achieve this analyzing the market with a clear head as if nothing had happened and making sure my trade entries where “on the spot”. As a result, the trade bellow was successful and the live trading room was also able to get a good explanation as to why I took this trade and how I was going to take my take profit. I would express everything further in detail, but that is reserved to those that actually join and trade with me live. Anyways a picture is worth a thousand words so look bellow. I’ll see you all tomorrow, happy trading.
*PS If you would like to learn these new techniques or simply want some live help as you trade… just PM me or post on the visitor page and I will get you the info ASAP. Have a great day guys.
GJ spoting that :), I would take the .786 convergence. Even though the .618 is a closer convergence that pair is bias towards the .786 and you also have a pivot point there confirming the area.
gbp/usd worked excellent…i got hipnotized by the trend line crossing the fib 3 pips above and the price missed my entry placed there :rolleyes:
to all who traded it- congrats!
here is a setup i took after i missed the train to bearland
i made 3 attemps to enter and keep my stop below 10 pips and finaly got the move for 30 pips
EUR/CHF bearish gartley setup

By radofx at 2011-01-27
Well today was a good day for me (2 for 2 in the room), as I came across 2 patterns before the GDP report came out.
First one is the Aussie Butterfly which I rode to the 50% retracement of the A-D swing, which ALSO lined up with the 200 sma, AND the 1.618% extension of w.i (which is an Elliott Wave fib measurement). The convergence was @ 9971 and the take profit was @ 9933 - 9930.
and the second one is a Swissy trade which was a valid set up, but I honestly made a ‘fat fiingered mistake’ and only got like 14 pips on this trade, which is still better than nothing.
Below are the pics, both trades combines would have been worth 72 pips!


ITs a bit tricky at this point bc there are 3 ‘Buy’ zones.
1 - 81.51
2 - 81.00
3 - 80.29
Will wait for further development to see if either of those ranges lines up with pivots, closer tl’s, and 15min - 30min mva’s 
Note: Pls disregard the labeling of points on the charts, as they pertain to Elliott Wave counts rather than they typical X-A-B-C-D Harmonic Pattern Labeling.


personally … i think that pattern is invalid … i would of use the previous swing high as (B) making your B point © which would be invalid …
I should have stated that those labels are Elliott Wave labels, not harmonic pattern labels.
From the harmonic perspective yes, your right, the (B) red is actually the ‘C’ of a ‘C-D’ leg that would end at converging buy zone previously mentioned
Sorry Guys, but I wont be available to teach or trade live Monday morning from 2am-8am, I will most likely be on around 10 am hopefully sooner. Anyways, happy trading and sorry for the inconvenience.
Hey,
How would I get access to the Live room?
Thanks.
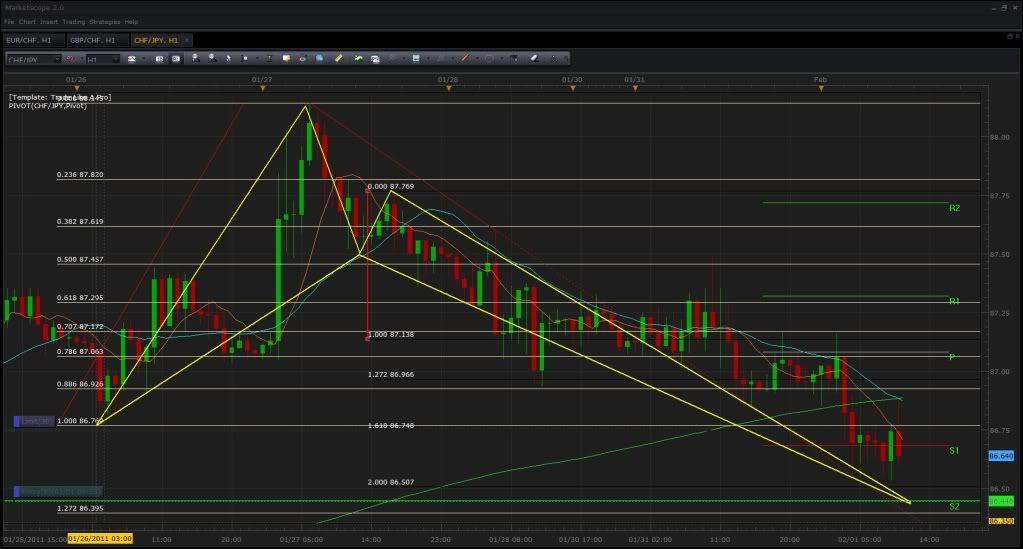
Bellow we have a bullish BF developing on the CHF/JPY. Where the 1.272 of XA converges with the 200% of CD (10 pip convergence). Not only do we have convergence at this zone, but we also have a pivot point and the support of the previous high to high trend line that price has been respecting and following since its break. As a result, I have an entry order waiting for me at the pivot point in between the convergence. I am seeing CHF strength across the board an expect this pattern to start the movement.
i got in on the same pair but based on price action… im really intrested on reading up on your trading.
hi tmoney,
how and where do we join your trading room? where can we learn more about it?
thank you

The one above me has multiple PRZs, i cant figure out exactly where it’ll reverse.

i drew a circle where i think it’ll reverse, it has good convergence point there, plus, u can see i drew a trendline which shows a good resistance, plus, if u draw daily pivots, its around R3 lvl

this one, i think it will most likely reverse at the first circle i drew, it has nice convergence lvl there, plus its somewhat in between R3 and R2 for daily pivots, i also drew a trendline on this one as well, u can see a dashed green line.
if any1 sees anything wrong with these pictures, please let me know, that would be very helpful