Excellent! 
Convergence looks good, but I wouldn’t trade a bullish pattern in this environment, esp when the markets are trending heavily downwards…
Good call swallowtail; it did bounce, but in a real ugly manner, and ended up requiring a 40pip stop loss to stay in the game  Thanks for the feedback!
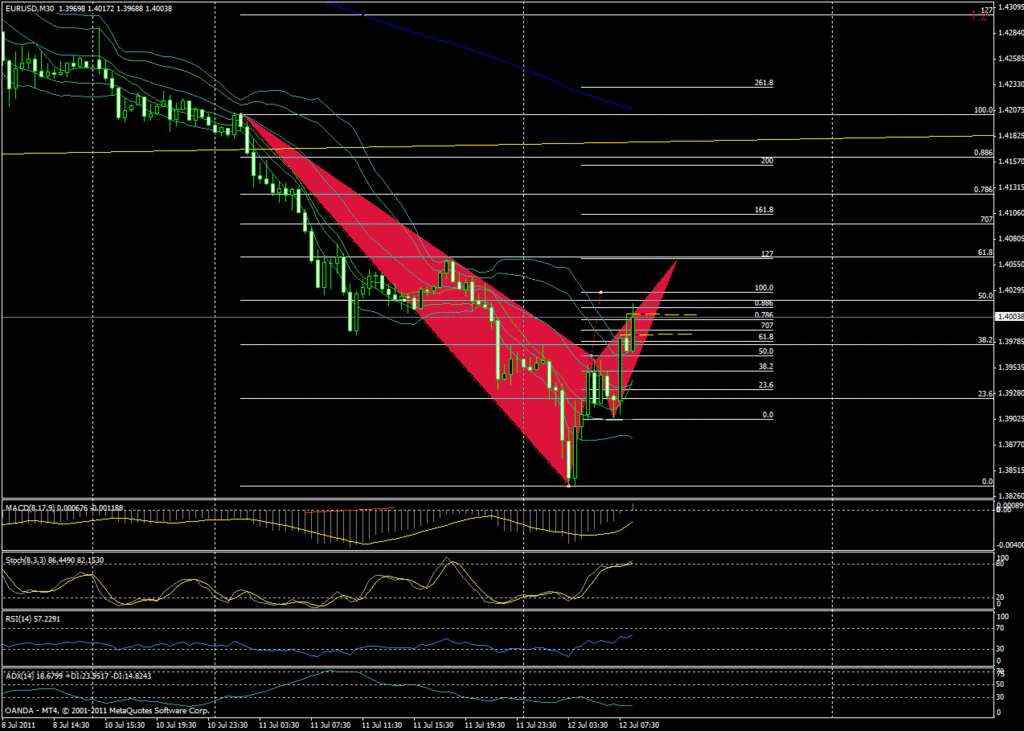
I redrew the eurusd pattern using a more extreme price as X and also got convergence at 1.618 with .50XA

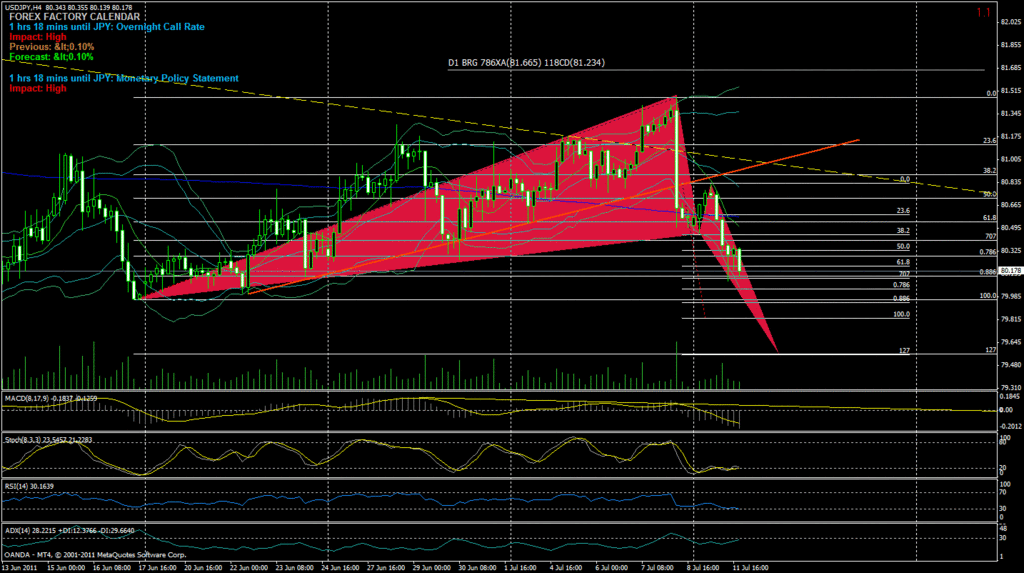
usd/jpy failed
It’s all good piporama, practice makes perfect, we’re new @ this, we’ll get better with time…
The question is do we allow an AB retracement of less than .382, and therefore allow for more extreme X’s, even though the resulting pattern is not technically valid, or locate a lower X which causes AB to come within the prerequisites defined for known patterns; or simply look for as many confluence zones as possible? I’ve read Carney (running through Pasavento now), have the patterns printed out in front of me, but would love to hear feedback from those of you who have experienced success in these ‘grey’ areas 
P.S. thanks for the kind words swallowtail
You’re right on the money piporama. I think TMB said that the B leg had to be atleast a .382 of XA, so that would invalidate my chart, as well as your usd/jpy chart… But i’m curious to know what takes precedence here.
Totally! All the primary (Gartely, Butterfly, Crab, Bat) patterns have an AB retracement range of .382-.886…though I believe there is still a great deal of possible validity in the PRZ (in our charts) when considering only confluence/convergence areas. I hope I’m not diluting the purpose of this thread, and apologize in advance if this is the case…
For the record TMB’s methodolgy utilizes an AB retracement of .236-1.0 (TMB’s ‘Rules of the Trade’, point #4); so it would appear that, while we are - as far as I know - not utilizing pattern constraints in the purest sense, but rather more of a hybrid approach which, if it ends up being a genuine pattern, then great, otherwise we are concerning ourselves more with the concept of general confluence zones. TMB, if I’m completely off base, I hope you’ll take a moment to clarify…TIA!
EUR/USD M30

Possible opportunity, could find additional support at ascending trendline AND Bollinger bands; happy trading all…
[B]Failing! Bernanke speculation probably affecting…also, we’re in ‘fakeout’ time (thanks TMB!)[/B]
as far i kno from this forum and some trading books i study for these patterns… minimum requirement for the AB leg is atleast .382 of XA, below is not a strong signal… `Typically AB is .382 or above of XA``
gud luck n happy trading…
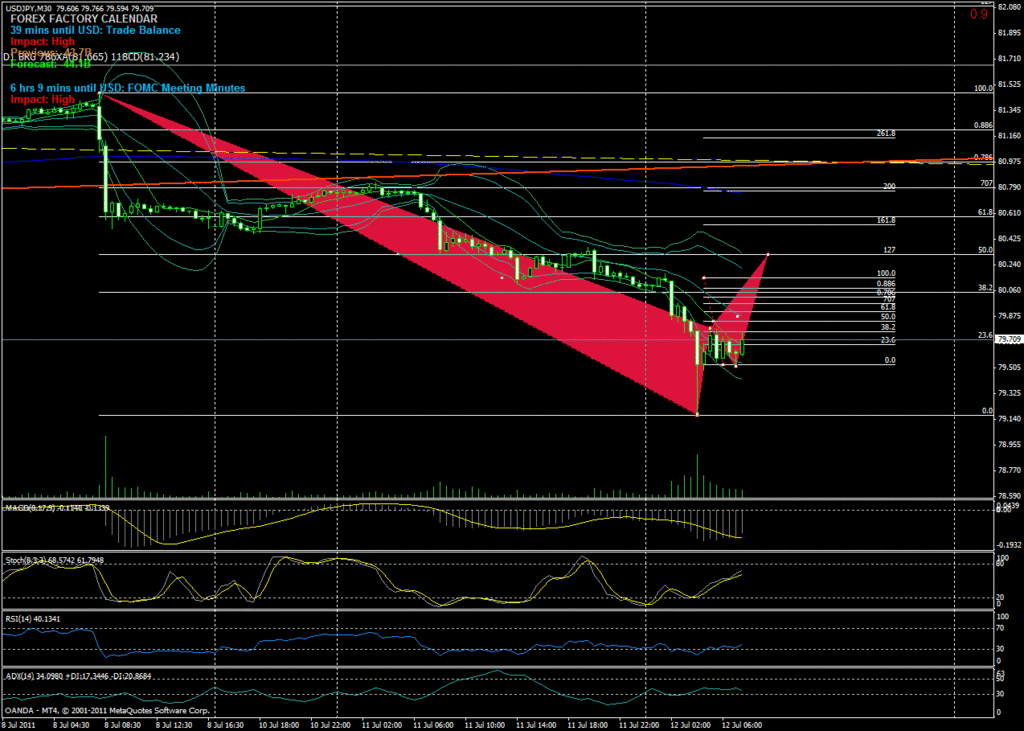
USD/JPY M30[/U][/U]
Good morning all!
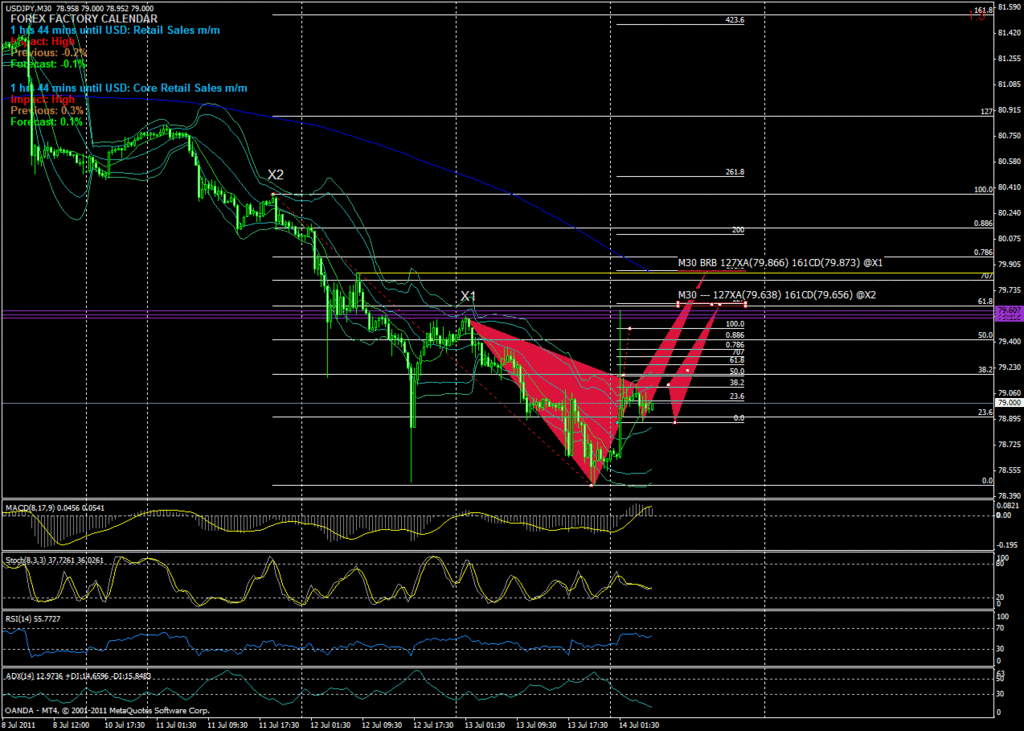
There are a couple of possibilities here. Using strict pattern boundaries, we end up with a bearish butterfly when using X1, which coincides with a prior swing high (yellow horizontal line); or, using a more extreme X, but maintaining a minimum ‘B’ of .236 (as per TMBs methodology) we end up with good convergence/confluence at a lower point than the completion of the previously descibed pattern. What I like about this one is that it’s (possible) completion coincides with the 200SMA (the blue descdending line) AND what a prior S/R line/range; specifically the 3 purple lines, the bottom 2 represent the lower shadows of a bounce which happened May 5, the upper of the 3 is the lowest close from those 2 sessions. The really interesting thing here is the 65pip upper shadow which occurred earlier today, which just happens to pierce the upper purple line before receding.
Personally, I like the second option better - thoughts?
P.S. Does anyone know what might have caused the ‘spike’ I mentioned earlier? Did Japan, at least verbally, intervene in an attempt to raise the currency value? Don’t quote me, but I recall reading once the yen MUST be at least 80.000 for Japan to be competitive…? (answered my own question; appears it might be the threat by Moody’s to downgrade US from Aaa to Aa status…)
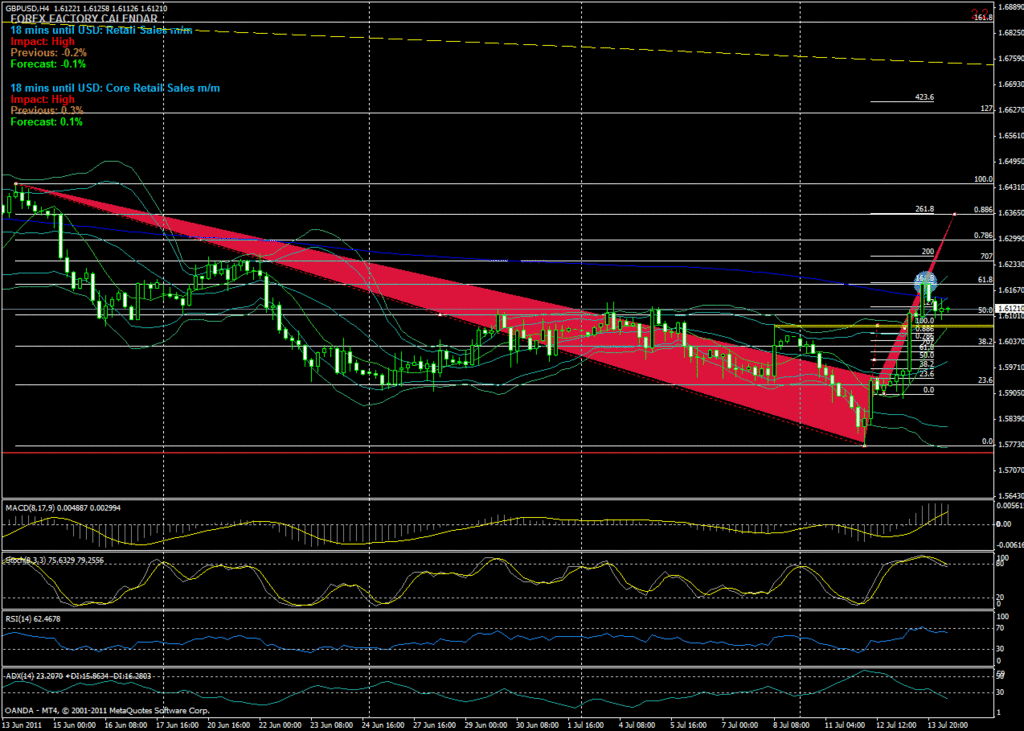
Sterling H4 Bearish Bat
Perhaps X is a tad too extreme? We had a real nice bounce @ 618XA/161CD (blue circle) for 90pips, so perhaps this bat might form…happy trading all!
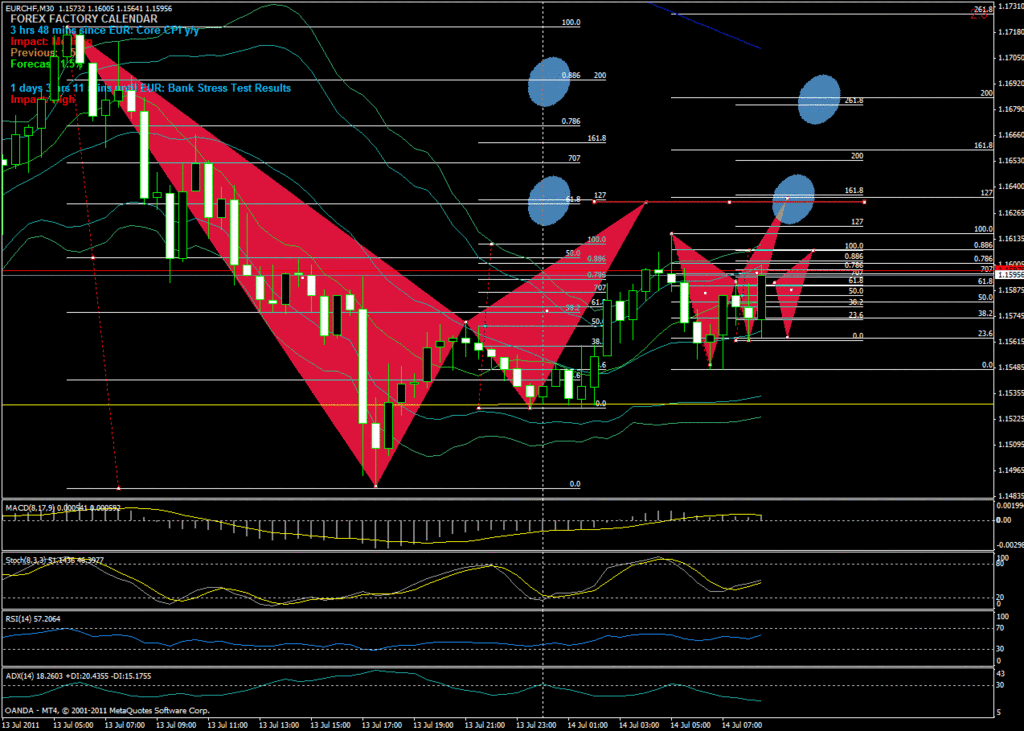
EUR/CHF H1/M30
Lots of potential  Main opportunity I believe is convergence of two patterns just below 1.16400…happy trading all!
Thanks MrPippps 
Sad, I had such a good time reading this thread (and it was a loooooooooooong read); only to find it may be dead 
C’mon people (aside from Swallowtail and MrPippps), let’s hear from you…or at least tell me where you all went :32:
