i recommend u study trade what you see larry pesavento, its a great book to study, if u really wanna learn these patterns.
a tip for u… there cannot be anyother lower low before or after C… ur C must be extream low… , if u kno wht im tryin to say here…
Thanks MrPippps, I’ll definitely finish the book 
EUR/USD 1H
Hi… I’m new to chart analysis based on patterns. I’ve gone through the schoop in babypips and studied the harmonic patterns specifically.
Here is a chart I came upon while analyzing today and I would appreciate your feedback and criticism.
a formation of a Bearish Gartley on the 1H chart of EUR/USD pair. would you agree ?
Thank you
Ali

ur pattern seems shakey to me…
Can someone define what [B]convergence[/B] means? I know it’s a stupid question, but I’m reading this topic every day and that word is locking many doors for me to understand this great strategy.
Thank TMB who shared this strategy and all users who have made this topic the better.Cya.
Hi Braindamage,
While convergence has been bandied around this thread (incorrectly imho) what it is referring to rather is a ‘confluence’, or grouping together, of Fibonacci values from DIFFERENT fib sets. All things being equal (ie. correctly placing ones fibs and knowing how to correctly identify the various patterns), those areas where confluence is greatest, where 2 (or more) fib values are tightly aligned/packed, denotes those areas (as there can be more than one) with the highest probability/potential for being a completion point (“D”).
I don’t have an example immediately handy (apologies), but there are 100’s of examples throughout this thread; also, I strongly agree/suggest that reading either “Trade What You See” by Larry Pesavento, or “The Harmonic Trader” by Scott Carney - or BOTH - is a must
HTH
Hello, piporama thanks for answering my question,i tried to do a Gartley, certainly has a lot of mistakes and I ask your help to know where are these errors.

Uploaded with ImageShack.us
Sorry fo my inglish…
Hi Braindamage 
I’m sorry, but you are correct about being incorrect The general rules for a Gartley are that B cannot retrace past X, C cannot retrace past A, D MUST extend past C but NOT X (this does not take into consideration fib guidelines). I know there are a TON of pages in this thread, but starting at the beginning and reading from there is the absolute greatest suggestion I could offer; that and reading the book(s) aforementioned. Sorry I wasn’t able to provide an example (though are hundreds in this thread).
HTH
Hi Piporama
I am very grateful for your help, but I am very confused where should I put points XABCD, I think I’ll start reading Trade What You See, I tried to learn here in this thread but I think this too advanced for me.
[B]Noob question: [/B]this book will learn everything that is spoken in this thread?
Is the OP still around?
No. There is much more to trading this method than reading that book. But the book is the start. There is much more to trading this method than is contained in this thread. I used to come here when i was a noob about 2 years ago. Anyway the most important factor to trading this method IMO is market symmetry, dont try and trade every pattern you see, only trade the markets that are vibrating the same pattern over and over.
He’s right; to be profitable in this market one must have additional tools within their trading system besides Harmonic trading. Understanding this is key to achieving consistency in account growth and surviving in the markets. To clarify, when trading patterns look for additional confirmation around the convergence levels that’s not only linked to the “proximity” of the CD-XA convergence. For example, bellow you will see the Gartley pattern which triggered the down trend of April - Today on the EU/USD.
*Note.: The following pattern was triggered on the weekly and the technique used to trade it and predict its fall should be used for all patterns which one takes. You will note that the use of a basic trend line added to the convergence of a pattern can not only be a very powerful tool, but also help you determine the correct convergence point to take and “forecast” the date/time that it should be triggered.
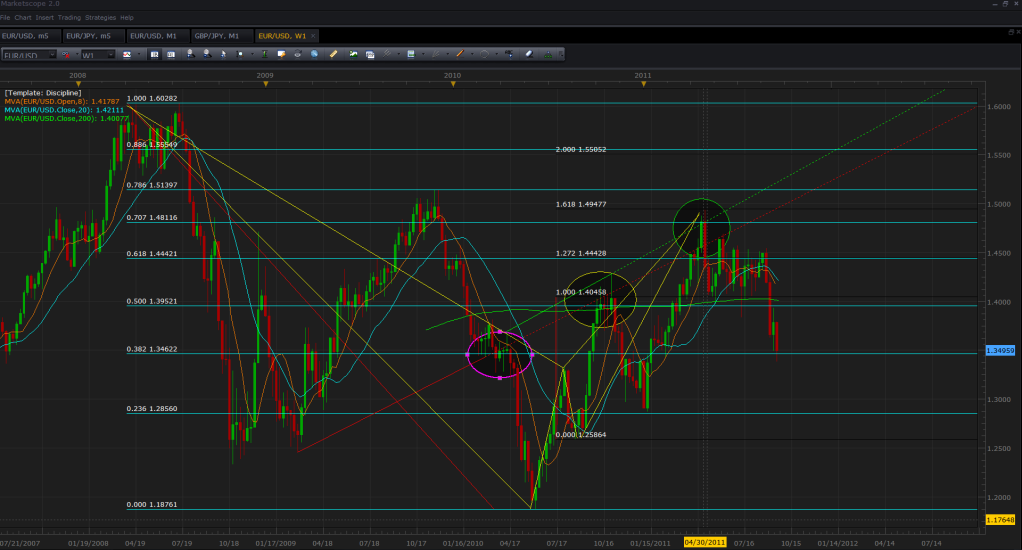
Above we have a weekly Bearish Gartley pattern with good convergence at the .707 of XA and the 161% CD. What’s significant about this pattern is the fact that we have 2 major trend lines crossing with the fib convergence point. Such convergence not only triggers powerful moves in the markets like the one we are seeing (1k+ pip move) but they also allow us to chose the correct convergence point. As you can see, after the first Gartley was triggered at 100%CD with .500 XA with a 1k pip move (Yellow Circle). We pay attention to this area because it shows that price initially respected the convergence levels giving us confidence to find a similar move up ahead. Note that price in the yellow circle is also a retest of the red trend line, apart from this we have the 200 MVA in green crossing with that fib convergence, the result is a 1.1k move from the convergence point. It is important to note that price wicked exactly from the Red trend line because it could easily repeat the same action with good convergence and it did at the 161% CD (Green Circle).
Now, how is it that we can predict the date/time range that price should hit the convergence point? Well as you can note in the green circle, the top of the channel represented by the green trend line crossed with the .707 of XA on the 30th of April. In effect indicating through January-February while the second swing (second C point) was forming that price should reach that cross around the end of April. Some of you might think well, why didn’t you show me this initial move beforehand… before it happened… well, I am teaching you how to find such events and I post this today because we are currently hitting a pattern… one which has halted the current bearish Rally which was started with an red ignition bar and ended with another red exhaustion bar (this week). I will not post the pattern and its convergence points but I will give you a hint so you can find it and take advantage of the move. First of all, we are at the bottom of the channel of the main up trend, second we have hit major fib level with convergence of the AD in the pattern illustrated above (remember AD turns into XA) and finally their are 2 crosses at this exact convergence point, I hope you find it and are able to take advantage of the current move that’s about to come. By the way, please note that this new bullish move if broken will spark and major rally so even if the trade goes against you simply reverse positions and take advantage of the break. All in all, when trading your Gartley and Butterfly patterns make sure that you use additional confirmation for your entries such as trend lines, MVA, Pivot Points, or what ever support or resistance signal you are comfortable using (BTW the pink circle illustrates why that red trend line was important before hitting the convergence point).
By the way, I’m still alive and trading… instead of giving the seminars in July I decided to cancel go through a Discipline Boot Camp in order to trade and give the seminars in order and good faith. The result has been exceptional and has boosted my performance significantly.
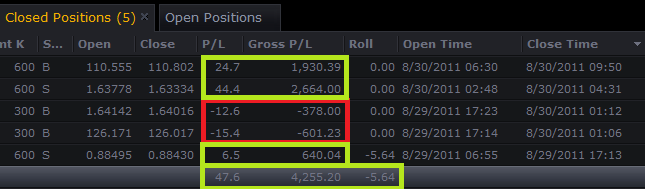
Currently I’m trading the above account with my old team and two students from this thread that I have added to the group the combination of our skills has resulted in such discipline. I show you this because it is possible to earn a living from these markets as long as you can stay Disciplined and NEVER GIVE UP!
God bless you all and have great and happy holidays this quarter.
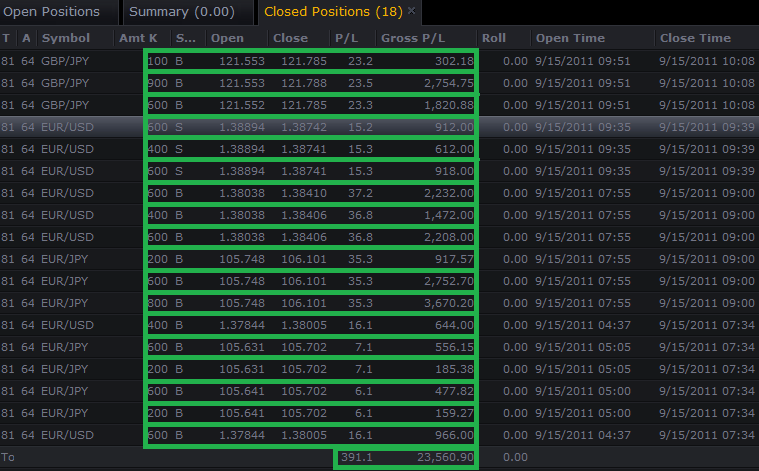
hi all…just wanted to back up TMB at his last post with few quick chart i took of the Price Action taking place for the
very same trade
lots of happy bears were wiped out with this move…its always good to be able to predict it with few trendlines…
LOOK at your weekly chart from time to time!

By radofx at 2011-09-23
and the 5 min chart…true as always

By radofx at 2011-09-23
The point were YOU take money off the losers in this business is the point were THEY call YOU a PRO…
happy weekend all
Interesting, but… [I]looks at thread title and scratches head[/I] why would I want to keep my money at bay? LoL.
Glad to have you back TMB! Your inspiration to all harmonic traders. Ever since I found this thread last year as a lurker I knew harmonics was for me. Immediately bought Larry’s book later on Scot Carney’s books as well. It’s been quite the journey since then. Just wanted to say thanks TMB and those who participated in this thread for taking the time to post all of this information. Really has been a great help. Hopefully this thread can be active again.
It means that you “fish” your money from the market (river) and keep it in your wallet (bay).
Hello tmoneybags. Is there a place I can go or a book I can purchase to learn more about his strategy?
Hi TMB,
first and foremost, i must take my hats off for inventing this thread and keep it alive after for so long…
I have a question for you, could u please tell us how u exit a loosing trade or a failed signal after entering the trade.
thanks.
Hi all,
Im newbie, just learning trading, have any1 can share with me they experince?
Ah, I see. I thought you were using the actual meaning of keeping something “at bay”—as in keeping something unwanted away from you. When I read the title, I was like, “Why would I want to keep my money at bay (away from me)?”
Anyhoo, thanks for clearing that up.