so glad that you are still in this thread, im currently still at page 46 of this thread…barely 10% but I will definitely go through it all…
What I want to say that harmonics trading truely works but ofcourse it requires a fair amount of time understanding every corners if the market. at times I was like forcing the price into a pattern ( learnt the hard way it’s a big no no ) so I am still learning on how to see the Fibs converges, calculating how many candle sticks it takes to form a pattern in m15 frame, etc…
I have bought the book as well by Larry Pesavato but only arriving on 7th July ( I live in Asia)…
Well, if you still where not bullish on the Euro pairs this month… I hope you guys are now :). For the first time after the 8th of September price has closed above 107.613 on the EUR/JPY which is a major support/resistance level. In addition the pattern triggering this move from the weekly still has not reached the .382… meaning that a 150 pip movement towards that zone (90%+ chance) is still underway. I predict the EU reaching the 1.44-1.47 level before reaching major resistance (consolidation…) and the EJ should reach 118.501-117.826 by the 26th of November. If the market stalls and doesn’t range with sufficient “speed” I see this reaching 114.646 by February 2012. In short, be on the look out for 5min, 15min, and 30min patterns towards the bullish side because the current market outlook is fundamentally and technically in harmony. In other words, be very cautious if taking any counter trade against the current trend… Now, please keep in mind that this is true until we reach and after we break the .382 level at 109.390 (EJ); if this level does not break, expect the market to range between 109.390 and 106.102 throughout the weeks. Wish you all the best in your trading and congrats to every one who payed attention to the analysis that Cashdemon and my self posted a few weeks ago, you should be reeking in profit :).
On the EU weekly is this the rough pattern your looking at - have i got the ABC swing points correct ? (my Charting package is down at the moment so i had to draw over your previous weekly chart - fibs are incorrect as a result)
I’m not sure I get you…if it will reach 118.5-117.82 by Nov 26th then obviously it will reach to 114.646 before Feb 2012…or do you mean a retrace back down again to 114.64 after reaching between 118.50 & 117.82?
The trading techniques we use allows us to “forecast” the date of price reaching a zone with a good amount of accuracy. The reason I state the lower point reaching during February is in the case that the first prediction does not reach its target on or near the first estimated date.
For the EU… yes, the weekly/monthly closed bellow the convergence point at 127% CD and the .500 XA convergence. Once October opened it found support on the 161% CD and created a morning star off the point and on top of the 500 convergence area (weekly), resulting in a fake out and confirmation of the buy. Currently price is bellow the bottom of the weekly up channel it broke and should push another 250 pip higher to close inside and later retest its current level; this push should occur between today and the 1st of November the latest.
I’ve been reading and practicing the harmonic trading ways. I have just decided to be posting.
Though I’m still on demo and have little like 100 bucks to start up with, what will you advice me to do?
Also, what is the significance of harmonic numbers to a particular pair under study?
This morning, I saw a bullish gartley on the audusd 15/30 t/f and there was perfect convergence at 131.0 fib of AB length with .382 XA and the completion of the AB=CD leg is just some few pips away from this point. However according to my study of the Larry Pesavento book, and my study of this particular pair with this t/f, the length of the AB is very common on this time frame for this pair.
And so, it did retraced at the completion of the AB=CD. I didn’t trade this lol…
Still learning…and due practice should take me to my destination!
Why? Those patterns give you a huge edge over the market!
When you have a bullish Gartley you should buy AFTER the D completion point and you should also place the stop loss a little bit below the X point. The opposite is true for bearish Gartleys.
With Butterflys is a little bit more complicated but you can wait after the reversal has taken place to ensure you more profit probabilities.
m15 chart of the USD/CAD. Bullish Gartley & Bullish Butterfly possibly forming. The 1.272 of CD converges with the 1.00 of XA. Also, the 1.618 of CD converges with the 1.272 of XA almost perfectly. The amount BC retraced leads me to believe that the 1.00 of XA will hold; this area was tested twice previously and held (on 10/27 & 10/28). However, the AB leg took about 105 minutes to complete, but the CD is no where near completing and has taken about 3 hours to get where it is now, so I guess I am going to have to wait and see. Let me know what you guys think. Let me know what you guys think.


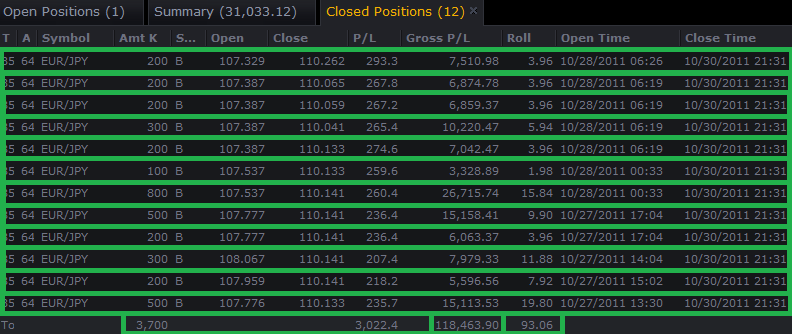
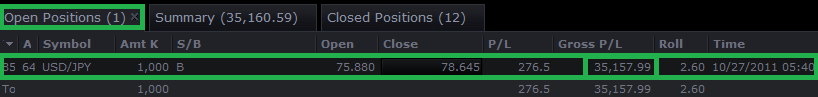
 Here’s the results of our hydra: