Hi piporama,
Just wanted to comment that I believe C should actually be the lower low to the left instead.

Hi piporama,
Just wanted to comment that I believe C should actually be the lower low to the left instead.
Hi Sweet pip According to rule C is lower low at left.
@piporama, thanks for noting, the third fib was accidentally deleted when i was dusting the chart, the fib lines could make the charts look clumsy sometimes, I almost wanted to take all of them off, for the purpose of your notice and in line with the good spirit of TMB’s teachings I am going to edit that image ASAP and replace it with one showing the fib convergence…
Wow, this thread has come back to life, excellent! With respect to C (actually my-bad folks, ABCD really shouldn’t even be there to begin with, as I believe there aren’t any patterns to speak of). Regardless, if you refer to my method for selecting candles (my original post), you would find the bearish candle at C is the ‘orthodox’ low at that point, for that timeframe…thanks for keeping me on my toes 
just to add, piporama, i am actually trading this method with some additional technique i found in the book written by Scott M Carney, “THE HARMONIC TRADER”, he actually made this levels more specific and he utilizes three fib convergences for his potential reversal zone’s (PRZ) i have been very comfortable trading them for the past three weeks as it is easier for me to stay disciplined, for me trading this way removes guessing from this technique though, the trade either works at this level or it does not, then i wait for another set-up, I still use TMB,s exit strategy of candle close outside PRZ… and so far my experience has been pleasant, I am live trading this on a mini.
That’s great panmic! In the end whatever makes you successful is definitely the way to proceed. I only profer the potential for refining/tightening/confirming your convergences. Carney’s book is a classic, and it’s great that you are able to take the best of this thread and outside sources to create something unique for yourself; when you’re bored, take a closer look at my suggestion for selecting candles…it’s not a system, just a perspective.
Cheers and happy trading
Thanks! of course i am taking a look at it (your suggestion), in this game you can never know too much ;), will give it enough screen time to see if it qualifies to go into my trading toolbox. For pesavento book, i read that too. another reason i went this way, is that i found out while studying some of TMB’s earlier post’s, some of the patterns he posted also conform to what carney projected in his books, (enough to get me into enough trades) but as you can see with a bit different approach. The one i posted earlier on would have qualified to be a ‘BAT’.
thanks and happy trading also…
buy eur aus  i will 2morrow longterm… find a good entry
I can’t see why you would buy…unless i’m looking at the monthly timeframe…and then my only reasoning would be that it’s been consolidating…and ready to retrace and hit @1.4981??
@piporama,
if i had drawn this your way i would had gotten into that one, i missed it by six pips, thanks for your suggestion once again.
i can’t see either…anyone have charts to share? :53:
@Pr1NZ You’re welcome, glad I was able to offer something valuable Though keep in mind it’s not necessarily the ‘right’ way, but rather ‘my’ way; the only way to be certain is to draw them a few million times Cheers!
hmm but my gut feeling is telling me my ‘C’ is incorrect…read it elsewhere on how to place my fibs where the wick looks like in my chart but i couldn’t recall the details.
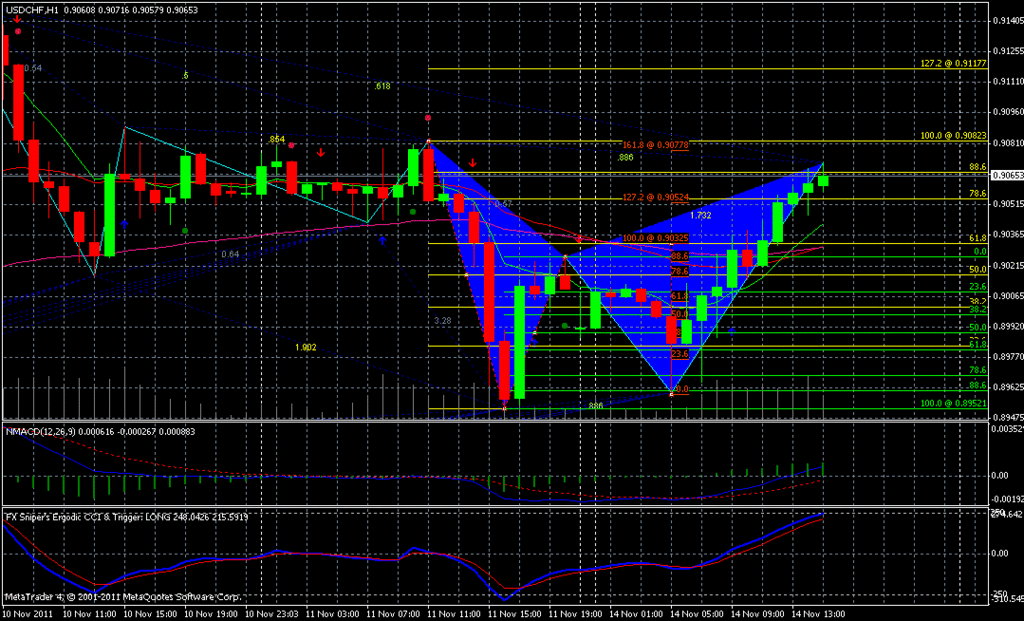
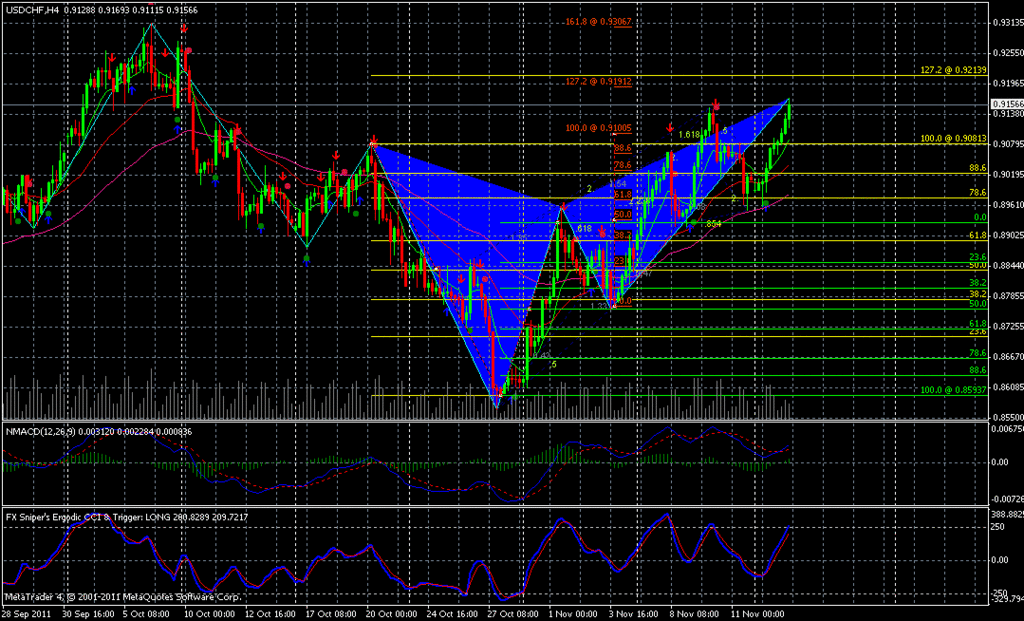
the USD/CHF Gartley yesterday failed and turned into a Butterfly, but I couldn’t find any convergence point…
any advice please?
Hi Pr1NZ,
If you move “X” to the high on 10/06/2011 in the morning…you will find better convergence (.786XA=1.000CD)…see my charts below…
(I got stopped out in the 30 min chart, where I circled it blue…if not, I would have made over 100 pips)
30 Min:

1 Hour:

4 Hour:

If you find no convergence:
Invalids:
thanks StuPip! :33:
Convergence with 100.0% CD and the .382 of XA, wanted to know what you think about this chart, the minimum for XA converge is .50, right?

Uploaded with ImageShack.us