I’ve got EUR/JPY at about 107.800 to sell, very soon!
You guys?
Hello people,
Been lurking around in this thread & website for a while now. I’m practicing and learning alot, however i have a question regarding the entry point.
As you can see, i drew a gartley on the USD/JPY chart. My understanding was you can set an entrypoint on the CD leg once it comes near or between 1.000 - 1.272. Yet it kept rising through the 1.272 line, hit my S/P and found it’s entrypoint at the 0.886 line from XA. Now this isn’t the first time this is happening. I seem to enter a fraction too early before the pattern is fully drawn.
Could anyone be so kind enough to clarify what i’m doing wrong? Do i need to use XA line to pick my entrypoint, or was i right to use the CD line and just got bad luck? Thanks
PS.
Red Circle = Entry point

It’s kinda tiny… Oh no! You need at least 5 posts to be able to include links in your messages.
A better view of the picture is in here “postimage-org/image/e4eiorjbp/” (replace - with .)
Your XA leg is very important, and the 1.272 of CD is closer to the .886 of XA fib, so the price retraced from there, instead…kinda surprised it didn’t go all the way up to perfect convergence with 1.0 of XA, but that may happen a bit later…keep watching this for reenrty opportunity…my sell on EUR/JPY looks like I’ll be waiting,too
Thanks for responding so fast! So if i get this right… As soon as CD 1.000 is exceeded, i have to watch where the lines are merging, if not, really close to each other and look out for entries there on the XA leg, instead of CD?
Also now you notice about EUR/JPY, i drew a gartley earlier this night aswell on the M30 timeframe. However, i made the same mistake to look more towards the CD leg instead of XA
You want to look only above 1.0 of CD, yes, but then only for the closest overlay of both fibs, convergence!..and the price is coming back up, now!
Yes, only above 1.0 of CD, then only the closest overlay of XA fibs over CD fibs, convergence!
Allright, thanks a bunch for clarifying it to me. Gonna keep an eye out on these convergences from now on.
If you want to better understand the Harmonic trading approach you can visit GuSwarm as i am publishing some articles about my stile of trading.
I’m not selling anything, it is a step by step guide.
Thanks for sharing, will take a look into your articles. I’m actually reading the book recommended by TMB as we speak “Trade what you see - How to profit from pattern recognition”.
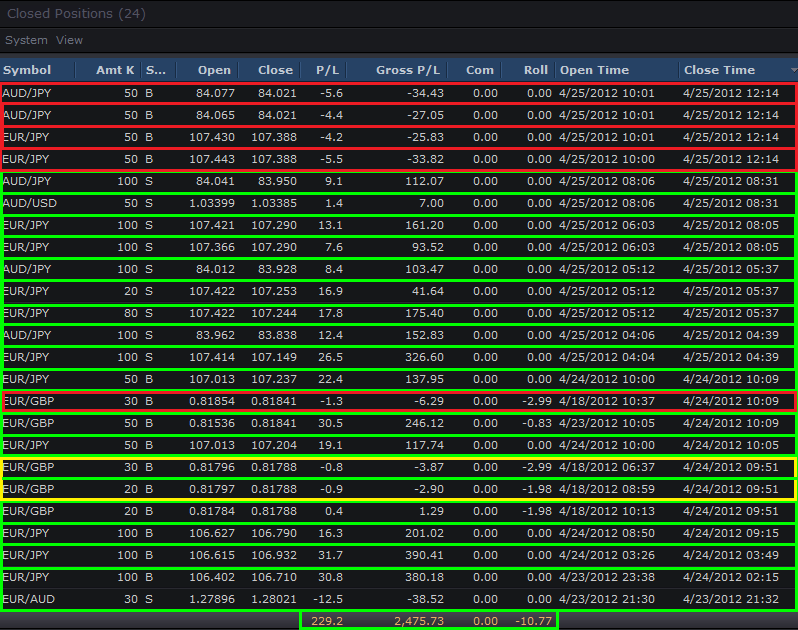
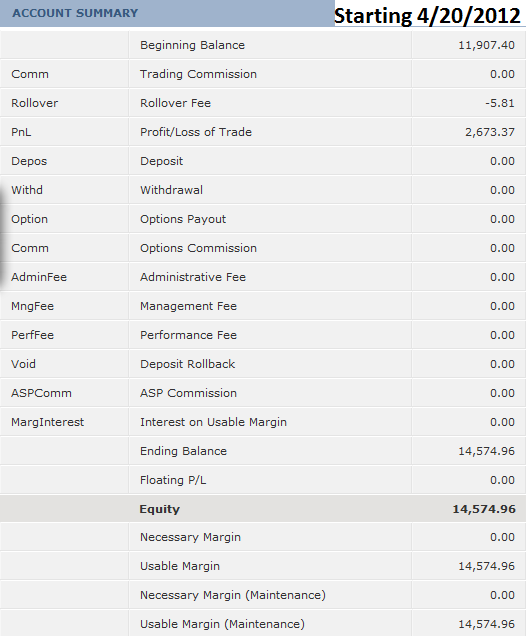
Hello All, since the 20th of April I have been trading a new account solely with Rado (AKA cashdemon) and will be moving to Europe next week to prepare for the London accounts we will be managing. In effect, we will be posting our results here on the thread weekly and will begin to record market predictions within the thread as well (as I did with the first accounts you saw me trade).
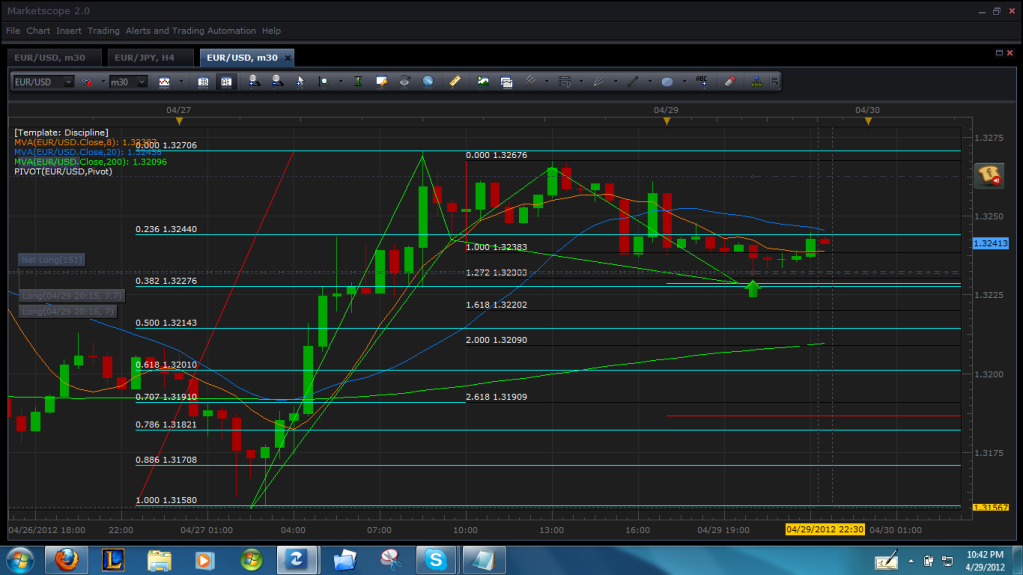
Good evening, currently we are buying the EUR/USD which has triggered a Bullish Gartley; where the 127% of CD converges with the .382 of XA. In addition, please note that the gray line adding to the convergence is a pivot point and apart from this… their is a “Magic Line” on top of that convergence.
Our Target is 30 pips and as you can see the limit looks far away because the current bars are too small in length (meaning that the pattern has developed during consolidation. Our exit is a close bellow the convergence point and if this happens we will reverse our positions towards 1.31909.
Ok, I exited the EUR/USD because I did not like the fact that its been lingering around these levels for too long and am sleepy heh. In addition, we are expecting a buy for the EUR/JPY around 105.644. Bellow is the result:
I had a buy for eur/jpy at 105.97, there are multiple patterns completing there, why wouldn’t you enter there and enter at 105.64?
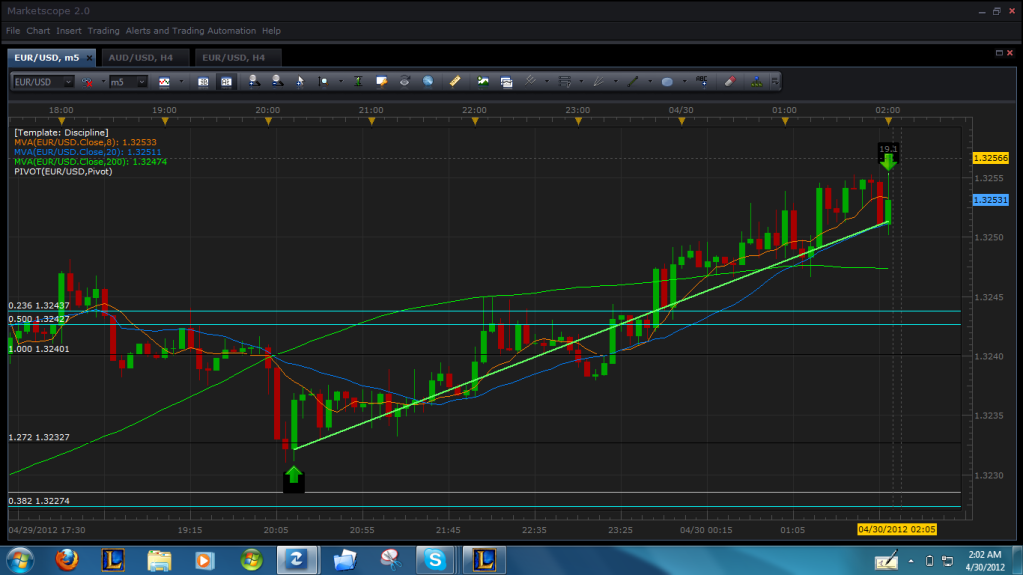
Very nice bullish butterfly on EUR/USD 30min TF, took 50pips.

AUD/USD Bearish Gartley already formed and ready to be traded. Opened a short position at the 78.6% of the X-A leg.
Check How to recognize and trade harmonic patterns first Video./

TMoneyBags, i really want to thank you because your thread inspired me to take action and learn Harmonic trading.
Thank you so much for that.
P.S. I play League of Legends too! And Dota2!
Wings.Of.Fire is my LoL name on US Servers and Im lvling one on Europe West with the same name… feel free to add me any time :54:
Hey, how did you make the taskbar black on your marketscope 2.0? I can only get the chart portion of the page black. The way you have it set up looks amazing!
hmm… think your talking about the color scheme, on market scope you click on file => Options => Color Scheme => select Dark (Black)
Was good for 50, but I didn’t take it bc I’m weary of taking trades at the beginning of the week…esp before the London Open.
Lastly…
"TMoneyBags, i really want to thank you because your thread inspired me to take action and learn Harmonic trading.
Thank you so much for that.
P.S. I play League of Legends too! And Dota2!
"
Minus the video games…go get sum fresh air guys! hehehe 

