Close the sell break even, we’ll try again tomorrow  have a great day guys.
Hey. I did it again because I was very suspicious about the activity. I re-did the B-C line which was not far apart. I had to gamble with this. HOwever, when finding C-D, I saw convergence at the 0/20 % and placed an buy there. Turns out my suspicion was correct. But I am a little confused when to take it out -__-Where should the stop order be placed? Anyone?

Hey TMB,
How did the two trades on EURJPY around 104.95 and EURUSD (1.303-1.308) turn out? I was a away from the markets a couple of day and would be interested in how you handled those situations?
Also I see that you have a few indicators up that you use in additional analysis
pivot points
mva 8
mva 20
mva 200
Are these what you use for most pairs? Or is it typical setup for EUR/JPY?
Also how many and which pairs do you focus on in a week?
Ive got more questions if you have got nothing better todo.
Why the entry at 103.50? My guess would be because its halfway between the convergence of 103.73 and 103.24? Did you enter before or after price dipped down at the 261.8%?
You said “s you will not in the following Image both these patterns converge at the same area and we will continue to ride this move towards the .382 of the bigger pattern if and when the current .236 fib lvl (from the butterfly) breaks.”
Does that mean that you will be continuing to look for sell patterns ifless the .236 108.0 is broken? And by move towards the .382, do you mean the convergence of 161.8, what i would call 61.8 of XA at 102.55?
Thanks
i been having a hard time finding patternes today anybody else
What do you think about this possible Bat on UJ@1H?
I see confluences on 88.6XA, 161.8BCD, 127AB=CD, also it is in the same direction of daily trend…
EDIT:
I forgot to say that it also converges with weekly and daily pivot

EURUSD potential butterfly…
and Cad potential Gartley, both hitting D points at the SAME time, usually a good thing.
To top it off its corresponding with a gartley on the S&P500 also, which happens to have a convergence level right on top of a support line.


Hey gentlemen, hope u all doin well
I want an expert opinion on this , is it a correct Gartly??
EUR/USD 15m
AB .68 of XA
BC .32 of AB
Sorry
.38
.61
Hey TMoneyBags. If you’re not too busy, I was wondering if you could confirm these patterns for me and maybe let me know if
there’s something I can improve on.
EDIT: Damn the uploader really shrinks the files, and I can’t post links  I’ll post the urls to the full pics in plain text.

^Full size: i.imgur.com/hTX5i.gif

^Full size: i.imgur.com/OeSjL.gif

^Full size: i.imgur.com/VrFUq.gif
I know the convergence isn’t great for some of them, but these are the longer term patterns that have caught my inexperienced eye.
Craig,
What is the last pair please?
Thanks.
its the USDSEK daily, if u follow the link below.
TMoneyBags i wanna say thank you for ur teachings here. =)
USD/SEK. You can view the full size image with the URL under it.
Edit: ThisGuyEria beat me to it ^
Hey guys.
Found a nice Bearish Gartley on GBP/JPY 30m.
great convergence @ 88.6 of AB and 88.6% of XA.

Hi kaboemm,
is it 127.2 of AB with 88.6 of XA?
Yea. 0.886 XA & 1.272 AB. The convergence got hit EXACTLY, however there’s no real strong downtrend unfortunately. Still possible though, i closed my trade with +18,3 pips. Didn’t want to end up in a colidation with my order still open.
For the ones who got confused. We are trading buddies
Major typo haha >.< Thanks Mones for correcting me:57:
Just opened up my charts and I saw this nice gartley on the EUR/CAD 30m.
Do mind to not copy me blindly as I’m a still a beginner and still need to learn a lot. So every feedback is appreciated 
Went short on 1.30114. T/P @ 1.29911, S/L @ 1.30243

Possible USD/CHF D1 Gartley 222 completing now? D happens to form not only on a convergence of %100 AB and 88.6% of XA, but it is also on a major psychological resistance line. However the sentiment on the internet for this pair seems to be bullish, that it will break this boundry, negating the pattern. What do you guys think?

I opened a series of trades (I know, not the best practice) after a beautiful tweezer top pattern formed in H4, but the subsequent candle makes me think it might have been a false positive? Not quite sure if I missed something important here
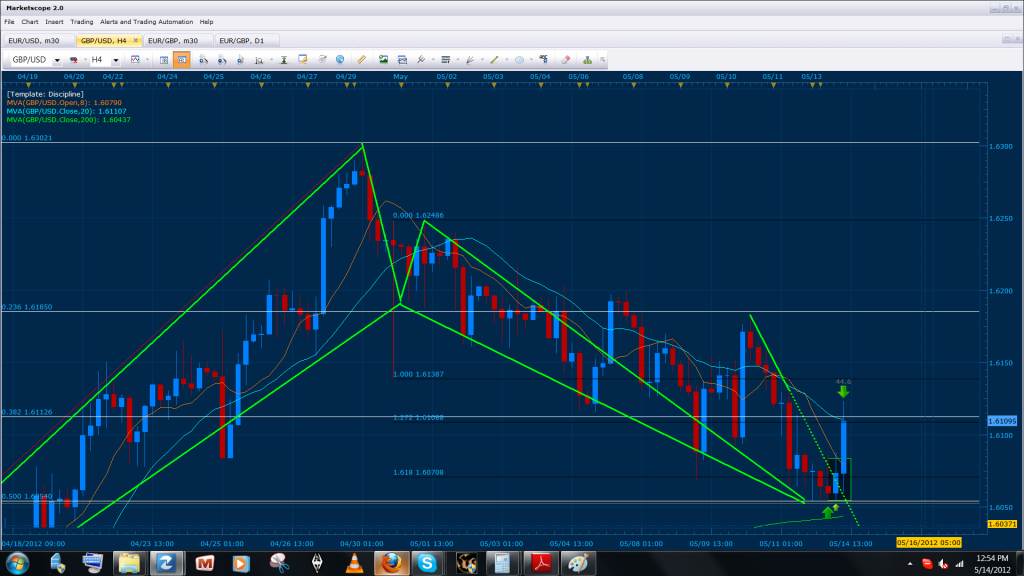
Bellow we have a 4h Gartley pattern that developed and allowed us to create a Hydra. Here you will note that the pattern had convergence at the .500 of XA with the 161% CD. Because of the fact that this is a 4h pattern, I waited for the market to give me a bullish confirmation before taking the trade… the results are explained the the next image.
Our first entry for the pattern was at the break of the flag on the hourly at 2am EST. The elephant bar that this break created gave us an ideal signal (confirmation) for entering into the trade and also allowed us to set up the hydra. The reason there was a necessity for the hydra is because of the fact that price was already 32 pips above the .500 XA but at the same time was still 26 pips away from the .236 of AD and 65 pips from the .382 of AD. In other words our chances of reaching 26-60 pips where already above 80% win. In effect, we entered with 100 lots at the initial break and left room to add two more lots of 50 each as price retested the break of the flag and the D point.
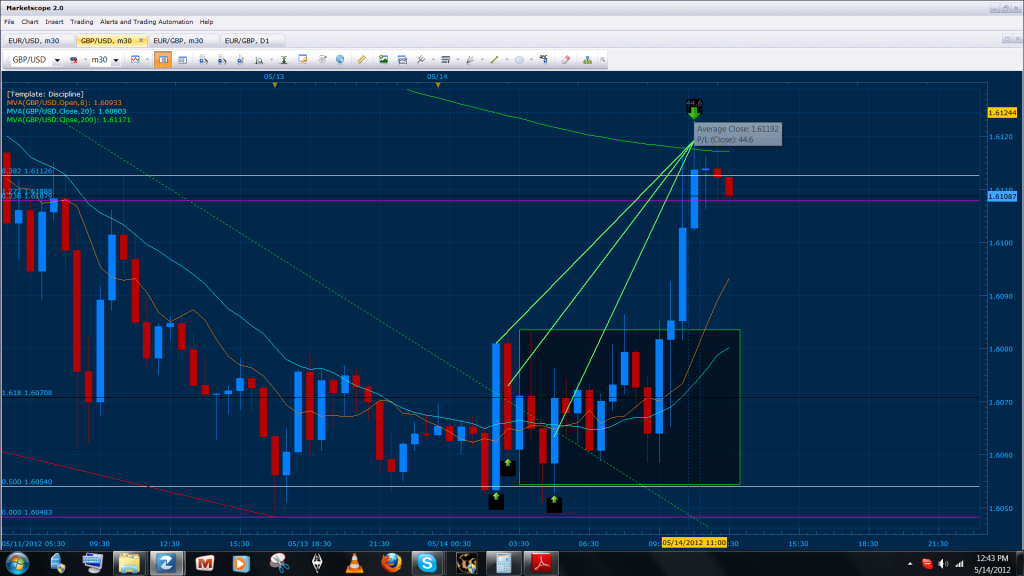
Now some of you may be wondering what an elephant bar is, and why did we enter additional lots in the trade while negative on the initial 100 lots… First, we entered with 100 lots because it is half of the maximum amount of lots we can use in any given trade with this current account size 10k-20k. In addition, if price where to not have triggered our other entries the profit from the 100 lots would still be worth while (60 pips would be equivalent to 30 pips in a 200 lot scenario). Second, when an elephant bar forms it is a signal used by the “commercial” bankers to indicate that this range of price is an ideal buy area for a continuation of that same bar (which will tend to lead to 3-5 times the ignition/elephant bar’s length). To clarify, think of the green outlined box next to the Elephant bar as commercial real estate where the further down you buy within the box the cheaper the property would be (buy low || sell high). As a result we split the remaining 100 lots into 50 half way through the area and near its bottom.
In conclusion,
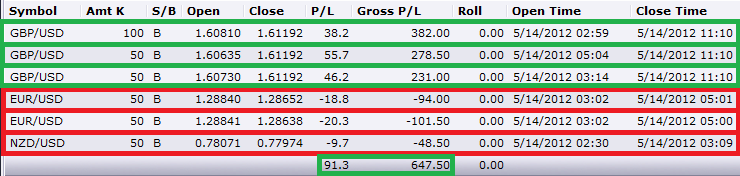
Bellow is the list of our current positions, all which should limit for a minimum of 90 pips.
Although these positions exceed 30 pip targets, the lot size used for each of these trades make up for the “distance” needed to travel before reaching its target (less risk in comparison to lot size when using the same system). In addition, the projection for the majority of these trades with the exception of the USD/CAD are hitting their targets near or before reaching the .382 of AD.

