Oh, I get it. Thanks. I should’ve examine this a little more!
You can hedge a pair by going in the other direction of a “brother pair”, of course the technique is limited and is not as accurate as hedging within the same pair; but when a thorough analysis is done, it is possible. The day that I hedged in favor of the EJ while on a short on the GJ the EJ was moving faster on the bull side then the GJ. Non the less, both pairs where moving in the same direction, in effect simulating a hedge.
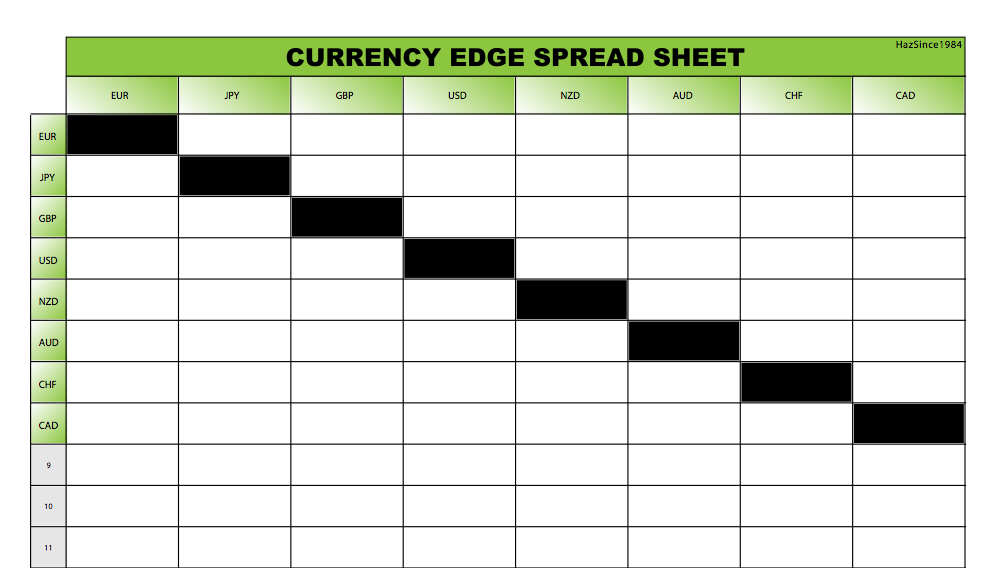
Here’s a spreadsheet for those who may need one or may want to do some analysis while away from the forum. Hope its useful…Just wanted to contribute a small amount towards the progression of this forum.
Thanks again!
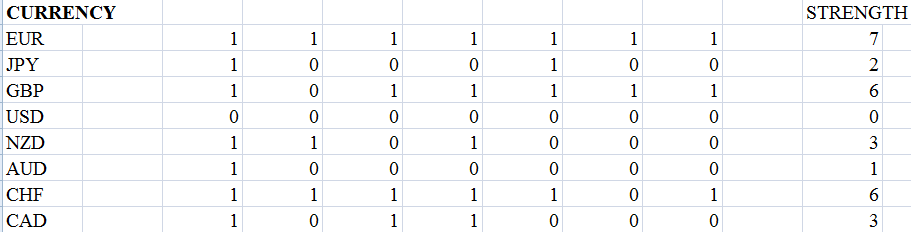
Here’s a little indicator I made to calculate the currency’s strength 
I didn’t make it to only calculate the strength at the beginning of each sesssion…it continously updates…next version maybe. So you’ll have to decide when the important time(s) to check the values are. It’s set to use the H4 timeframe, with the 200 SMA as per Richard Krivio of Dailyfx, but you can change them. You can also change the font type, color, & size.

Unzip it to the “indicators” folder within your MT4 platform folder on your harddrive. Let me know if there are any significant issues.
Strength_Table (3).zip (6.51 KB)
So essentially, with the brother pair, you would sell GJ if you sell EJ.
Also, I wanted to ask if you trade both perfect and imperfect patterns. I ask because I am having a hard time “estimating” where point D is. For example, finding the fib level of XA is easy but when you are pulling another fib from A to B to find point C, the fib levels can range from 50, 61.8 and 78.6. Do you trade patterns that have fib levels of (50, 61.8 and 78.6) from AB.
If you do or don’t, how do you find point D?
I simply make sure that the BC leg is a min of .382 and max 1.0 retracement of the AB leg. If C does not reach 50% of AB, the D point has an 80% chance of reaching 127% CD. I tend not to trade retracements of .236 unless its at the extreme 261% CD and major resistance/support.
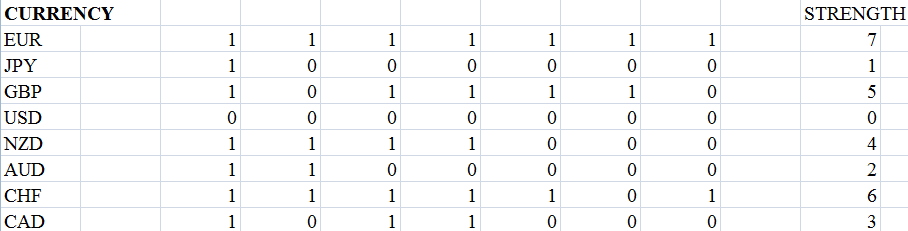
JPY has fallen 1 point in strength while the AUD has gained 1. In addition, the GBP has fallen 1 point in strength while the NZD has gained 1 point.
When you guys are in a trade do you guys for the most part use hard stops or price action to get out of a trade?
If C does not reach 50% of AB, why is it that it has an 80% chance of reaching 127%?
It’s a harmonic rule…
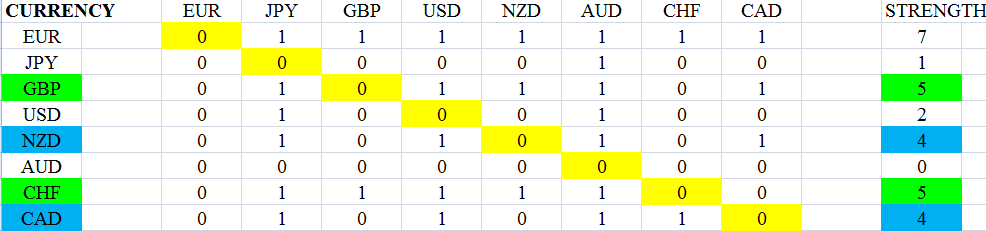
I’ve updated the strength table so that you can pinpoint which pair it has weakness/strength over. In addition, the currencies highlighted match the same strength and are excellent markets for swing trading. The yellow highlights indicates a currency matched with its self and is considered neutral on the chart.
Lost about $280 of real money in 2 days. This market is handing it to me…Gotta get better!
Tmoneybags can you start posting pics of the gartleys patterns your trading?
Know the feeling but I am starting to make back all the money I lost so now I truly know now what they mean when they say consistency is key so just keep working at it.

Thanks for the insight eddietheguy!
I am also relatively new to but you could have traded this pattern earlier if you used the top of the 8 sma with a different B and find resistance from the weekly pivot points with the 50% converging with the 161.8%

or you could have used the highest wick and also find the same resistant area and find convergence at 38.2% and 161.8%

thanks for the help Eddie
doesn’t B Need to be minimum of 38.2 percent of XA?
it is recommended but since a prominent C hasn’t formed yet you could have used the first or second swing as your B which already have a prominent C.