Might be a little too early to estimate where point B might be.
Bellow we have two patterns forming at the .382 of XA where I’m buying C to D towards the convergence zone. For the NZD/JPY 100% CD converges with the .382 of XA of the 20m-1h and on the AUD/JPY 127% CD converges with the .382 of XA; both these patterns are relatively at the same distance from each other and working its way up towards similar resistance besides the fib and D points. The AUD is currently moving 1.21 pips faster then the NZD and this has been put into consideration to calculate the entries and exits. Both shorts will be only for 30 pips, a break of the current sideways channel whether bull or bear will continue to push the market for an additional 40-70 pips.
thanks , much appreciated
why does it look like XA hasn’t not retraced 38.2%. Looks less from your charts?
Because I posted that 4 hours before your current post… lol
theirs something I am not seeing here. Your B does not look 38.2% of XA.
There is a gartley on the gbp/chf cross, im starring at it
I dont use that rule for my XA… never have… I’ve always made sure C is at least a .382 retracement of the AB measurement
what price would you hit short at AJ? .8165?

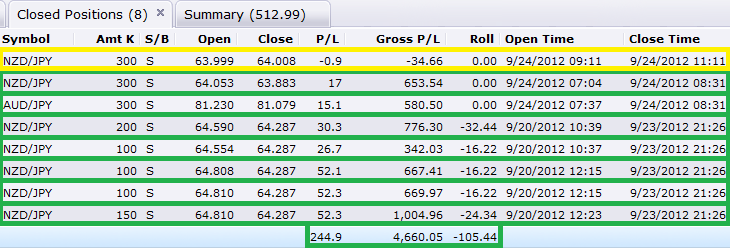
This is the profit of Thursday’s Hydra and a bit of scalping yesterday.
The charts bellow are that of the 1 hour, 4 hour, and 30 min chart (in this order) of the NZD/JPY. I understand that the chart will look cluttered, but each point that is drawn is a significant support/resistance zone and when combined with patterns coming from any given time frame… or swing traded alone… can lead to great amounts of profit. Do not worry I will explain each chart and you also have the option of zooming in, they’re big images.
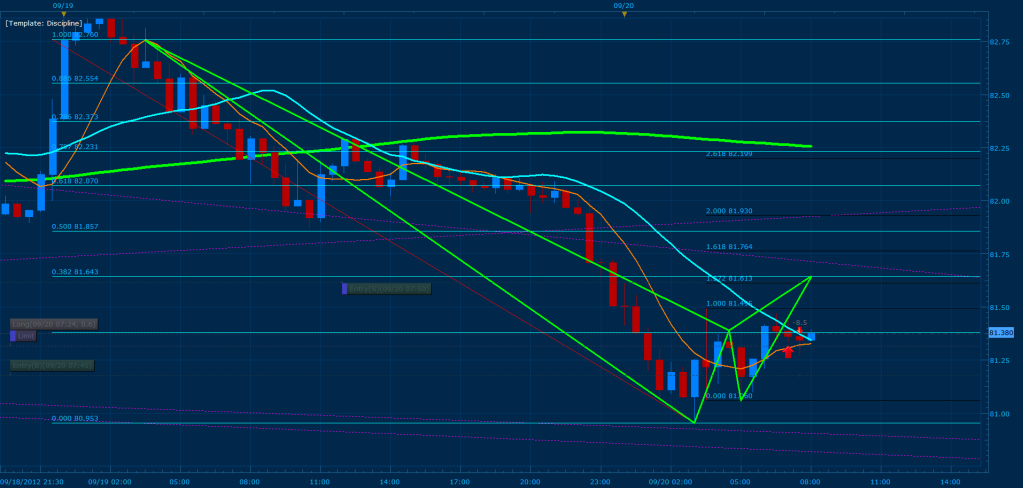
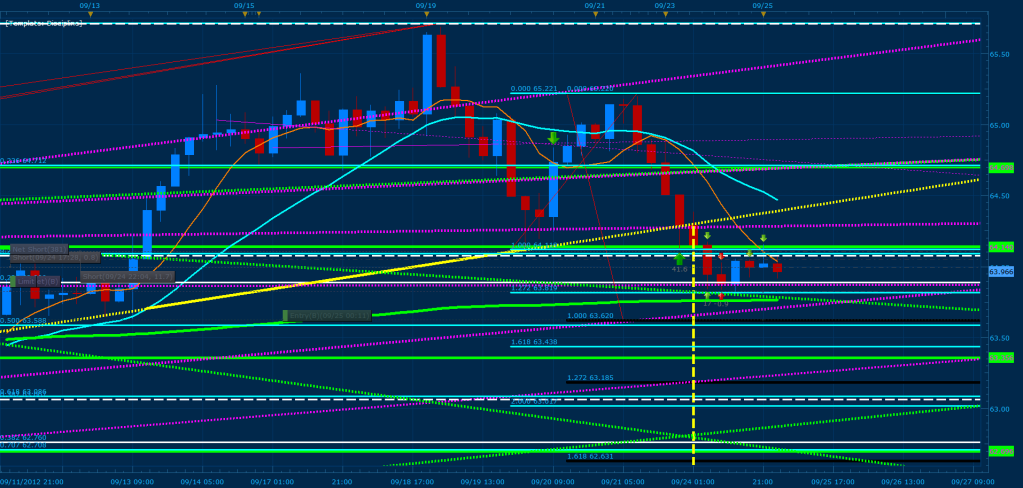
Here we have the NZD/JPY in the 1h time frame; the red rectangle represents the “sell” zone for the hydra, while the green rectangle is the convergence zone for 100% CD and the .500 of XA from the 4 hour. The vertical yellow line is part of an APEX measurement of a major bearish head and shoulders which was broken and confirmed on 09/24 and the violet lines are major support resistance zones I discovered where the market tends to swing trade from (you will see these violet/purple lines with all my new charts). In addition, the dashed fib point is the .236 measurement from the 4 hour mva curve, while the solid white fib is the .236 of the most extreme point on the 4 hour. Also, the green horizontal line is a major S/R zone (stronger then the violet lines) which converges with a 1.0, .382, and .236 fib point from the 4 hour time frame (hence the red boxed zone). As a result, a reversal and break of that convergence point is our exit and reversal on positions for a min of 30 pips (avg 60 pip move). Please note that I expect to do a quick scalp of the green box area and a failure of that point will push price a lot further as you will see in the following charts.
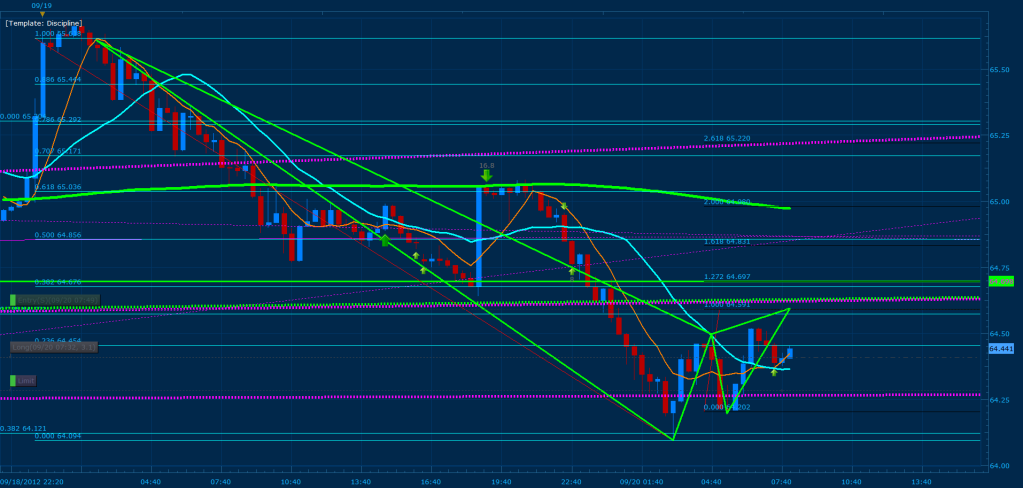
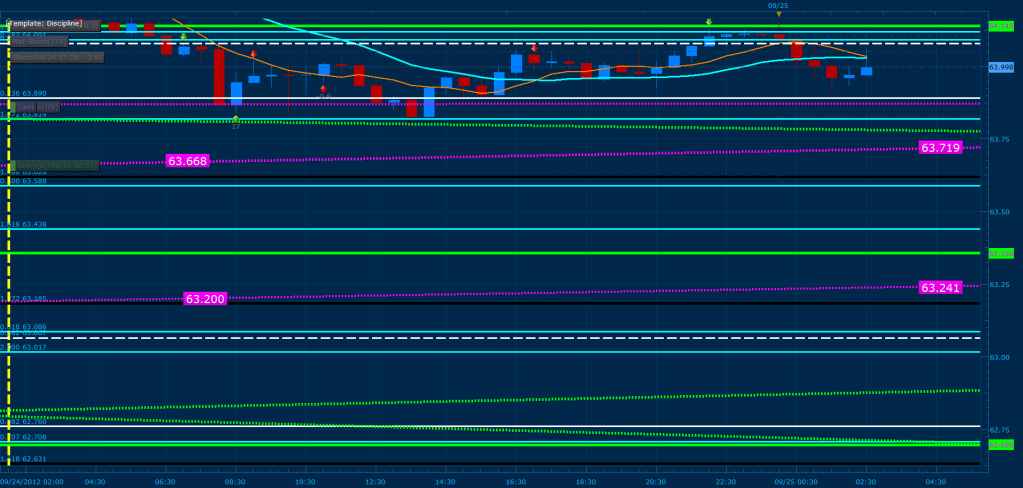
Take a good look at this chart… zoom in if its too cluttered for you to understand. The black fib points are D points that may develop for the on this 4 hour chart. The yellow sloped line is the neck of the head and shoulders which broke, while the vertical yellow line is its apex measurement. Please note that the apex lands exactly on the 161% CD where the .382 of the most extreme XA and the .707 of one of the recent extreme points converges within the same zone (bottom of the chart). This range of 62.760-62.631 is where I see price ultimately leading its self towards, which is why I stated previously that if the 100% CD breaks, we must continue the sell immediately. On the other hand, I know that their is a possibility that price will play around before reaching that target (which is why I have these zones drawn for the possible swing trades). The green trend lines are major high to high/low to low points, while the violet lines are the major support resistance zones I spoke about previously (through price history alone on this chart, you can note how powerful these points are, I consider them just as important as fib points).
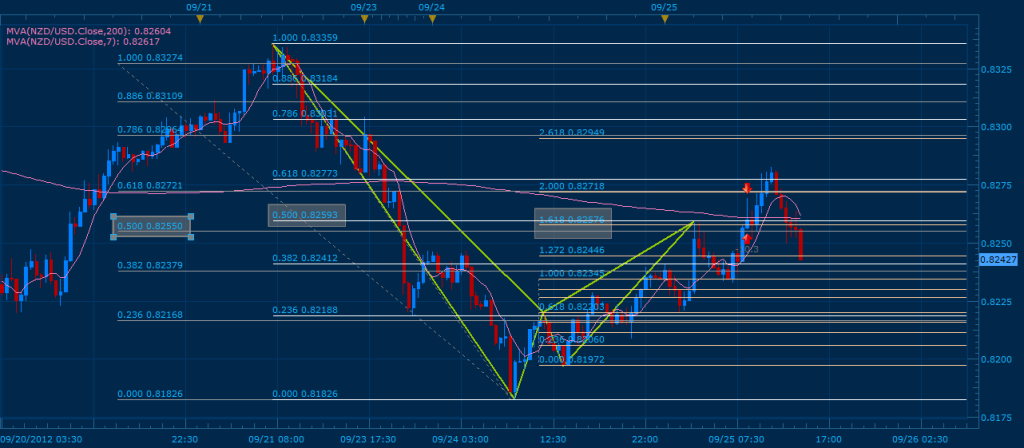
Above I zoomed into the 30 min chart with the same analysis and gave you the coordinates of the closest violet lines. Furthermore, the 3 green horizontal lines are MAJOR support resistance zones and should be placed on your charts (the price of its placement is to the right of the chart for each respective line).
Happy Trading!
Hey Tmoneybags,
When can you tell if the harmonic pattern consist of a 127 AB=CD or even 161.8 AB=CD pattern (Within the 5 point pattern)?
IT’S BEEN HARD FOR ME TO DETERMINE HOW FAR A CANDLESTICK WILL TRAVEL BEFORE IT RETRACE BACK. WELL IVE NOTICED THAT WHEN YOU DRAW YOUR XA FROM THE TOP OF THE MVA TO THE WICK IT MAKES SENSE. IT’S NOT A GUARANTEE THAT THIS CONCEPT WILL ALWAYS WORK THOUGH, BECAUSE I APPLIED IT TO MY NEXT TRADE(ONE I DIDNT POST) AND I LOST 12 PIPS. SO MY QUESTION IS HOW DO YOU DETERMINE A MORE ACCURATE SPOT TO PLACE YOUR ENTRY??? I HAVE THE FEELING THIS QUESTION DOESNT HAVE A ANSWER!
AUDUSD m30

NZDUSD m30
Tmoneybags, I am not understanding your trade. when u first posted that there was bearish gartleys appearing on N/Y and A/Y your entries were much lower then the ones u took. Could you please post a picture with the ABCD labelled if you have the time.

eddie,
I plotted that same chart wick to wick and X lined up perfectly with the 200 of CD at 1.2554. I’m going to try to post the pic from TorS in here but give me a minute, I’ve never done it before. lol
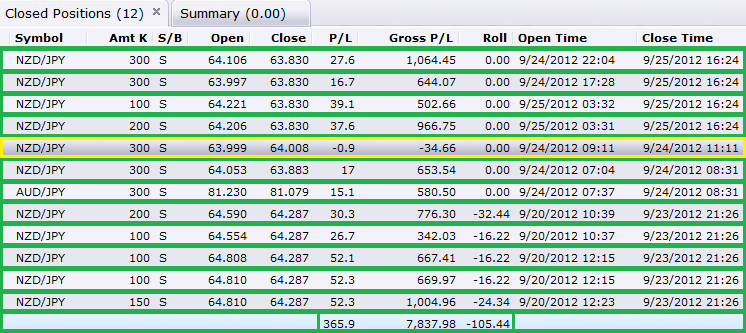
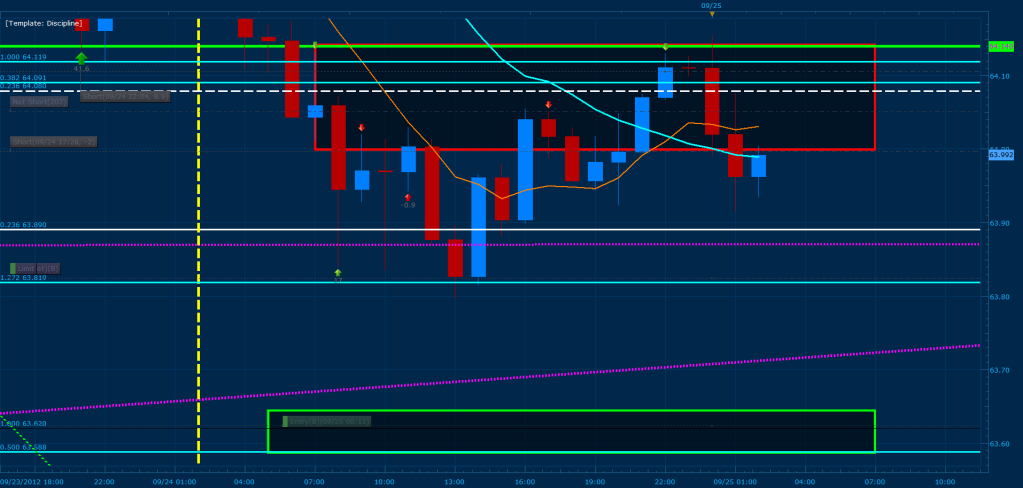
To give you a better outlook on my analysis yesterday I’ve attached the NZD/JPY analysis template. Simply replace the " .txt " extension of the file to '" .chs " and import the template to a NZD/JPY chart on market scope. Sorry for the hassle in converting the file, for some reason I can’t attach the file with its original extension on this post. As for my entries, I built my hydra incorrectly yesterday (went in equal amount of lots with each entry instead of progressively increasing the lots). On the other hand, we where still able to close the trades profitable.
damn, i use MT4 for charts. I downloaded a fxcm demo and tried to import, but when I try to load the template it file doesn’t show up. Although I did change the name to nzdjpy.chs. I even tried nzdjpy.cht, it gets recognized but nothing shows up
u need to import it as a snapshot =)
had 1 look at it and closed it soon after, looked to advanced for me probably make sense later on as i gain more knowledge.
Mister E for some reason, i cannot get it to work still. Can you post it here?
Tmoney,
What time zone are the trades on your account statement posted in? Are they EST or your local time?
Thanks.