Hi TMB, I my email is <[email protected]> , if you mind email me about the detail of your fund management.
thx
TMB, thank you. Followed you on your move from Friday and I did very well.  How far are you thinking on the short on the EJ?
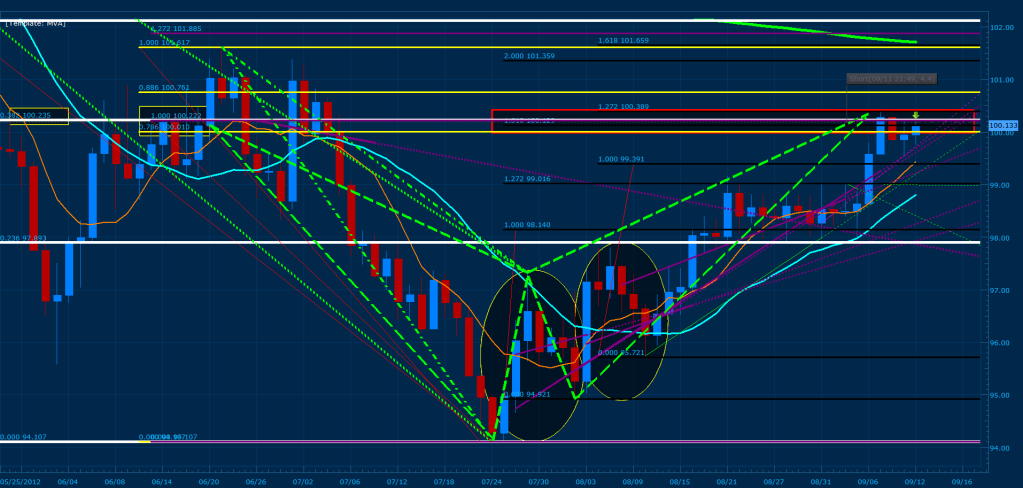
First of all, there are 6 major Gartley patterns with great convergence that have developed on the EUR/JPY Daily. Here are my X points using price: 110.150 (03/27-28/2012 using the top of the 8 MVA curve) {White Fib}, 101.617 (06/21/2012 using the most recent extreme point ) {Yellow Fib}, and 100.222 (06/22/2012 using the top of the most recent 8 mva curve) {Purple Fib}. The Yellow rectangles to the left of the chart show the fib that has been triggered for each X point (.382, .786, 1.0). The red rectangle on the top right portion of the chart indicates the convergence zone for the bearish gartleys. The yellow Ellipse highlight the first and second swing points used to determine D and the convergence. In effect when using the first swing, all three X points converge with the 161% of CD; when using the second swing, they all converge with 127% CD. As a result, giving us 6 D points converging at a very “tight” proximity for daily patterns when using both swings and all three X points.
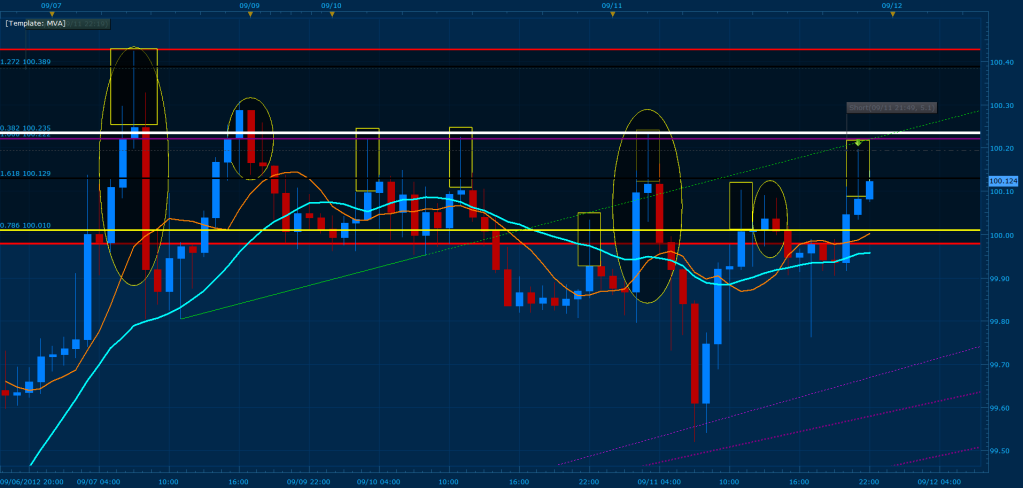
The following illustrates the convergence zone when one zooms into the chart (jumping from the daily to the hourly). The Ellipses represent major candle stick formations that have developed on the convergence zone (red rectangle), the horizontal lines are each fib point and D point respectively, and the rectangles represent the wicks that have formed from the major resistance zones within the convergence.
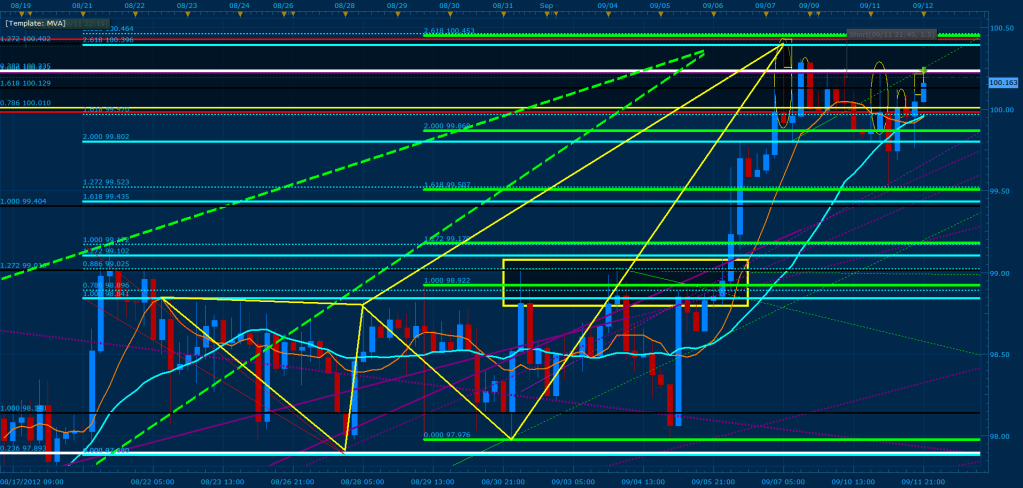
Above we have another pattern that has developed near the same converging point as the daily but coming from the 4 hour. Here we are using two X points represented by the Dotted and Solid teal/aqua fib lines. The dotted fibs are coming from the most recent extreme point and the solid lines start X at the curve of the MVA. We are using the first swing for our D point (Green Fibs); when using the most extreme point the 2.0 of XA converges with 261% CD and when we use the curve of the MVA as our X 2.618 of XA converges with 261% CD Giving us two extreme Butterflies that have triggered and began developing at the top of the Daily convergence zones (this is where price wicks from). Please note that the big yellow rectangle illustrates the strength of the previous D point when using the 4 hour swing where 100% CD converged with the .786 and the 1.0 of each respective X. In addition, the break of this previous zone is what technically caused price to range towards its current location. As a result, this extreme D point (261% CD) is major resistance.
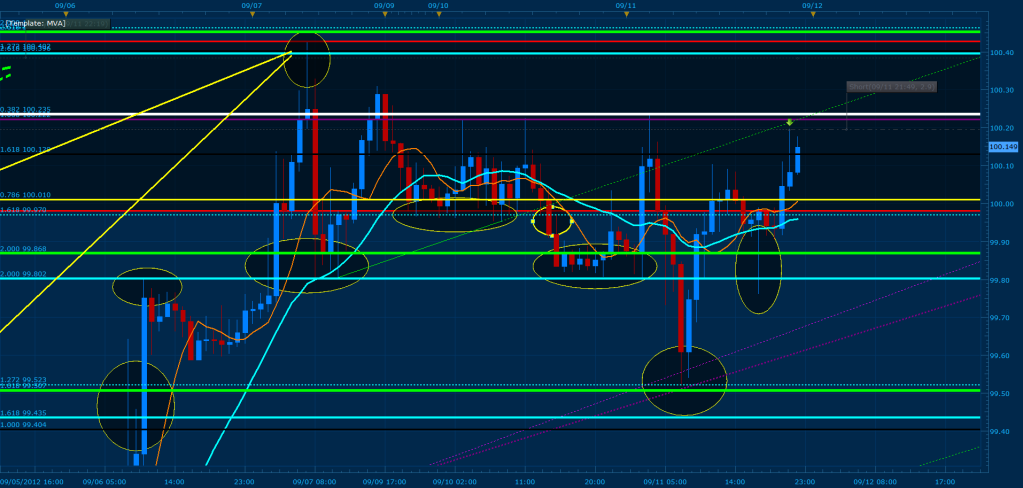
This ellipses illustrated above show the strength of the 4 hour fibs and D points previously analyzed.
All in all, target 1 for the daily patterns is the .236 of AD (98.956), target 2 is the .382 of AD (98.035). Currently the daily patterns have a 70% chance of reaching the .618 of AD (96.547). Please keep in mind that I am not placing a trade directly towards these targets, this analysis is meant to make us aware of the major support/resistance points within the EUR/JPY and the possible change in market direction. We expect price to flag within the current convergence zone as it has before continuing in either direction. As a result, take advantage of these points and swing trade the current zone until price breaks towards our targets or violates the patterns. Either scenario will push the markets a significant amount of pips (120-200 pips). In the mean time take advantage of the 1h, 30min, 15min, and 5min patterns developing within the convergence zone… their is absolutely no reason not to do so… I have and I’ve posted my results and will continue to do so.
Happy Trading!
Hey TMB…Question??
Using the highest curve of the MVA as a second “X” is just another confirmation tool towards finding convergence near the “D”? Is that your approach?
Things that mess with my psychology more than anything. Entering at a fib area and price dancing sideways all around my entry. I think it is because so many times before I have watched it dance around and then BOOOM it shoots away… but only it shoots in the wrong direction! It is extremely nerve wrecking to me. I left my order to sit over night and half of the day and I had to close it out +25 pips. I just couldn’t handle waiting on it anymore. I am too involved! Back to reading Trading in The Zone and working out these psychological kinks!
TMB - I am pretty sure you are probably active on EJ at the moment. How are you handling your stops so that you are comfortable riding out the sideways action? Thanks.
Hi Everyone,
It looks like CADJPY has a bullish gartley forming. According to my H4 and H1 charts, there seems to be a convergence point around 79.432-79.414 where 61.8% of the extreme XA, 70.7% of the smaller XA, and 127.2% of CD all converge in this area. What do you think?
PS: For my charting, I use Marketscope 2.0 from FXCM but it never looks exactly the same as TMB’s or other people’s charts. It also looks different from other broker’s charts on my same computer. Is this common? I’m wondering if this is something I need to worry about because different charts give me different fib points and they seem to differ by at least a few pips.
I can’t post an image because I don’t have enough posts in this forum. Sorry.
Yes! I entered a little bit at the 50% and have a limit set at the 61.8 which price is very close to. A little divergence on my Stoch gives me a little more confirmation. The extension of the last high to low also sits a 161 fib on top of the convergence area. Let’s hope it works out Looking for 38.2% of AD for tp1 and 61% for tp2. Good Luck

[B]Trade Results:[/B] At about NY open I noticed a slight divergence on my Stoc indicator on the 15M time frame right around the 23.6% retracement of AD. I exited price at 79.615 and it would peek at 79.673 before reversing. There was also a possible D point at 78.6% of XA and this would prove to be the real D point. I did make some profit on the trade but was asleep when the real D point was hit.
EJ is falling now…
I fell asleep yesterday and had taken my limit out… big mistake! instead of nailing 30 pips, I was stuck in the short until recently when I broke even on the pair and entered a pattern on the AJ. Looks like the GBP and the Ausi are making decent patterns; I will be waiting for the EJ to break out of the current sideways channel before entering the long or short. Think of the channel as a flag for a 100+ pip move that can give 30-60 pips easily once the break is confirmed.
-Edit-
PS. 100.627 is a .236 from the weekly and 100.263 a daily .382 fib, price is currently bouncing in between this zone, and a candle stick pattern breaking either or is what I am waiting for. In addition, patterns that develop for the buy or the sell in each respective top/bottom can be scalped for 15 pips.
It’s the same as measuring base price to wick, a technique I’ve explained thoroughly throughout the beginning of the thread.
TMB if you do not mind me asking when you build a hydra to the convergence zone or buy/sell zone what exactly do you look for when you initiate it.
Understood
The above quote was taken from Sweet Pips thread Strong vs Weak and can be accessed by clicking on the blue arrow within the quote.
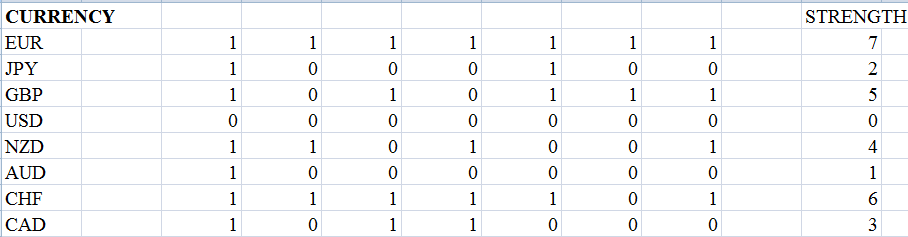
After seeing this post a few months ago, I began to do some further analysis and decided to see if this technique can be implemented into harmonic trading. We found that when you take two strong or two weak currencies and traded the pairs, they where ideal for finding patterns on both ends of the spectrum (bull/bear) because the pairs are basically in a tug of war with each other for the most part. During the time the post was released, the weakest pairs where the GBP and CAD and when we traded the GBP/CAD the majority of the time patterns would develop every single day at the bottom or the top of the channels until one of the two gave way in strength and then ranged for a few days to develop the same “flow”. As a result, you are now “expanding” the trading edge and not simply limiting it to choosing the strongest pair for a secure market direction. Bellow are today’s currencies and their strength values, 7 being the highest and 0 the lowest:
How can I apply this to my trading style?
We suggest you pair up currencies with an equal or within 2 ranges of strength when looking for both bullish and bearish patterns. Keeping in mind that when ever the strength of the pair is 3-7 times stronger than another pair, you will want to look for major support breaks or patterns that develop in favor of the stronger pair. I suggest that you read up on the technique on sweet pips thread and the website she had found it on. In addition, try to see if you can add towards the discoveries I have made here. Note that I will be posting the currency strength chart every London session before NY open for our benefit, although this will save you the time of searching through 25+ pairs… doing it yourself is not as time consuming and would help with discipline.
Happy Trading!
Think outside the box 
Another tool in the toolbox… Thanks Sweet Pips & TMB!
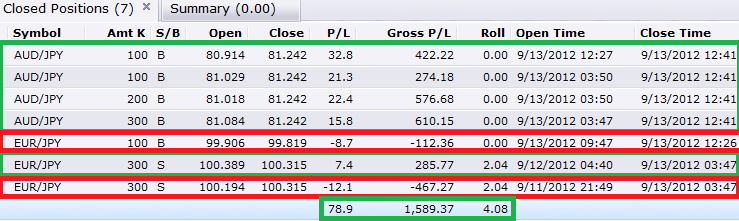
Today was a bumpy road for me… a bit of a let down seeing price reach my targets for the EJ after letting the hydra go for an early buy on the AJ. In addition, we had removed the buy targets set for the EJ and missed an easy buy with the spike because of it. On the other hand, the Hydra buy for the AJ payed off (even though I closed it manually and didn’t let it reach its target lol…). Bellow are the results:
Major support/resistance converging in a 20-50 pip range with multiple patterns converging within the zone. In simple terms its a way of entering a trade in an “iffy” area but with defined support/resistance without going into the trade fully but “progressively”. For example, if with in a range I have 3 multiple convergence and my max lot size is 500 I will split the lots by 100/150/250 that way each time a higher entry triggers, the net long/short is closer to your exit. In effect making it easier to recover a possible failing trade if reversal signals develop within your converging zone that do not favor your trade and or making w/e loss at the break of your highest position less significant then if you where to place everything within the first convergence zone. If price hits your first entry and continues towards your target without triggering the other “heads” of the hydra, take the money and wait for a pull back and/or have another pair analyzed with a confirmation in direction where you can place those additional lots.
So, I see a good bearish pattern on the daily EUR\USD chart, which shows some convergence between 1.3020 and 1.3047…0.782 And 200.00 Fibs
I don’t know if this is it, but fundementally speaking, the FED has just announced QE with no end in sight, and the EU has made all the promises they can make, so I see the EURO taking a serious plunge if not now, inevitably, probably coinciding with the stock market crashing again, probably worse than end of 2008…there is just too much artificial bubble…again.
If that’s the case, let the big boys confirm the reversal for us and we’ll jump in along once it’s secured ;). In the mean time, scalp those major resistance zones and the flags, don’t let them chew you up by holding on until things are ready for continuations…
How exactly are you hedging? (in other words, buying and selling the same currency? I have been with atleast 2 or 3 platforms and they never allow this?)
Elephant,
Look at the open and close time of the positions. For the first example you gave, the AUD/JPY in the red box if you look at the close date and time (9/4/12 21:07). Then he opens another position on the AUD/JPY about 30 min later. Tell me if explained correctly or not.