This is not a valid pattern. The C point must be the lowest point between B and D( In your example it is not), and shouldn’t be lower than A.
My apologies if the objective of the pick was to show an incorrect pattern, its late in the night and im a bit asleep.:24:
Just got home and saw that I made this setup, but didn’t place a sell limit :(. that was a hundred pip move though.
Ah yeah, price cannot go below A for a valid pattern. However, I am looking at Trade What You See now and I am not seeing a hard invalidate rule regarding C being the lowest point between B and D. As long as no point goes below A, it is technically valid. I say technically, because you can certainly have cases like paw3000’s where an “invalid pattern” still completes.


Thanks Merper, I’m getting there I spent the night last night writing all the rules out and practicing drawing the legs so hopefully will find some setups to demo trade over the next week next :).
Cheers,
Tave
Haha, nicely done. Congrats! 
Good morning, Everyone!
I have a 4 Hours AUD/CAD pattern and is hitting The D point right now.

I hope I did it right. I am a bit worried about The C point, because we have 2 C opportunities there.
Good morning Cosminc! Unfortunately, i don’t think you have a valid pattern there. You should have used the first swing after B as your C point.
Found a good bearish butterfly on the EURJPY yesterday and put a limit order in place. Really frustrating to miss the entry point by 0.9 pip. :34:
Well well, better luck next time i guess. 

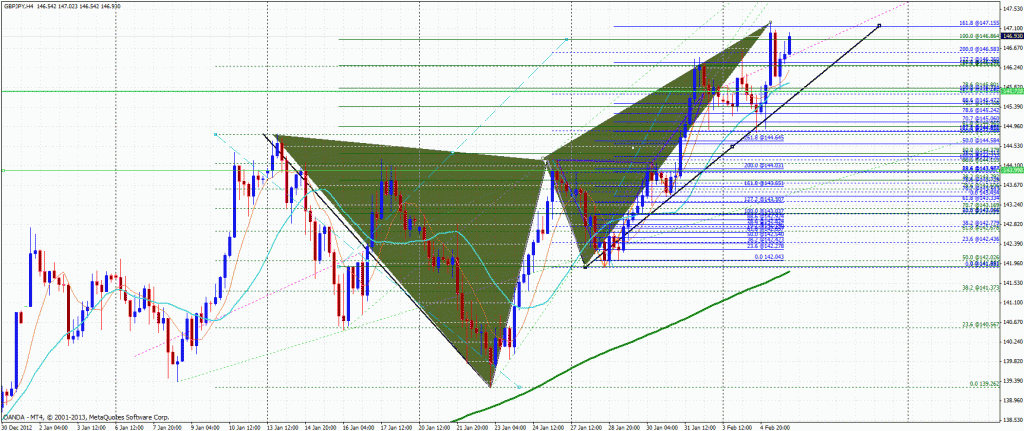
Then only trades i’m watching right now due to lack of time is the GBPJPY Daily, bearish butterfly…

…and the EURUSD, 30 min, bearish gartley.

Have a nice day everyone! Happy trading and good luck!
Sorry guys I have been very busy and tired this week, but now that I am back on track… I will post today around market closing hours.
Glad to hear you are ok TMB!
I’ve got the same patterns as you Diablo, along with this one on the GBPUSD 1H.
I’m not 100% sure its valid though, but can’t figure out why.
What do you guys think?

Edit: noticed it was hard to see on the picture, its a perfect convergence with CD 1.00 and XA 1.272.
I like it. GU is currently the pair I have my eye on, it’s given some good gains. Around 300 pips over the last few days if trading just simple range breakouts.
I have been following this thread for a while now and just got my first few pips with this trading method
+15 EURUSD and +17 EURJPY both long
Tnx alot TMB for all your posts!

Hey, welcome back TMB, we kept the thread nice and warm for ya ;). When you feel up to it, would you be able to settle this theory debate a few of us have been having over whether C should be the lowest point between A and D?
between B and D* 
bearish example*
I think when there is a pin bar we can consider C as a different point than the swing low, but not when the price continue moving down for some bars, and moreover when it moves lower than the A point.
Swing low definition:
A term used in technical analysis that refers to the troughs reached by an indicator or an asset’s price. A swing low is created when a low is lower than any other point over a given time period.
C is the swing low from B to D.
“In trade what you see” it is a bit explained between pages 21 and 35 . Just look at the picks from the whole book and tell me how many patterns dont accomplish this rule, without counting the setups where the highest or lowest point is a large pinbar or engulfing bar.
What im trying to say is that vectors should be plotted from the lowest low to the highest hight or from the highest high to the lowest low.
In this example they are not, so this can work? yes, but this is not a gartley pattern, so we have no evidences about if this would provide a positive edge on the market.
the way i would draw the pattern:

Hope this helps to understand the idea im trying to explain.
PS: interesting patterns on gbpusd and gbpjpy 4h!
Yeah i see what you mean Paw3000.
Now we have another swing that is lower than the C in your pattern. Does that invalidate the pattern again?


Yeah on the GBPJPY i can se this bearish butterfly on the 4h. But the GBPUSD just seems to make a lower low at this time. What do you see? Was it a bearish gartley before price went under the A point? I saw one with good convergence at 1.272 and 0.382?
GBPJPY:

:22: Aduhhh. Yes B and D. I can’t seem to get those straight.
[SUP][/SUP]
exactly! so now we have this new one :

however i can’t find any good convergence lvls with this :(.
yes on the gbpjpy im looking at the same level, the 161.8 convergence with 127.2 of AB=CD and 261.8 of BC
On the gbpusd I just discovered the pattern differ for 12 pips depend of the broker i use. On Pepperstone the B point is at 1.5792 and on Hotforex at 1.5804…
Using Pepperstone the 127.2 from the AB=CD convergences with the 161.8 from XA and 224 from BC forming this deep crab pattern.

Hey there, fellow Pepperstone user! That convergence also lands smack bang on the trend line for that pair.