Are you using MT4? How do you make your chart to have top and bottom space? like in the above image? are you using scare fix for that?
So yeah… I’m a 'tad late for the triple analysis I promised to release this week, but here goes 1 of 3 pairs.
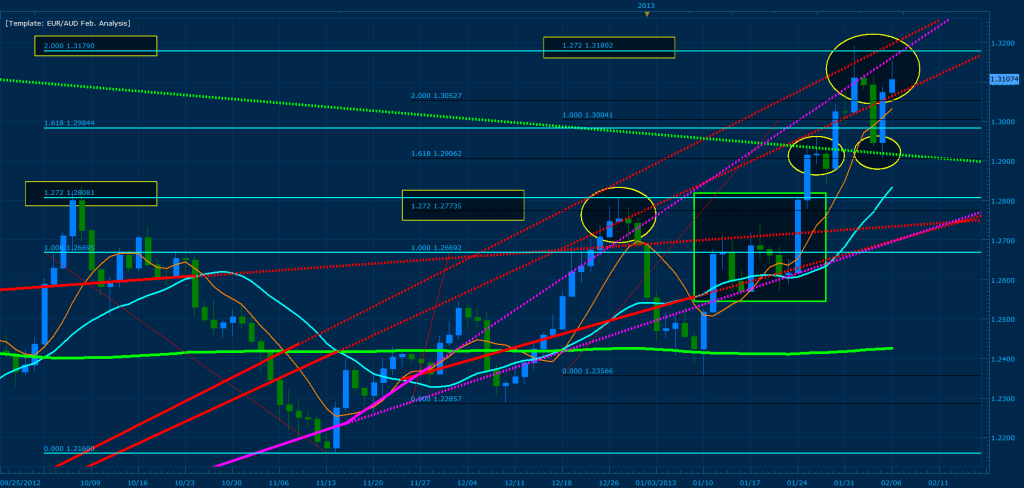
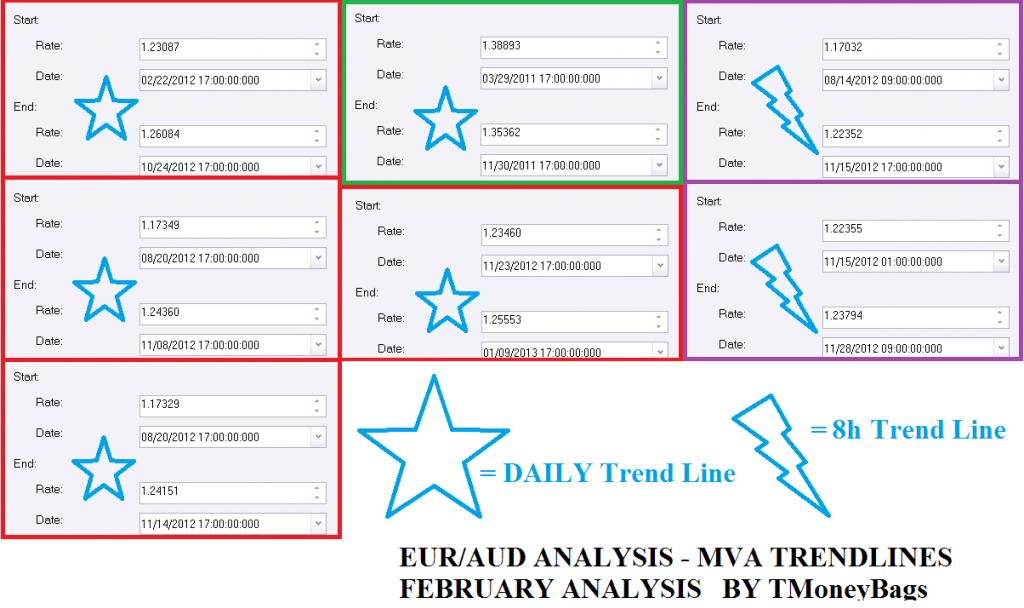
Well, lets start by taking a close look at the support and resistance lines drawn on my chart for the EUR/AUD (Daily Chart). The green and red lines are major daily trend lines, while the purple/pink lines are coming from the 8 hour chart.The yellow ellipses and green box show how price has previously respected these zones on the daily. I want you to see how powerful these trend lines are and learn how to properly apply them towards your trading. To clarify, take a close look at the ellipse towards the left of the green box. Here at the wick price hits the 1.272 of XA converging with 127% CD and as it bounces off the convergence zone it respects two of the major support resistance lines before confirming the short of the pattern. Notice that the use of the butterfly pattern and the crossing of these trend lines was able to predict the reversal of a major up trend. This in effect tells us that we should look towards similar areas before shorting the pair in the future. In fact, we have recently reached one of those areas and began to flag within the convergence. Please note that these major support/resistance zones are coming from selective measurements I have made of the mva crosses and this technique I’ve developed will be used throughout all my analysis; hence forward throughout the thread I will refer to these points simply as major/support resistance trend lines AKA MSRT.
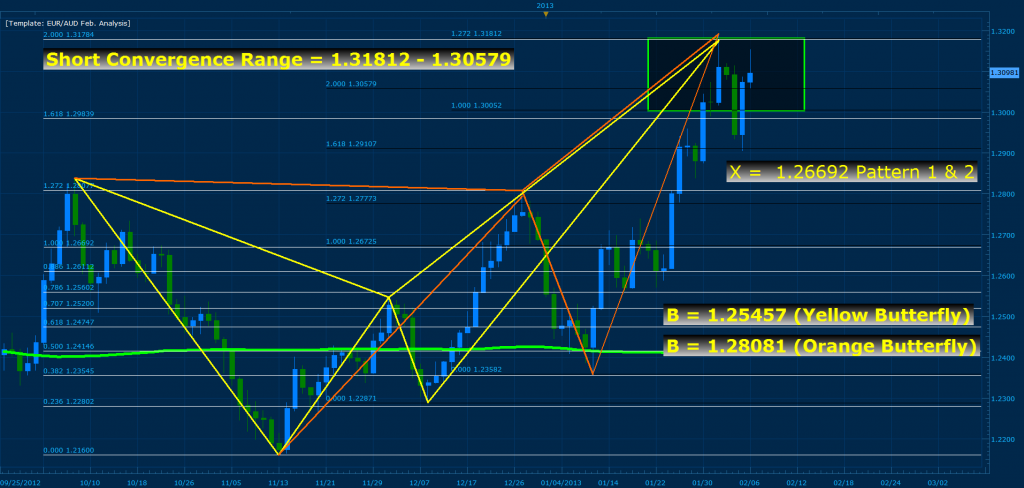
Bellow I have cleared out the chart of all the MSRT points so you can see the convergence zones and the developing patterns with ease. The first pattern is a butterfly (yellow) where the 2.0 of XA converges with 200% CD. I am aware that the convergence within this zone looks ugly at first sight, but we must be mindful that the cd of this pattern was previously respected at 100% CD. In addition, we have a second butterfly (orange) that has developed exactly at the 2.0 of XA where 127% CD converges perfectly with it. As a result, I have illustrated the convergence zone with a green rectangle and we should be looking for shorts on the pair unless the top of the convergence zone is broken by a daily close; if the zone is broken expect price to reach 2.618 of XA, pushing price towards 1.35. Currently price closed bellow the .236 of AD and pushed back towards the convergence to retest the short. The result has been a respect of top of the convergence zone by creating an inverted hammer and and closing bellow previous base price. In effect, I have opened a short and will take it towards the first target at 1.29705. If price manages break the .236 of AD, I will short towards the .382 and exit at 1.28336. A full respect of the patterns will push price towards 1.25 (70% chance).
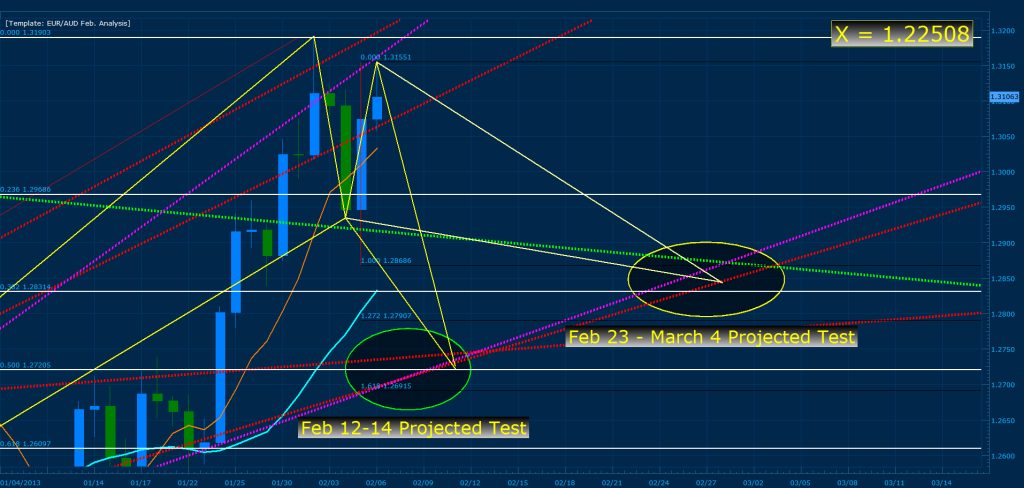
It’s a bit early for the following projection because price has not reached and broken Byet. But because of our current analysis I expect price to develop the following patterns on its way down. Please note that this projection is true as long as C is not violated. The green ellipse represents the first possible gartley to form if price takes a sharp dive where 161% of CD converges with the .500 of XA. If price flags and consolidates for the next few days within the current convergence zone, I will expect it to reach the yellow ellipse; where 100% CD converges with the .382 of XA.
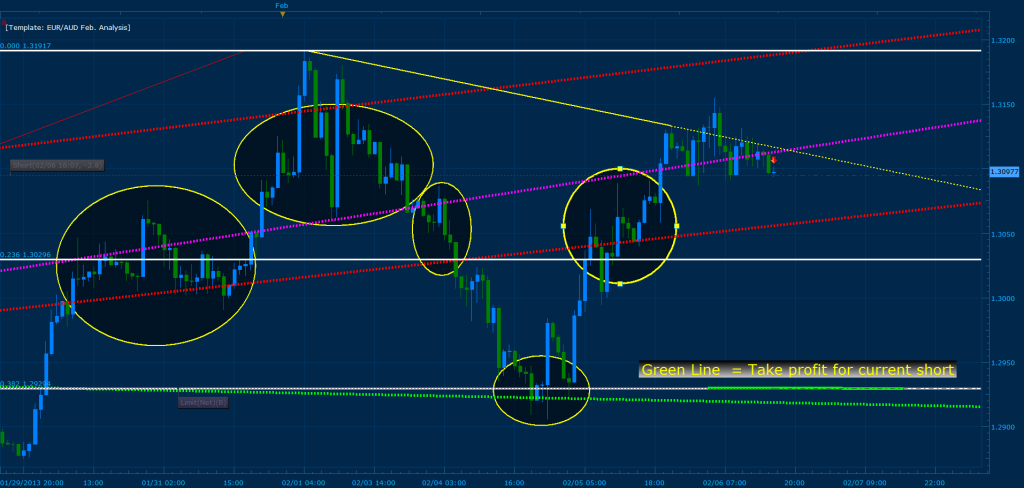
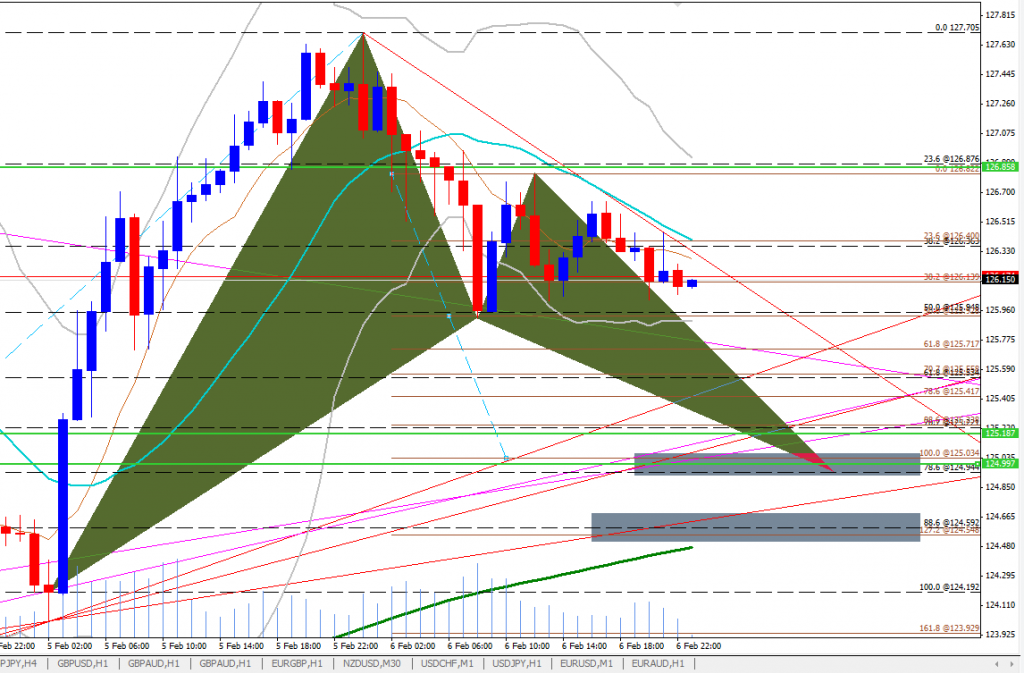
Bellow I have switched from the daily chart and zoomed into the 1hr chart so you can take a closer look at how price respects the MSRT on the lower time frames.
ENJOY!!!
My next post will display the coordinates of the MSRT zones.
I will post the analysis of the second pair tomorrow!
Bellow are the coordinates for the MSRT Zones. Simply draw a trend line anywhere on your chart and input the following coordinates by editing it:
your analysis are always amazing! thx once again for taking the time to share this with us!
I got addicted to the “one click trading ea” Pepperstone mt4 has for default since the 1st day 
yes, right click on the chart->properties->common ->Scale fix. and then change the fixed maximum and the fixed minimum.
Looking forward to the second pair analysis!
paw3000 - I got addicted to the tiny spreads!
TMB - Is there an explanation here of how you calculate mva trendlines or is that quite an advanced technique that only you do?
Edit: Page 709 I do believe. Interesting concept.
Thank you. For the first time. I made my analysis before you did, and I have come close to your analysis. Fully understand your analysis this time.
Below is what I have couple day ago. and even though, my first butterfly is different from yours. But I have the same D as yours. I’m not sure if I use MVA for the X like yours. But I came close
TMoneyBags,
Beside using the MVA line for trendline and X, do you use it for other purpose?
TMB, can you explain the theory behind your 8 MVA. I have had success with these patterns, always basing price action based of respect of XA fib level, using the wick as my X. I do realize that it can be advised to use the base of candle when price is trending and the wick when price is ranging.
However, I thought this worked because these convergence zones were where other traders are entering and exiting there positions. Doesnt using the 8 MVA curve peak as X violate that because very few traders probably use the fibs in that manner?
He explained this a couple days ago.
found a pretty good one on EJ 1H chart
there is 2 convergence, possible the first one will be the right one. the green line at the convergence is where i enter into the trade.
TMB, earlier you explained that you go these trend lines by drawing lines from cross of the 8 MVA and the …20? MVA on various time frames. What do you mean by selective measurements and how did you pick which two crosses to connect to form a trendline? I guess that’s the selective part?
It looks like a very sophisticated technique, but I’m sure I’d fall flat on my face trying it now.
OK, need some direction on TMB’s analysis w/the Fibs. on the EUR/AUD I’m using ThinkorSwim charts and cannot get the convergences @ all. For the X I’m using the 8 MVA, so the XA fib @200% is 1.3166, after that I am unable to find the convergences drawing the B to C to find the D convergence w/XA fib. Thanks for any suggestions!
Good morning!
Your gartley looked really good shonick, until price broke your C point. 
Now i drew up this bearish counter trend pattern instead. Let’s see if the CD develops from now on or if it brakes C again.
Good luck trading today everyone!

When you draw a trendline, you want to make sure that previous history reflects some type of major support/resistance from that point. In other words, it really doesn’t matter if I draw from cross to cross, low to low, high to high or anywhere on the chart as long as previous price history shows that its respected the line. To clarify when choosing the MSRT Zones bellow I made sure of this and circled some of the key confirming S/R confirming this throughout the analysis. If the point where you are drawing your trendline has no confirming information towards the right side (forward) of it, then extend the left side of the trendline and make sure that point shows significant value.
As I have stated a few days ago, the measurement of X is simply a “bonus” towards the standard ABCD pattern (converting it into a butterfly or gartley while increasing the win %) and as long as X is above B it is never violated. In addition, what you are measuring is not where people are drawing their convergence zones through the same fib techniques that I or any other harmonic trader uses. To clarify, gartley and butterfly patterns are measurements of the emotions in the market and with each leg you draw a fib on is a wave of emotion that you are measuring. Furthermore you have to think outside of the box and understand that there are various bots out there with significant accounts moving the market and generating volume. When I draw the [B]MSRT[/B]'s and x from the top or bottom of the curve I take this into consideration. I’ve asked my self plenty of times: Where would a bot calculate future movement from? What would it measure? How would it do it? What formulas would it use? What algorithms would the coder use? In fact, the reason I have come up with these techniques is because I spent two years asking my self these questions and trying out different strategies. Take this for example, using the EUR/USD 1 hr measure the pip value of AB then measure the pip value of BC (using the first swing B lands at 1.36339) and input the following formulas: {Formula 1} [B]AB-BC+AB[/B] = AD {Formula 2} [B]2(AB-BC+AB)[/B] = AD. In other words, 77-27+77 = 127 pips || 2(77-27+77) = 254 pips; the results would be a D point around 1.35844 (Formula 1) and 1.34572 (Formula 2) If you draw a horizontal line at these points for the EUR/USD you will notice that they both worked as major support/resistance zones… You will also note that formula 2 was able to predict the bounce of the euro after the sharp fall only missing the wick by 0.8 pip! THINK OUTSIDE THE BOX

bat with perfect convergence from 88.6 of XA, 200 of BC and the 127.2 of AB=CD, on eurgbp min 30
it failed, the bearish movement was too strong…
This sucks to be honest. :34:
GBPJPY, limit order missed entry by 5 pips…

EURJPY, limit order missed entry by 1 pip…

I want to be able to sit in front of my computer! My account really needed those pips. 
the same happened to me
Yeah, what a bust. Had a crap day for trading as well. I need this weekend, just to refocus. Man, days like this is such a set-back! Need to build something into my trading plan to protect against this ASAP.
Take it easy guys, no need to be too hard on ourselves. Fact of the matter is, we actually spotted great setups and had 90% going for us. This will get better with time. Every time.
Cheers
Spotted a nice pattern on the EURUSD 4 hour chart convergence of the 0.500 and 1.000 fibs

Yeah. To be honest i am just glad i spotted patterns that worked out great which means that i’m doing the right thing. With the right adjustments this will lead to good profits in the future. but of course, those +100 pips would not have hurt my account. 
Have spotted a good bullish gartley on the EURAUD 4 hour with good convergence at XA-CD fibs. As confirmation even good convergence with BC fib level and the convergence is at a level that has provided good resistance a few days ago which now should act as good support. See if you can find it. Can’t post a pic atm since i am on my iphone.