When I make a line at the crosses of SMA8 and SMA20 I don’t get the same result at TMB. I must be wrong about 8 & 20?

I believe to have found a really interesting trade forming.
Take a look at the GBPUSD daily chart. I’ve posted a screenshot below of a bullish gartley and price is really getting close to the D point.
This pair has been respecting the fib levels very well on the daily chart for a long time.
In addition to the convergence at 0.886 of the XA leg and 2.000 of the CD leg we have a big RSI divergence and earlier support shown in the structure of price to the left.
I even found a MSRT line drawn from the cross of all three MA’s (8, 20, 200) on the 21st of march 2012 to the crossing of MA’s (8,20) on the 10th of august 2012. That’s not included in the screenshot though.
The convergence also have to happen to be at an institutional level 1.54000 which also can be interpreted as a sign of confirmation.
For all of you who are new to this i’ve written out the XABCD points as well. 
TMB, could i please get your opinion on this one. This looks to me as a high probability trade and definitely a trade i will take if price hits the convergence within the next days. What do you think?
Of course everyone else’s opinion is more then welcome too.

I also want to add some motivational words for you all.
Remember, in order to get from a basic student to a master regardless of what you do you have to do one thing.
Practice, practice, practice and one more thing, practice! Do not give up and you will reach excellence in what you do.
There is no quick fix, no shortcut. You have to stand in line and wait in order to get to the register.
One of my favorite quotes which i also have printed out and put on the wall above my desk is:
“You can’t get a baby in a month by making 9 women pregnant!”
And that is a fact. So whatever you do, just keep going even if it’s tough at times and you will reach your goal.
With that said, i wish you all a good night of sleep (even if it’s daytime where you are at the moment)!

ok can someone correct me if im wrong. with the 2nd set of fibs, do i draw them from points B to A, and then i raise the fibs and place the 0 of the fibs on point c and see where it converges with the initial fibs to find point D. sorry i know it sounds newbie but just wanted confirmation.
Diablo, I think your A point is incorrect. I think it should be that first peak to the left of your current A point.
saeed, that’s how I do it, but you’ll probably want someone with more experience to confirm for sure.
Diablo, I have a simple S+R analysis of that pair and I have a major support line at that level: 1.53937
There are some dips below that on the order of 60 pips or so, but not recently.
It’s not the measurement of mva crosses that allows one to predict price when drawing these trendlines… it is the cross of the MSRT or any other major support resistance level with a harmonic convergence (when the trendline runs across the fib point and/or CD %). Notice how price forms railroad tracks off the cross that happens with the .382 and 100% CD convergence… then notice how price creates another railroad track off the yellow line I have drawn crossing with the top curve of the MVA ;). The first thing I learned from my mentor when drawing fibs was to always be on the look out of trendlines crossing with the fib points because their is always a volatile reaction when it hits… and from the years of trading with this knowledge… its proven itself true 100% of the time on the respect or the break… the move is always volatile as illustrated on that aud/usd 30 min chart.
As towards my theory on the reason why MSRT’s work when price hits them? Well… does it really matter why it works??? Maybe its simply a “structured way” to draw trend lines… Maybe millions of bots out there use the MVA crosses to figure out future price swings… Why does drawing a trendline from low to low or high to high help predict a channel??? The only answer I can give you is that human emotion is predictable and human emotion is what drives the markets. Don’t give your self a headache in figuring out why a technique works; if it works, use it and exploit it the best you can until your forced to move on to a new technique or improve it (trading is an evolving practice, hence why the system im using today differs much from what I have originally taught… I have grown alongside it…). By the way, theirs an astronomical side to Gartley and Butterfly patterns working… its not solely based on the “Agreement” that the majority of technical traders use fibs ;).
Diablo.
When I change the A point and redraw I see the first major convergence at 1.5914. There was resistance there and the MVA lines in my chart cross at 1.5757 which had a lot of congestion, then the price broke structure and plummeted below support. I see it retesting the June lows of 1.5352 which is close to the 2nd convergence in the pattern at 88.6 of the XA line (1.5389). I guess if it respected that structure it could bounce back up to 1.5739 as the 1st target and 1.5957 as a 2nd target.
TMB, I’m curious of your thoughts to see how close I may get.
hi there, i have just read your analysis.
I think perhaps your B should be a few more candels to the right because the price does infact go a bit lower than that before your C.
but tell me, how did you work out your D?
because when i went to the same chart and plotted A,B, and C as you did. I came out with D at around 1.57796,
I worked out D by taking away the high of A from the low of B. so that’s A-B, and then taking away that number from the high of C,
i am left with a figure of around 1.57796, which falls between the 50.0 and 61.8 fib. but it does not fall very snugly in that area so personally i would have not have traded it if i had spotted it in time. you can see on the chart that the price does bounce slightly on the 61.8 fib …which makes me think perhaps i am right.
also my AB is pretty much equal to CD if D is at around 1.57796.
can anyone else with more experience please confirm where D actually is? and if I am wrong, why am I wrong?
I am pretty new to forex, and also pretty new to gartley patterns (about 4 days in). So I might be wrong on this.
cheers.
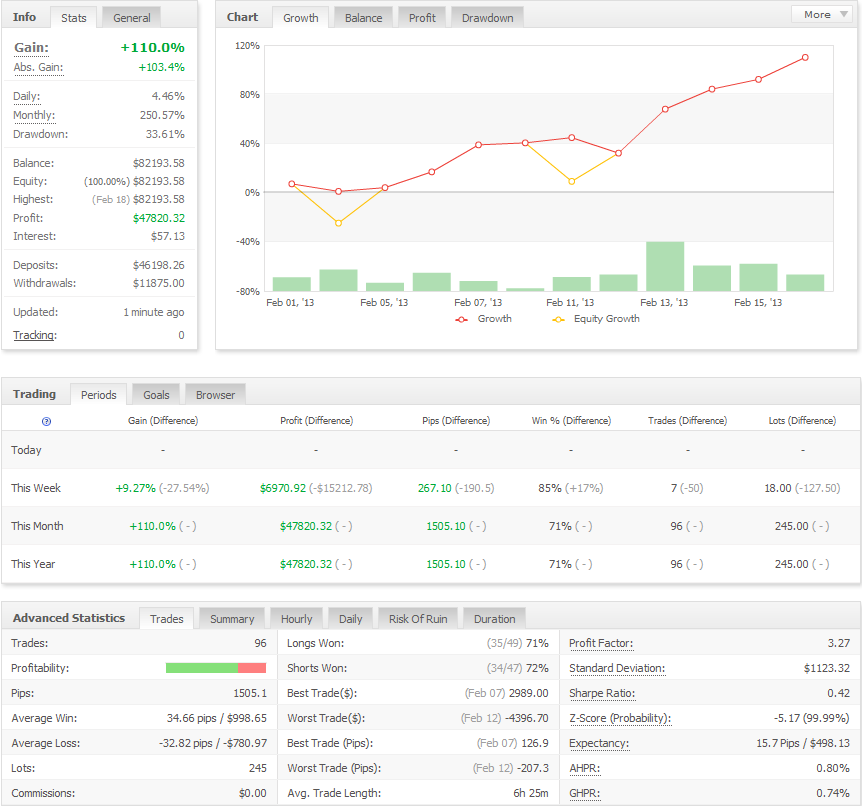
With bonus pips on Friday and today’s close, I’ve surpassed my monthly goal of 100% RoI:
Going to take it easy the next few days… See you all for London session.
Interesting. I am still trying to develop some MSRT lines of my own, but I am slowly coming around to seeing how they are implemented. Am testing a USD/JPY line now, and will post it if my analysis proves to hold weight. Thanks for the insight.
Oh, and congrats on the wins, as usual. 
For those interested in this pattern that Diablo1505 draw, and want to confirm. Here is what I have. The green line is where I would make the buy entry. But I think I will skip this one though.
Building a Bullish hydra on the EJ trading C to D Entered positions at 125.160, additional buys towards most recent lowest/low (break constitutes a reversal). Will be posting upcoming D point shortly…
Here’s a tip, when drawing any trendline (including MSRT’s) make sure that 2-3 candles consecutively respect the line in the past (whether from the start or end of the line) or a significant reversal/break occurs from it. It took me a while (few months) to get used to the fact that these points work… lol… hope my recent posts and continued analysis of the markets help speed you up through the process.
[I][B]*Note.: Past behavior from a MSRT even if its a disrespect followed by a retest and respect of the zone tends to repeat itself in pip value.[/B][/I]
Hi pdxkurt!
What makes you think that?
Nice merper, good to know! 
We will see if price reaches down to that convergence and how it will react. What speaks against this trade is the rapid downward movement of the CD leg which is a warning sign.
At the moment i do not have time to watch any lower time frame trades so i’ll stick with the daily and 4 hour charts this week i guess.
Entered Final positions at convergence…
We have a bullish gartley that has triggered on the EUR/JPY where the .500 of XA (when using the bottom curve of the hourly MVA at 123.48) converges with 100 and 127% CD. In addition if you use the most extreme point of price at 122.889, the .382 of XA converges with these points. Previously a sharp BC was formed at 124.612 of price; place a horizontal line at this price level, if we close bellow it, expect a D point to develop at the 124 level and a sell towards it would be considered.
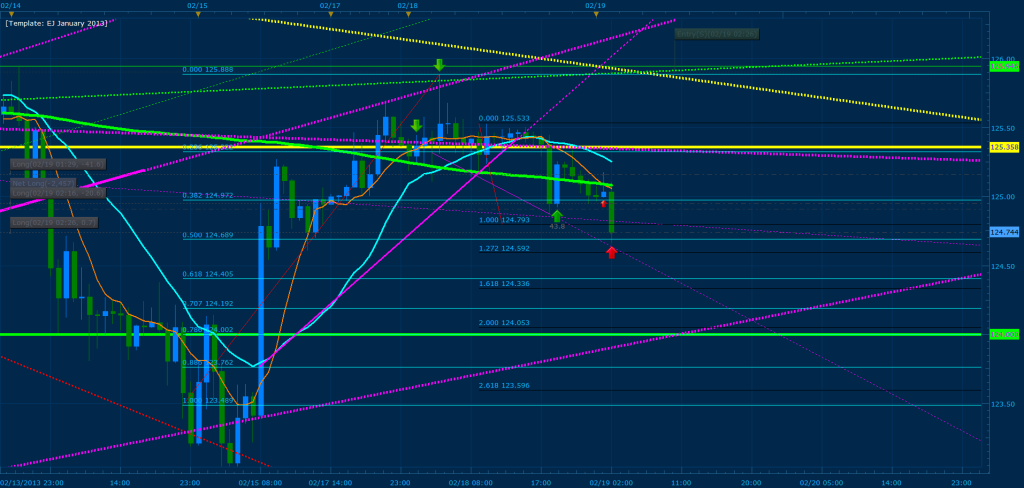
Notice that I have a sell order already in place waiting bellow 125.946 where I expect price to push towards and retest. A break of that level will push price towards the 127 zone. I’ll continue posting with my progress; currently we are hovering in convergence and the stop is tight… Enjoy
Hi defiance888!
Well my B point is in fact at the lowest point between A and C. I just placed the letter B a bit to the left for visibility reasons and sorry if the screenshot was a bit blurry and that wasn’t clearly visible.
I am drawing the patterns and points the way TMB teaches in the beginning of this thread. Watch his youtube videos.
And for some reason my results differ from others in here. I think it has to do with my broker somehow since my charts look different than others. For now i’m fine with it since the patterns i find myself work out for me. Don’t get confused if you do not get the same results as me when trying to reproduce one of the patterns i post in here.
When i for example draw my fibs from the exact same points as TMB on the exact same chart and time frame i do not get the convergences he gets.
In near future i’ll change broker to FXCM and until then just see my posts as a clue that there might be a pattern hidden if you do not get the same results i get.
Scalped profit above netlong around at 125.025; I will wait for the news to come out before continuing the trade, If price pushes back down towards 124.612 I will re-enter the bullish buy; Break of the hourly 200 MVA will buy a continuation signal