is it possible to view all the posts of TMB solely? (no offense other contributors  )
)
yeah you can. On the upper part of the thread click “search thread” then go to “advanced search” then type in tmb’s name n they wil b filtered to show only tmb’s post.
That is insane. Were you following signals or using the MSRT line, cause I’m trying to match up the price signals with your orders and I’m not seeing a direct match. Either way, impressive orders.
Awesome job Sirpiper! Congratulations! Keep it up! 
Make sure you set the years 2009-2011 for the first search and the second one starting from 2012. Otherwise you will not see the new material posted.
A bearish gartley pattern on 5 min chart has formed for the continuation of current break on the EUR/JPY. Where 127% CD has great convergence with the .382 of XA (X = 125.790) I’ve entered the short at 125.168 Will add additional lots if price pulls back towards 125.358 (Place a horizontal line at 125.358 for it is an MSRT).
Entered final positions on the EUR/JPY at 125.329 (first positions mentioned previously in quote).
Entered short EUR/USD at 1.34255 where a Bearish Gartley pattern on the 4 hour chart has formed. In this pair the .382 of XA (X = 1.36442) converges with 127% CD and the convergence lines up with a major horizontal resistance line (convergence has been respected for the past 8+ hours.
Entered short for the EUR/GBP at .86952 where a previous major D point was retested and respected (this also goes in accordance with MSRT zones from our previous analysis.
Each trade is good for a quick 30 pip scalp and is projected to push well over 90 pips. AVG targets should range between 30-60 pips max.
Be my guest and find the patterns that I’m seeing or candle stick confirmations that go along with it.
BTW, I’m waiting for a buy on the EJ at 124.66, if price breaks 124.612 I will sell towards 124
Good morning everyone!
I will be focusing on the GBPUSD trade i’ve been talking about for some time now.
Price has not yet hit the convergence but shown signs of the support area affecting it. If you take a look at the weekly chart below you can see that we are in areally interesting zone of support which has been tested many times and price did not manage to break through it.

In combination to that support area we have a lot of things coming togheter, especially a bullish gartley on the daily chart even though i know some of you have gotten different results when reproducing this pattern.

Nontheless this is a very strong support level and except of the earlier support shown in past price structure and bullish gartley, what do we have?
RSI divergence, trend line from the descending channel hitting the convergence, MSRT line crossing with convergence and a institunional level (1.54000) where the big players tend to buy and sell at.
Yesterday i placed enterd long at 1.54258.
I think will push down a bit more to hit the convergence for real this time at which i will enter with another long position.
I think we should at least see a retracement up to 1.57750. But it’s even a good trade to get your 30 pips. 
Since this is on a bigger time frame and this is a support “area” which is stretched out a bit i would say if price closes below 1.53000 the support has definitly been broken.
This is one of my first attempts to share my own analysis of a trade with you so bare with me if i’m unclear about anything and not so precise as TMB in his predictions. Hope you find this one helpful!
Have a nice day everyone and good luck with your trades today! 
PS. Major news will be released for the GBP in 2 hours from now!
Moved EJ Buy Entry to 123.533 where the 1.0 of XA converges with 200% CD, will wait and see how price initially reacts from 124.612 on the lower time frame before considering a reversal there.
TMB, Any chance you could post your chart for the EURUSD trade? I really can’t find that bearish gartley… Think I’m a bit too tired…
I just bought at the convergence level every time it visited the level (124.65 on my platform). Closed out before the 10:00 news and bought again when price revisited after the news with the 12:30 candle. I kept the rule of closing the trade if I have a close below 124.60. Also I were on with more than 1 position. Hope this helps merger.
Edit. The mentioned level is the one TMB signalled early morning GMT.
Freed positions on EUR/USD trade and placed remaining lots to manage EUR/GBP spike at .87508 and .87433. Where a horizontal MSRT from the daily at 0.87522 adds resistance to bearish butterfly that has been triggered for the 4 hour chart. Here 1.272 of XA (X = 0.86882) converges with 100% CD (BC is 02/12/2013 6am est of the hourly).
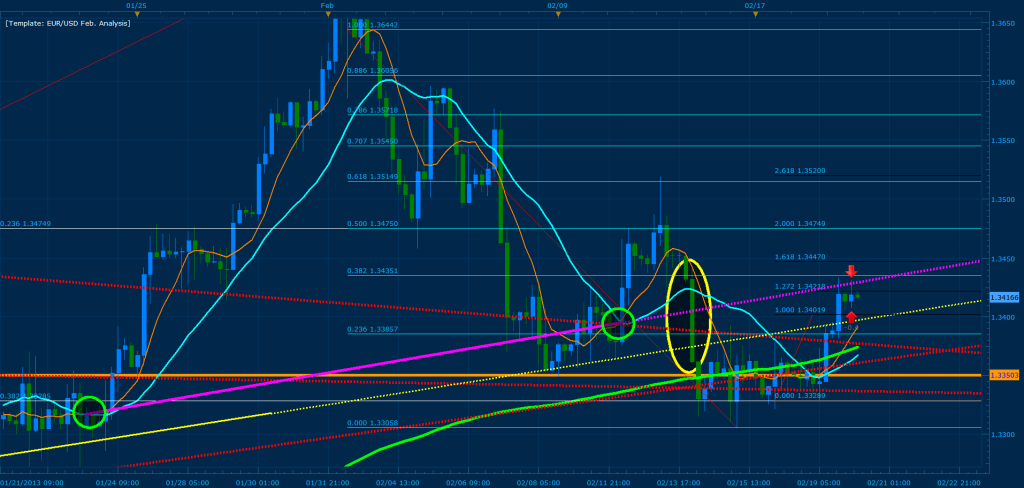
As you can see bellow, price has triggered a bearish gartley for the EUR/USD four hour chart where the .382 of XA (X = 1.36442) converges with 127 % CD. In addition, we have a purple MSRT coming from the four hour chart crossing with the convergence zone. I’m using the yellow ellipse here to illustrate the first break of the purple MSRT showing the first signals of bearish continuation on the pair and a break towards the daily MSRT’s (red lines). The yellow line is a bearish head and shoulders that was broken; refer to the February analysis of the EUR/USD for the points I have drawn. Also, I’ve circled (green) the MVA crosses that I am using to draw the 4h MSRT that triggered the pattern.
au m30 gartley 1.0343

update: well this was a 3 pip fail (shown on m5) . hasn’t broken X yet but i’ve seen enough.

if you take x to be 1.0289 there us an upcoming bullish gartley perfect convergence on .50 XA and 127.6% CD.

congrats on the 30 pip scalp if you took the trade should continue down towards 1.33285 (if this break next target is 1.32101).
could be lewis, 1.0319 is where the failed gartley becomes a crab too.

and there is a possible bat on eu at 1.3387

however aussie also in the bearish H1 structure, so i’m not doing a thing, prolly should have shorted the h1 bat lol

Scalped the EJ at 125.083 for 25 pips from highest entry and 8 at the lowest because of the major news coming out at 8:30 and current price action.
Placed a bullish entry for the GBP/USD at 1.52564 where a bullish butterfly is developing on the monthly charts. Where the 261 % CD converges perfectly with the 1.272 of XA.
Added freed lots to the EG butterfly that formed at 0.87522
Again My bullish entry for the EUR/JPY is at 123.534 if 124.612 breaks I will re-enter the short. Also note that I have a bearish entry for the EUR/JPY waiting at 125.994 where the 1.618 of XA converges with 200% CD (find the pattern and post it I dare you heh… look towards the 1h/30min chart and you will see that the bearish movement came from a butterfly at the 1.272 of XA).
Thank you! Made it a bit easier