Anyone else go long on this eur/usd bullish gartley?
I just started a crash course in forex a month ago. Found this thread a couple nights ago and now trying out tmoneybags system. Still on demo account. Will I really get my first one right? And with the buy order on the exact pip? We’ll see…
By the way, thank you TMB for putting all this info out here for all to see. I would have never come up with something like this system on my own. And yes I stole your chart background color. If you want to be the best, emulate the best.
Update: price came 2 pips from hitting my 30 pip target, it then retraced all the way back to where i had moved my stop to close me out at 2.5 pips profit. Didn’t expect that at all. The rookie nearly had 30 pips easy though. I’m still surprised at how accurate the entry point was.
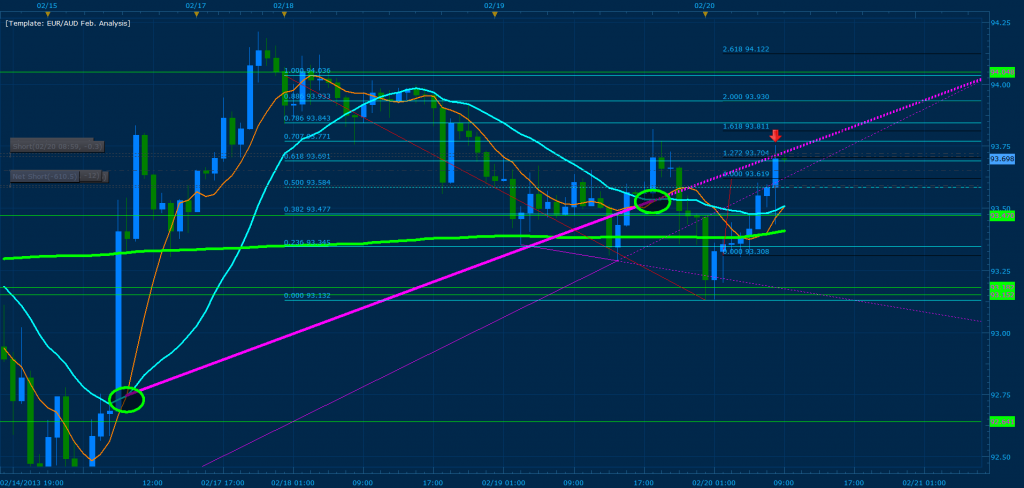
Added positions to the UJ at 93.721 where 127% CD converges with .618 and .707of XA (X = 94.036). An hourly MSRT crosses with this convergence and as illustrated bellow, I’ve circled (green) the crosses I’m using for the MSRT. A break of the .707 and the MSRT should push price towards 94.048 and test the highest high. Target 1 is 93.182, Target 2 is 92.641; conservative target = 93.41
In long on GB/USD with 1K. I don’t think a break of the 1.53 is an issue at all, seeing as past peaks went down to near 1.52 before rebounding 1000+ pips. My stop is at 80 pips
I’m new to forex (about 2 months) and have been doing mostly research with that time and demo’ing different trading methods. About the past month I have been learning about pattern trading and harmonics and I believe this is definitely the method for me. This thread looks like it will definitely help decrease the learning curve as there is years of data and information. Thank you to all who have contributed, especially TMoneyBags.
With that said I made my first demo trade last night, A bearish Gartley on the 1H chart as Modo also pointed out above. My entry is at 1.0355. got in a little late as I was in class and did not have access to a computer. Once the trade moved about 10-12 pips I moved my SL to b/e and was eventually stopped out on the retracement that retested the D point. I was unable to re-enter at the retest because I was sleeping, but would have made some good pips if I had.
Scalped the profit from the EG and UJ trades since they are not performing as well and major news is coming out in two hours along with the 4hour close the up comming hour. With the freed lots, entered partial positions at 124.612 of the EJ for a quick 20-30 pip scalp before the closing of the 4 hour.
Closed the partial lots because 1 hour sat on top of the convergence… Don’t want to over trade the account especial after recovering and making profit from the EG spike. I will be around to answer questions for 4 more hours and leaving the entries I previously mentioned in place with 30% of my max lots. Another day sailing rough waters this smells like major reversal or continuation from experience Lets see what happens in the coming days.
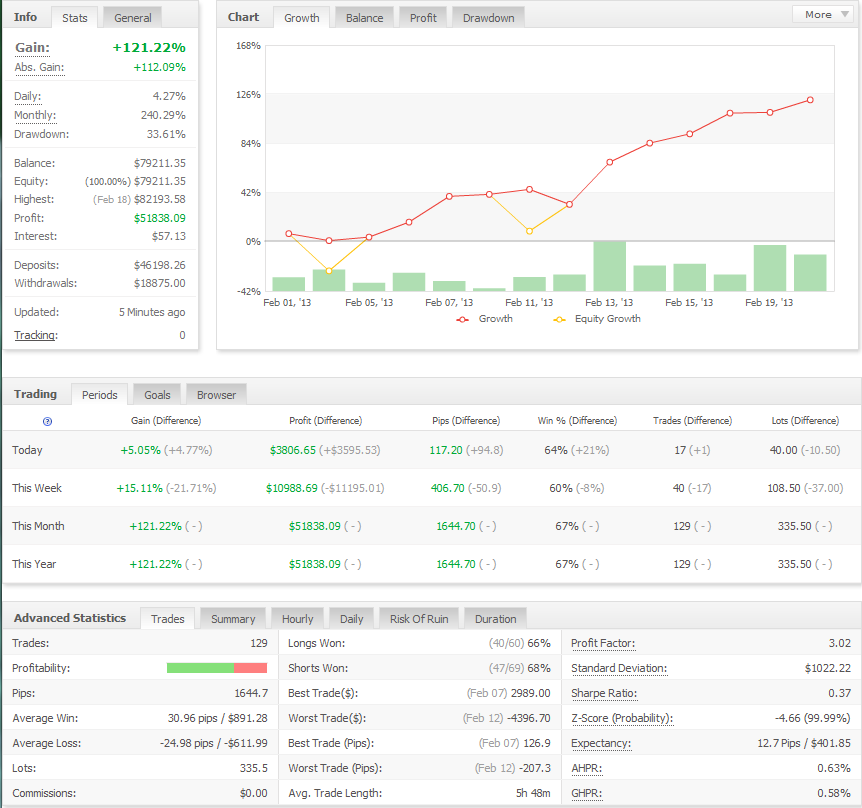
I’m closing for the week since I’m leaving Vienna early Friday for a few weeks to visit one of my earlier students from this thread… (now a trading partner). In other words, we will be working on further developing the the current system and focusing on risk management and execution.
In effect, I leave you with the results of week 3 and will not continue trading until next week. Feel free to post questions for I will be available to answer them.
Fantastic work TMB, congratulations. Have a nice trip to Vienna!
My GBPUSD trade was canceled as you clearly could see. I closed all my trades before the news on the pound came out and they totally destroyed my setup.
At the moment i have tons to do at work and my private life so i won’t be able to be as active in here for the next 2 weeks if you are wondering where i am. I am to stressed out at the moment so i gotta take a step back and focus on the things that are more important at the moment since trading forex still is a hobby even though i put it high on my want-to-do-list.
But i’ll try to pop by now and then if i get some spare time.
I wish you a great rest of the week and good luck with your trades.
And remember…
[I]“It’s not WHAT you do, it’s HOW you do it!”[/I]
I’m still pretty new to Gartley and have noticed that my results are a little off. Like the price was hitting fib levels, but mainly the wrong ones i predicted. I have seen TmoneyBags vid before [i found it very helpful] but decided to watch it again as you suggested, and also because the price was hitting the wrong fibs. From watching the vid I realized the way I was putting down my B and C points were not very good and have just starting adopting the way TmoneyBags was calculating his ones.
since the way i was calculating my B and C’s were a little dodgy I guess that might explain why my results differed from yours.
Today i had a lucky call, well … the price hit the fib i expected it to. there was some resistance but the EUR/JYP was on a plunge and broke through, and the price stopped like 0.005 pips away from my stop loss then went back up above my fib level. I was away from the keyboard at the time, and i think i got there like 5 minutes after it happened and noticed i was 20 quid in profit, but i also had a gut feeling that my Fib level was about to be smashed through again even more and to take my profits and run (my fib TP targets would have been around 60 quid profits if reached)
So i took my small profit and ran, and soon after that it retested and retested the level and then smashed through on a very large plunge. so i guess i was lucky.
from now on i will be mainly drawing the fibs the way i have seen in the video. hopefully i can get more reliable results. I am trying to use small amounts of money till i can get reliable results as i am still new at this. I notice TmoneyBags is now using moving averages and other stuff as well [he wasn’t at the start of this thread], i think i will eventually do that too, but i don’t want to just yet as im still pretty new and it may complicate things too much for me at this point.
Has anyone seen a result like this before? I was doing quite well, and happily above break even on a CHF/JPY Bullish Gartley trade, then I lost it all. I’ve heard of slippage, but my Marketscope appeared to freeze and flatline for a minute before plummeting 15 pips, going past my stop loss and giving me a loss. That would be $100s or $1000s of dollars wiped out if I were trading full sized lots…
For longer term charts - which in practice, seems to be most of his charts - TMB mentioned he uses the 7 stick MVA instead of wicks. It’s somewhere around 730 where he explains this, perhaps a little bit before. Basically, just try from the wick and then from MVA, and see which fibs the price is respecting more as it comes down the C to D leg. I think a lot of people still use the old way of wick to wick with good success though.
In the early threads I’ve stated that you should check if the market you are trading respects fibs best from wick to wick or from base price to wick; while experimenting with the MVA’s I’ve noticed that the extreme curve of the 8 MVA turns out to be the base price of the candles on higher time frames.
When you went to break even, i would have placed a new order @ retest with a small s/l. I would have done that because at that time u went to sleep. However you did the right thing by bringing the trade to break even anyway.
From what I can tell the gartley will complete the D segment at the XA 88.6 and CD 127.2. I have a buy in at a re-test of that point (1.0249). I’m targeting a 50% retracement of the AD with a stop below the 127.2 of the XA in case it turns into a butterfly.

 I don’t think a break of the 1.53 is an issue at all, seeing as past peaks went down to near 1.52 before rebounding 1000+ pips. My stop is at 80 pips

 this smells like major reversal or continuation from experience
  Lets see what happens in the coming days.