30 Pips A day Keeps the your money at bay

Thank you for your insight. the USD/CAD turned and did not reach my target like you said. You mentioned though there was a bearish gartley forming as well, I don’t see it. Would you have the time to illustrate it in that chart? Or even just tell me the points?

For what’s it worth I see that since USD/CAD turned bullish at 10:00 it is forming a bearish gartley at the convergence of XA .707 and CD 1.000. What scares me is it also has close convergence at the CD 1.27 and the CD 2.00. So I could see taking a loss or two before it possible reached its reach D point.

I’m curious. Is anyone following this still using the original 30 pip TP/gartley strategy in this thread? The best I’ve been able to capture recently is 8-15 pip retracements.

If you look at current 30m EUR/JPY chart and than zoom in on the 5 min chart you should be able to see that today price remained in a range. Effectively turning at the completion of patterns to give us three opportunities for the least. First D of a butterfly pattern completed at 8:40 GMT second D is around 12:20 and between them there was a fifty pip move. One needs to steal 30 pip of that. Not all pairs offered such a range. My guess is that you need to select a high volatility pair (one with high ATR) otherwise it is difficult to scrape more than 20 pips. Easier said than done I know, but as long as there is the move it is doable. Hope this helps.

I’ve taken out everything without an average daily range of 100 pips or more. I actually was trading the EU/JPY pair this morning, but I picked the wrong fib convergence and missed entering the right convergence by about 4 pips. It just seems like retracements were worth much more back in 2009 so you could profit off a few and the rest would go high enough to move your stop to breakeven. I’ve got 25 Gartley trades in the past 3 weeks and only about 4 of them(<16%) managed to reach 25+ pips under the rules of move up stop to breakeven if you are halfway to your TP. While an equal amount shot down past the fib to my stop, the majority retraced 5-10 pips then slowly creeped back to hit my stop and take me out negative. Some of those went on to reverse, but so far down that it was generally at the next convergence.

I’m just curious to see if anyone is having any luck trying to adapt the numbers on those rules. It seems that the thread has moved on from its origins and I want to know if the rules of the trade are decidedly unprofitable in this market or not.

I have slightly different set up on the USDCAD though

Thanks. This actually confirm what I have for the EU pattern. However, I drew X from the base of the candle

I have the same one, but I drew it on 1H

Current running on a buy order on GBPJPY on 15M chart

I have the above set up to trade to D of the following pattern. Hope it work out.

Hey guys! As you have noticed i’m not as active as i’m normally am. Thats because i attended a course in trading forex last week, you’ve seen me post about that earlier. I had 17 hour days since i work full time and thereafter attended the course.

To maximise my learning curve i decided to jump onto a 12 week trading course combined with a daily 3 hour live trading room with a professional trader so i can get my questions answered immediately when they pop into my head.

I know 70% of whats taught in that course but i did it to get a good routine for each day and even more to keep my motivation on top for the next 3 months.

So i will not post as frequently over the near future since i’ll have very busy 90 days up ahead as you can imagine.

Was looking at some pairs this morning and i thought i would share one or two of the patterns i found with you.

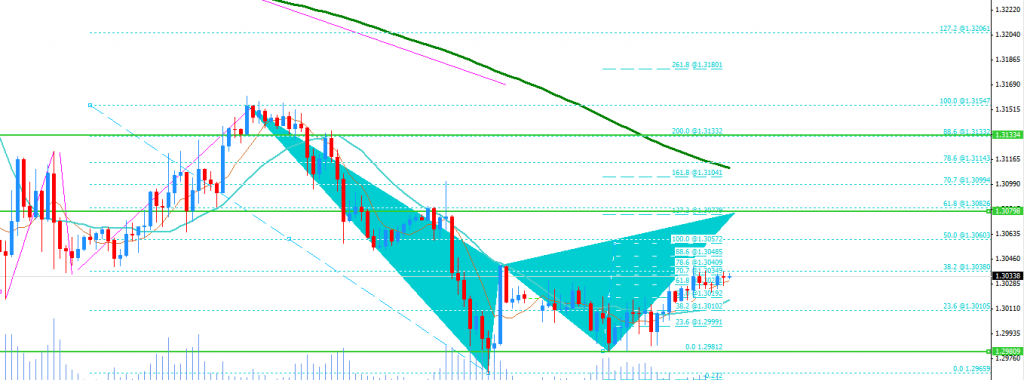
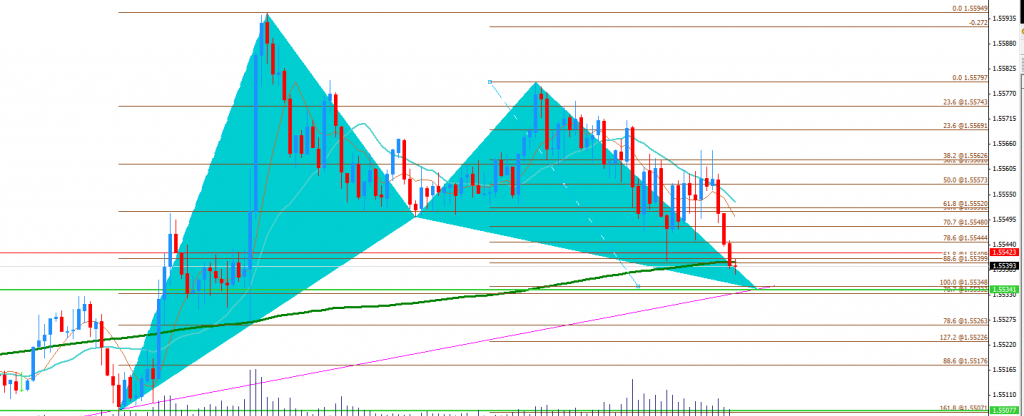
First of we have a bullish bat pattern on the GBPNZD, hourly.

If this pattern completes we would see a reversal at the 0.886 of XA. If i would enter this trade i would place the stop loss 10 pips below X and TP 1 at 0.382 of CD and TP 2 at 0.618 of CD (but we have a minor resistance between 0.618 and 0.500).

As you can see i’ve taken earlier minor and major resistance levels into my equation when choosing take profit levels (orange lines).


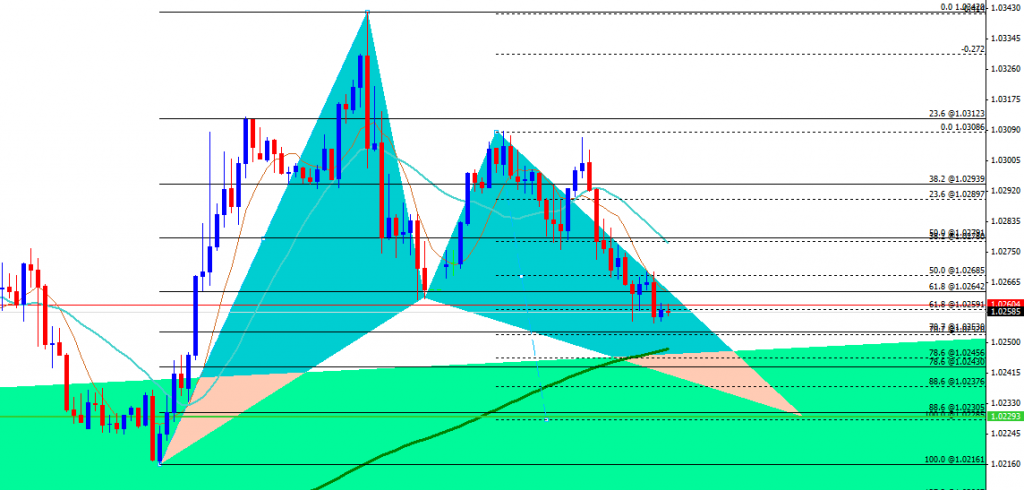
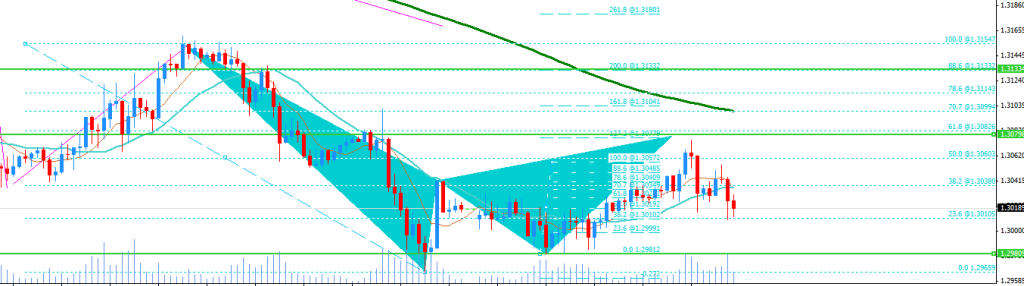
Then we have a bullish bat pattern on the AUDUSD, daily chart which i am currently in.

It triggered 24 hours ago and is looking good until now. To late to jump on this trade now but if we see a retest of the 0.886 of XA there may be a chance to catch some more pips.


For some reason there are many bat patterns around at the moment or i am focusing on them without knowing it… :wink:

A good thing with bat patterns is that they give you a fantastic win/reward ratio since you place your stop beneath the X point of the pattern and the D point where you enter your trade is very close to X (0.886 of XA). Both trades above have a risk/reward ratio thats higher than 1:2 so even if only 50% of your trades are winners you will still make good money.

Allright guys, now i gotta start working here. Have a nice week and good luck trading! :slight_smile:

The 30 pips a day ruling doesn’t necessarily mean that you have to focus on only aiming for 30 pip targets with each pattern that you trade. Some times as you say the market will only move 10-20 pips in your favor; when the market ranges in this manner then you can do 2-3 trades and close out with a positive 30 pips for the day. If the case comes like it did last month where the 5-30 min charts where pushing 30+ pips then you can significantly reduce the amount of trades you must take by completing the 30 pip goal with one pattern.

Anyways, what markets have you been trading? During what time do you usually trade? Are you trading the majority of the time with the trend or against?

I’ll throw in some patterns this week with 30 pip targets :wink:

Hello, everyone!

I would like to ask you if isn’t too forced how I chose BC leg on AUD USD M30
The price have reached a respected trend line and could be a very good point to sell:


The problem is I can’t seem to figure out when to be happy with a 10 pip profit and when I’m looking at a true reversal, unless it happens quickly. Here’s a great example of a trade where I had the right fib picked out but lost money.

The GBP/NZD basically turned on the dime at the selected fib. I know that the 1.00 of the XA is a less reliable target, but in this case it worked out. My first entry was basically just above the convergence and I got in and was up almost 15 pips at one point. I raised my stop to breakeven and then got taken out for 0 pips. I noticed that the price action was still respecting the convergence level for the next few hours and forming something like a falling wedge. I placed a second buy 10 pips above the convergence level, hoping to catch the upswing if it broke out. I caught it alright, basically at its first peak. Then price dropped and took me out at my stop. A couple hours later, after breaking down a wee bit more, price shot up more than a 100 pips.

Except for the attempt at the second entry, which I won’t try again, this is actually a good trade. There’s a lot of trades like this where the price rose only say 8-9 pips and I didn’t raise my stop and didn’t get out and eventually lost money on the next candle because I was just looking at a small retracal in the larger trend. I’m starting to think that if the price goes above 5 pips positive, I should raise my stop there. Looking back at my history I would be about neutral or slightly positive using that method.

Anyways, what markets have you been trading? During what time do you usually trade? Are you trading the majority of the time with the trend or against?

I’ve been trading any market with a daily range thats ~100 pips or more. I trade during the New York and early part of the Japan sessions, mostly continuously because I’m switching jobs and can relax at work for the moment. I haven’t been paying attention to the trend much, but looking at a few recent trades, I am mostly in ranging markets, and rarely in trending ones like the UJ or GU.

Thanks for the help.

EDIT: Drew fibs wrong when I tried to recreate my setup. Got in to work and found my original gartley analysis that makes more sense.

What i’m recognizing lately is that, it move about 20 pips then retest, then move again to my 30 pips target. My rule is set break even at 20 pips in my favor. And I got stop out 3 times yesterday on Monday and Sunday night.

This pattern worked for 80 pips. and I took 30 pips from it :). Almost reach my pattern on 1H chart that I posted previously.

Hi TMoneyBags. So i made a trade last night on the EURGBP M30 chart. Can you take a look at it a tell me your opinion? did i make any mistake or does it look alright to you?

also i have a couple questions if you dont mind.

  1. where do you set your stoploss? is there a rule?
  2. do you always set your goal on 30 pips? i mean its “easier” to make 30 pips on a daily chart than on a 15 minute chart.
  3. how far down in timeframes would you go with this strategy? M15? M5? or even M1?

thanks in advance

edit: i have to add some info about the chart i think.
point C is on the 78.6 retracement of AB
point D is on the 78.6 retracement of XA but as i only see now there is no correlation on point D between the XA an BC FIB levels. I assume that was my mistake.

A nice one on GBPAUD 30M forming
100CD converge with 78.6XA

Let me try to help you if you dont mind.
Your setup is fine. But as it mentioned in this thread before. the time that your pattern formed is between 11:30PM and 12:00. This time you may get fake out. and actually it did.

TmoneyBag didnt use physical stop loss. He uses visual stoploss. He may have emergency stoploss about 100 pips or so, I dont know the actual number.
2. You can refer to the post above from TmoneyBag.
3. You can trade on any time frame. It work best on 30M and 1H or above. for me i trade any time frame, but mostly from 5M or greater.

hey shonick. where are you drawing your XA fib from? a thought you had to start from the lowest point of the candle? which in the GBPAUD chart would be 1.46864. Or am I the one missing something?

I draw this X from the lowest point of my 8 MVA. You can either draw from wick,base or MVA. There is a post explain it in this thread in the last 2 months.

A bullish 5M GBPCAD. My target is 15 pips on this pattern since it is on 5M and not a lot of movement. Kind of ranging and in the down trend on the 5M, slow downtrend though

wow. I just miss another limit order last night for 1.5 pips