Wow that a powerful pattern. Where is a good place to learn about them?
I can give you an overview. The pattern was discovered by a fellow who works for Jason Stapleton (I’m not a fan of his), and the trick to the patterns is that although your RR is going to be close to 1:1, it has a high success rate.
XA leg is the same as most patterns:
B should be at least .38 of XA but not close beyond .618 of XA
C must be at least an extension of 127 AB, but the most extreme candle BODY (not wick) must not reach or exceed 1.4141.
D Completes at .786 of XC.
I think people take 1st profit at .386 of CD, and the rest at 618, but I guess you can do it a few ways. I have a halfway decent understanding of it, but you can find better explanations online.
2016-01-06_1723 - Hogarste’s library This one moved into some profit but failed the next day. One key to most harmonic patterns is D occurring around structure.
OK so I ended up with around 20 pips. I was up around 50 pips when I moved my stop loss. Im not sure where that huge bullish candle came from, but it stopped me out. I should have secured 30 like TMoneyBags says lol but at least I made some profit. Profitable on my first pattern ever!! https://i.gyazo.com/b23cd4070fc865c3e20d82c0b0176970.png
I always say , don’t let a good trade go bad. Always take something , so i am ok with what you did Jusava.
Got stopped out, too.
When analyzing what happened I must realize that I did not stick to my plan. I still have got a lot to learn.
As you can see on the last image I sent from my phone RSI was still not in my overbought zone, which I set to 75, in order to get an extra confirmation for overbought.
However now RSI is over 75, trading time fits into my plan so I try it again.
As TMB said: Never give up on a trade 
Regards
Nemo
Now that RSI is at 75 and the four and the daily candle is showing movement going short is the time to pull the trigger.
Since it figured out to be a Crab pattern D can come to 1.27-1.618 and is supposed to drop afterwards. RSI on H4 has come up above 75 but has not yet overcrossed the 75. So we wait.
Waiting for the noon.
Sounds good Nemo75 , never be in a hurry to pull the trigger.
Post deleted after coffee proved that Cypher b leg never reached .382 XA - my bad.
Hi Hogartse,
thanks anyways.
Jason Stapleton was the guy who put me on fire with that stuff Although they still look like all the same for me I’m committed to learn more about patterns. I always need to look at the Fib levels des ribed in the cheat sheets to confirm whether one of them is valid or not.
Happy Pips …
Nemo
Jason is a really talented trader and a very smart person. What he teaches is good to know, and again, I’ve tested Harmonic Patterns, and my results show that they can be traded profitably and offer an edge. In addition to all that, I dislike the way he goes about business, and dislike the comments he makes on his radio show. The thing you’re going to learn is to define patterns with a specific set of rules, back test the markets you’re going to trade and always trade in accordance with your rules.
I am very happy that I understand harmonic patterns, but I also understand that Harmonics occur because of what price is doing in the market, not the other way around.
Another one coming up on UJ M30 - most likely round about London open time. Be aware …

Happy Pips …
Nemo
Levels of XA and CD not nicely aligned though … maybe interesting for you guys.
Spotted on GBPUSD - M30:

Happy Pips …
Nemo
Dare I ask what you define as talented trader … !!!
I agree Jason is a talented talker … that attracts a particular group of beliver …
Closed both of the trades wirh at least some Profit - 56 Pips in total - in accordance to my trading plan at 1 pm CET.
The week is over and I’m so curiously looking forward for the next one.
Will use the weekend to backtest the patterns on my standard pairs to gain some more confidence for entry and exits.
I measure AD and use .618 as target. After reaching some profit (>ATR(8)) I trail to breakeven.
Which exitstrategy are you using?
Regards …
Have a nice weekend
Nemo
I hate to spend time defending JS. I also don’t want to turn this thread into one of those mentor debates, but it is a harmonic thread and JS is a harmonic teacher. If one accepts harmonics and structure analysis as a valid way of approaching trading, Jason has carved out a niche’ in the trading world. He has outstanding psychology, in that he knows what he’s doing and approaches the charts the same way every time. He applies ‘if / then’ thinking’ in a way that I would call very good if not outstanding.
If folks on this thread are going to look into Scott Carney and Larry Pessevento, then watching videos by JS or Akil Stokes fits into all of that. I considered buying a course, but chose not to, because a lot of what he teaches is recycled stuff (like many teachers) that is available for free. My personal view is that he’s a hustler and I don’t like his style. But if I were going to spend several thousand dollars, and IF I wanted to look at the markets in a “higher high, higher close, outside return” kind of way, I would buy a course from JS.
I think I get what your saying about the “particular group of believer…” thing, and I agree with you. I can disagree (in this case dislike) someone’s politics, think a persons is a hustler, but still find things about them that are deserving of respect. I don’t like JS, but I respect him, and he teaches people how to trade in a way that is similar to what this thread is about. I’m not saying emulate everything, and I’m NOT saying to buy anything, but he and Akil do offer free content, that someone who appreciates this thread, might get something from. It is not out of place to suggest learning materials here I think.
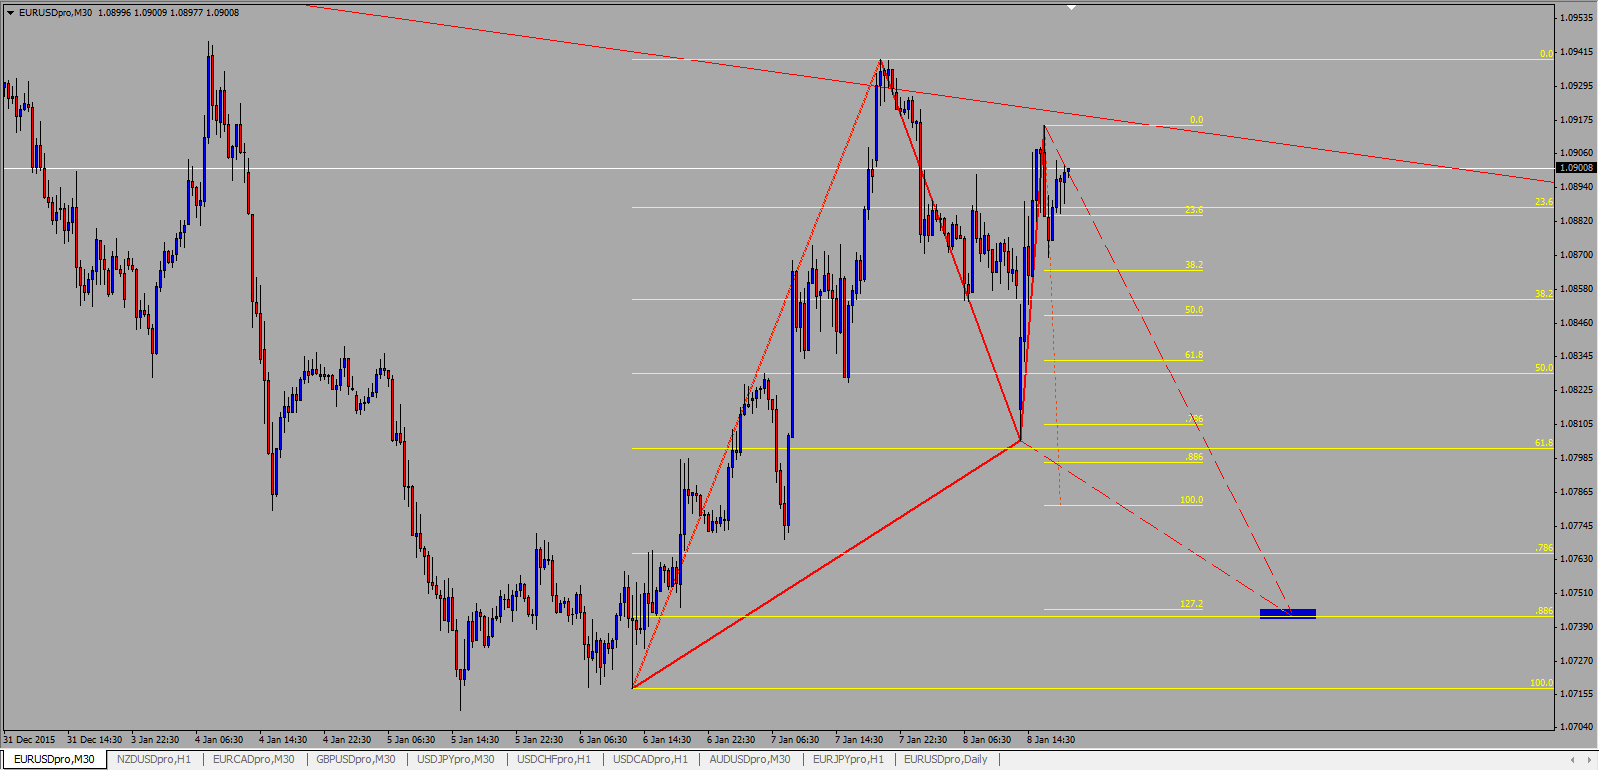
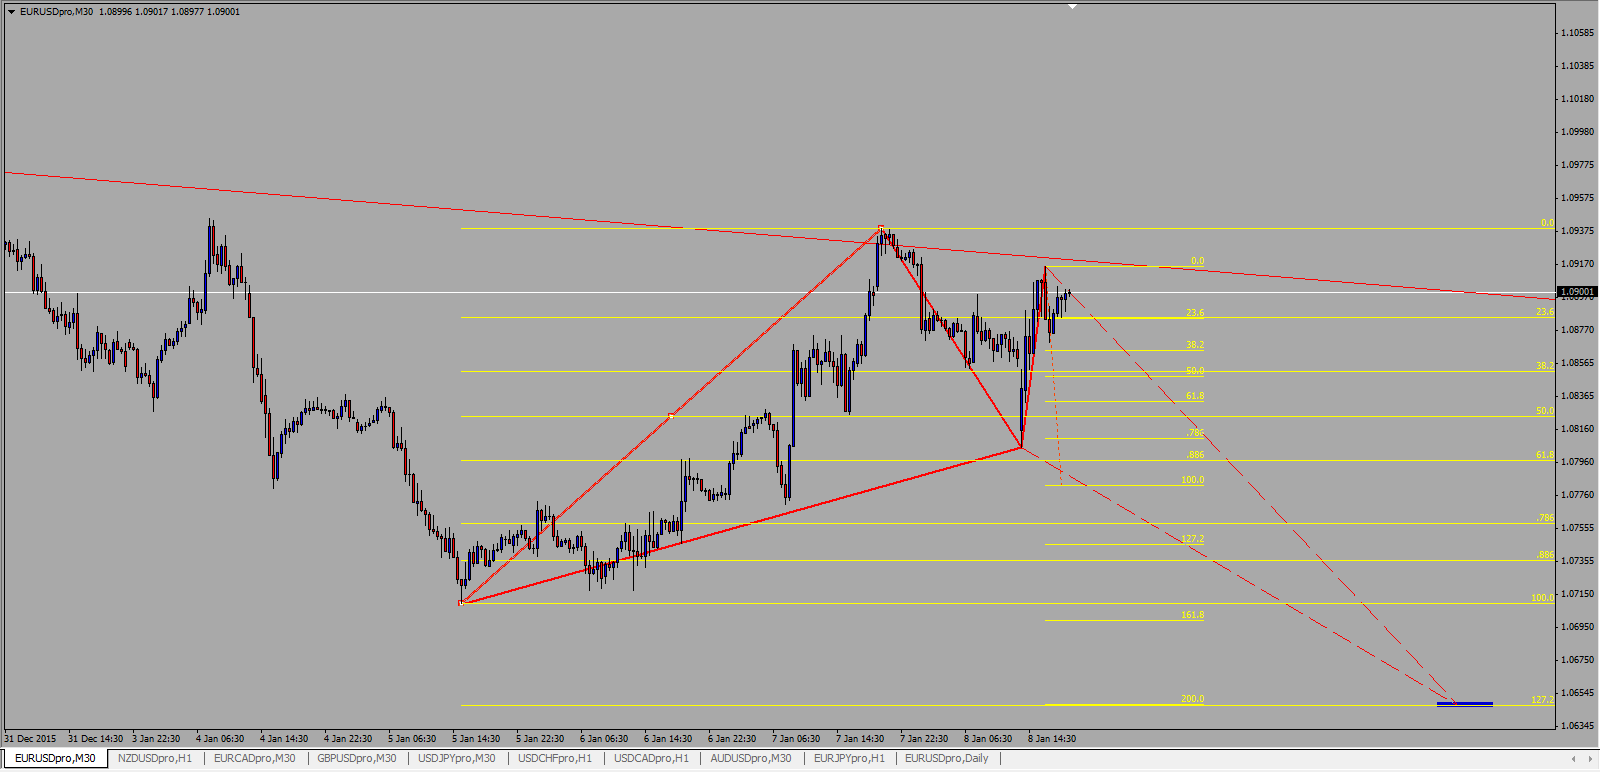
Hi guys I found another pattern let me know what you think about it. There was 2 points convergence that I liked. They both gave the 30 pip profit but unfortunately I was unable to take the trades because I was traveling  What do you guys think about the convergence of 3.618 with 100% of XA? This is a rare pattern right? I liked how it was close to strong resistance. https://i.gyazo.com/7ed5a34b0a10305e1d336117175e54cc.png
Found 2 other patterns on the eurousd using two different lows. Can someone help me by explaining which one is better and why?
Thanks,
Jusava
You must expect a reaction when you claim that Jason Stapleton is a talented “trader”
JS success as a trader can certainly be compared with my talent as an opera singer in the shower . !!!
JS … SMART yes and no … …JS is a talker that attracts a certain kind of desperate people who buy expensive futile indicators and analyzes and analyses of all the world economic problems,
https://t2t.infusionsoft.com/app/orderForms/Constellation-Software
JS and other gurus that you mention in your post.
I do not doubt for a second that they have good pedagogical skills to teach away their material.
The question is whether it provides a good enough basis knowledge that gets you to develop as a successful trader, or whether it is a dead end that you can not get out of !!!
[B]My claim a dead end.[/B]
[U]Here come the criticism, all who posted maps and analyses in this thread are blind hens that have gone blind in harmonic pattern and fib …
[/U]
[B]They do not understand the underlying causes behind price movements, an enormous amount of knowledge that should be included in an assessment prior to making an entry based on a harmonic pattern
[/B]
A small quiz, posted earlier by me in this forum
Under you find a list with 24 price behaviour you often find with reversal .
How many of them are you aware of … or do you only trust in a pattern and fib !!!
Reversal signals all traders should be able to understand
Example bull reversal in a bear trend …
- Strong bull reversal bar ,large bull tend body and small tails or no tails.
- The next two three bars also have bull bodies that are least the average size of the recent bull/bear bar.
- The spike grows to five to 10 bars with out pulling back for more than a bar or so ,and it reverses many bars ,swing highs ,and bears flag of the prior bear trend .
- One or more bars in the spike have a low that is just one tick above the close of the close of the prior bar .
- One or more bars in the spike have an open that is above the close of the prior bar.
- One or more bars in the spike have a close on the high of the bar or just one tick below its high.
- The overall context makes reversal likely, like higher low or lower low test of the bear after a strong break above the bear trend line.
- The first of second bar of the breakout has a close that is above the highs of the many prior bars.
- The first pullback occurs only after three or more bars.
- The first pullback lasts only one ore two bars , and it follows a bar that is not a strong reversal bar.
- The first pullback does not hit a breakeven stop ( the entry price).
- The spike goes very far and breaks several resistance levels like the ma, prior swing high ,and trends lines and each by many ticks.
- As the first bar of the reversal is forming ,it spend most of it time near its high and the pullbacks are less than a quarter of the height of the growing bar.
- There is a sense of urgency .You feel like have to bay but you want a pullback ,yet it never comes.
- The signal is the second attempt to reverse within the past few bars ( second signal).
- The reversal began as a reversal from an overshoot of a trend channel line from the old trend.
- It is reversing a significant swing high or low(e.g., it breaks below a strong prior low and reverses up).
- The high 1 and high 2 pullbacks have a strong bull reversal bars for signal bars .
- It has trending “anything “:closes highs ,lows ,or bodies.
- The pullback are small and sideways.
- There where prior breaks of earlier bear trends lines (this isn’t the first sign and bullish strength).
- The pullbacks to test the bear low lack momentum ,as evidenced by its having many overlapping bars with many being bull trend bars.
- The pullback that test the bear low fails at the Ma or the old bear trend line.
- The breakout reverses many resent closes and highs . For example, when the is a bear channel and a large bull bar forms ,this breakout bar has a high and close that are above the highs and closes of five or even 20 or more bars .A large number of bars reversed by the close of the bull bar is stronger sign than a similar number of bars reversed by only its high.
So forum members im afraid mostly of you who have trying to read this post is complete Greece for you ,
Read more: 301 Moved Permanently
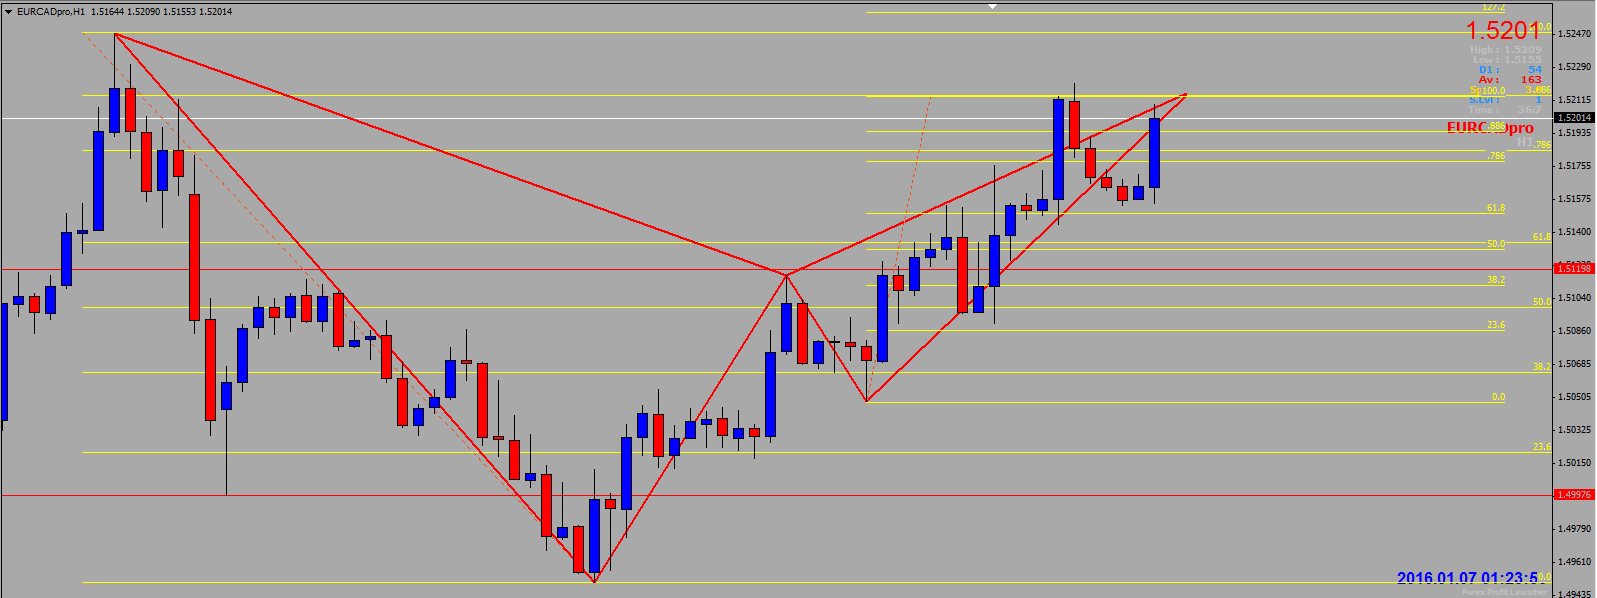
Hi Jusava,
you already know that I’m not an expert on patterns, but I’d like to share what I see and hope this would be valueable somehow.
As far as I can see in your attachment the retracement of AB in relation to XA is just about .236. I don’t know any pattern which is valid with this value.

If you bring down your X to the next structure high below you get a valid Crab pattern, although it has a double bottom, instead of a retraced CD leg. TMB wrote in some of his early postings in this thread that it’s valid with a double bottom, too. In my opinion the levels are not nicely aligned. All in all I do not like it, which is very subjective of course 
I’d rather would have traded the 2618 if it had not come up too late. The pattern was almost perfectly completed and retraced round about 120 Pips within a couple of hours today. There is still some potential in the pattern, but RSI shows a slightly overbought value so I would not trade a dime on it until that changes.
Letz see what happens in early next week.
Regards
Nemo