I kindly ask you to get back to the topic: [B]Harmonic patterns[/B].
It seems that you have a lot of knowledge and I invite you to open a thread and share it with the community. I’m shure that your ideas and engagement will be appreciated.
I strongly believe that nobody can make someone else a successfull trader. It’s all happening within one person, because the psychological factor is one of the most underestimated facettes by newbies, who hop from one indicator to another … start new strategies that they have read in a book, or in the internet about.
Patterns are just one possible way to try something similar to “prediction”. I’m not a native speaker, but I think you call it “giving it an edge” :22:
Another trader may like technical indicators more or read candlesticks. Whatever … Anybody having gone through the ups and downs of this “adventure” who did not start to handle it like a business, instead of an adventure will fail. No matter which ruleset, or indicator he or she uses. Something that successful traders have in common is that they trade like professionals, not like gamblers and they combine a lot of different techniques in order to confirm a assumption regarding future price movement. So I treat this thread as a puzzle and I thank TMB for having started this and all contributors for sharing their knowledge with me.
So … are going to start a thread with your signals? :57: I find them interesting and always try to grasp some new knowledge.
This was supposed to be a friendly reply and I hope that my limitations in English have not violated this intention
Take care
Nemo
Some people look at harmonic patterns and they trade every one, because they’ve back-tested, and they know historically that trading with certain RR should yield the result over time that they want. That’s a perfectly acceptable way to trade if you get the results you want.
Other people trade harmonics, but require a sense of context. The chart below shows a day ending with a candle getting rejected from a logical buy area after running stops and trapping traders from the previous days. At night when I analyze for the next day, I try to ask myself, what is the next days candle likely to look like and why? If you’re trading off of higher time frame charts like the 4H or 1H, would you rather see your harmonic set up completing as London is closing, or going into the start of the day? Not all patterns are created equally, and as traders it is beneficial to discuss the pros and cons.
I don’t think we need to overcomplicate things, but patterns occur as a result of price action, and when you understand how they work together, I think it gives an advantage.
My post does not deal with topic “Harmonic pattern” !!!
My point is to bring in some critical perspective around the topic Harmonic pattern.
My logic dictates that there must be retail traders who can prove through their trading results that their trading style works.
I do not have a monopoly on which trading style who is best.
Trading style that I personally recommend, where you will find a group of trading personalities who have proven / proves that they goes under category Professional retail trader.
Kozok flaming, Don Miller , Fxviper Jeff ,Steve patterson (seen his account history over skype )
Personally, I think also, this group also publishes the best educational material to a normal price.
All of them have a realistic approach to trading.
Lance beggs ,Al Brooks, Bob Vollman
None of them sell indicators or trying to drown you with fancy words how rich you can become …
[B]My rhetorical question, are there any Harmonic pattern traders who can demonstrate results over a longer periode .
My claim no they do not exist ,
[/B]
My contention , people that promotes the trading style harmonic pattern makes it only for selling expensive education courses or indicators.
I must say , i like the way torulf39 thinks because i myself don’t trade any one way. Through the years i have tried my methods and strategies and none of them work for you all the time. The world market is tooo complicated , one must be flexible feel the pulse of the market and have a large tools box where you can use the proper tool for the job. This take allot of time , because one need to go through the cycle of time or years , NO real short cutes. Have a great week-nd .
I will not corrupt this thread into a mentor thing, as it’s one of the better threads on BP (also a shout out to Nikita’s thread) but the market is a lot less complicated then one might think. Price seeks liquidity, and those who control price use it to profit. In fact, price always seeks liquidity. Chinese circuit breakers are only meant to confuse us. Any price action trader looking at the ES (S&P) last week knew what was going to happen. If it had not been the China thing, it would have been something else, because the market was seeking liquidity. You can write about various candle patterns and GDP and unemployment and Walking Dead spoilers, but at the end of the day, markets move with some predictability.
It is you who have brought mentors into the discussion, I note that all offers expensive courses and that there exists no results of harmonic trading traders …
H.M Gartley never included the Fibonacci relation in his original work and instead usedone-thirds and two-thirds of ratios*between the various swing moves. So Gartley pattern modified by Scott Carney and Larry Pesavento.
[B]Is this modification to the better I think they complicated thing to the worst .
[/B]
[B]The big question is what performance have Harmonic pattern
Compare with other pattern …!!!
[/B]
[B]Regarding to Thomas Bulkowski master of pattern
Harmonic pattern showing rather poor performance compare with other pattern.
So my rhetoric question why in heaven should you use lot of money and waste time to learn harmonic pattern .
So why not study top 10 best performance in up and down breakouts [/B]
Pattern up breakouts
High and tight flags
22%
21%
21%
Eve & Eve double bottom
9%
12%
13%
Scallop, ascending and inverted
11%
12%
13%
Rectangle Bottom
8%
11%
14%
Adam & Adam double bottom
7%
10%
12%
Adam & Eve double bottom
7%
10%
10%
Eve & Adam double bottom
7%
10%
14%
Falling wedge
8%
10%
9%
Rounded top
7%
10%
14%
Flag
8%
9%
7% Pattern: Down Breakouts 1 Month
Loss 2 Month
Loss 3 Month
Loss
Complex head-and-shoulders top
-8%
-10%
-10%
Head-and-shoulders top
-7%
-8%
-7%
Diamond top
-8%
-7%
-6%
Diamond bottom
-10%
-5%
-4%
Scallop, descending
-6%
-5%
-4%
Adam & Adam double top
-6%
-4%
-3%
Right-angled and descending broadening formation
-5%
-4%
0%
Rounded top
-6%
-4%
-4%
Scallop, descending and inverted
-4%
-4%
-4%
Triangle, descending
-5%
-4
-3%
I understand and accept what you say. At least it is your opinion and no one could hold you back in writing that down.
What I nevertheless must tell you that the way how you do this makes it hard for me to get your point - maybe this is the same for others, too.
So forum members im afraid mostly of you who have trying to read this post is complete Greece for you ,
Being less offending would help me to get behind it. You must accept that a lot of people being here in this forum are more or less able to differentiate between working and not working strategies, because they are not new to the game.
Assumed that “harmonic patterns” are a tool one need to understand it and then back- and forwardtest it in order to get an idea of the outcome. I don’t give a dime on what Thomas Bulkowski, or JS says about it. I want to learn it and than find out. This should be your approach also, because believing what other say is one of the big issues in this business.
Furthermore you dont need to pay thousands of dollars to learn what Larry Pesavento has to offer in his classes. You just need to buy the book, which is affordable for anyone of us I think. There you will find a lot of stuff, that JS is also teaching. So most likely you do neither need the JS classes. Great … you saved round about 15.000 bucks.
The difference between a successfull and a failing trader is not always a bad strategy.
The Turtles proved that the difference is often in the psychology of the trader. Do you always stick to your plan? Do you review and refine it, without overfitting it? Do you backtest it’s performance after you altered one of the parameters? Do you stick to your trade, although it has reached almost 80% of your profit target, or do you close it, because of the fear of giving away the profit you collected in the meanwhile … this list could be very long and makes often the difference between success and failure.
It’s good to have a lot of things in your personal toolbox. Patterns are without any doubt one of those tools and I believe that they are valueable. If you don’t … well great. No need to offend people who are trying to get some knowledge about an approach which seems to be promising.
Coming to your last post. Could you please provide us some more details about the patterns mentioned? Although I know some of them there are several that I hear/read the first time of. I’m keen to get more infos about them.
What are those percentages about? I wish that you share some of your personal experience in trading with us.
What is your trading style? Daytrading, swings, trendfollowing, scalping … which tools/strategy do you employ?
All information you need will you find in my posts in this thread .
Use Google , you have the names to get best quality education material , read my earlier thread
Typically German no fantasy ,ps love berlin ,promise my doughter to go crazy in charlottenburg
This is a harmonic thread, so I do feel badly getting too far from that. Scrolling up I see various candle patterns and percentages, and to be honest it’s just getting away from what is really happening in any market. Imagine that you controlled price in a market, and also saw automated orders at different price levels where people are willing to buy and sell at. You would manipulate price so that you could find sellers you would buy from before you drove price up, where you would find buyers you could sell to. That’s what this is all about. Harmonics are a way of finding patterns that a trader has back tested (each of us risking our own money should be doing this) to capitalize on the places where those who control price will look for orders.
The point is that harmonics are a bit of a distraction from what is happening, but that is OK because some people make them work, like TM. But when you start adding all of these other variables, there is an even greater risk of losing sight of what’s happening in the markets. Whether we call it S/R, S/D, Structure, or Order Flow, the big picture is that Institutions that can move price, do so, to activate orders so they can profit. There are many ways to take advantage of that, and Harmonics is one of those ways, but when you pile more pooh on top of the truth, you’re not going to see the truth more easily, you’ll just have a bigger pile of pooh. Support and Resistance (or whatever name you want) should be your foundation, with harmonics as a tool, not the other way around.
[i would rather upload the images to a site like imgur and then post them as you can have the option to copy and post the image location into a new tab to get a bigger image, …but when i go to print preview on babypips my images arn’t showing up like they usually do?, hence why i have had to upload them directly to babypips instead as attachments]
Here we have a D1 TMB gartley on EURAUD if we use the base price of the candels as our X, the .786 XA converges with the 1.000 CD
If we look at the H4 time frame we can spot a smaller TMB butterfly within this D1 gartley [IN GREEN], both are pointing to practically the same “D” point. Notice that if we start counting from the green gartleys “A” point there is what looks like a 5 wave structure trying to develop upwards [elliot wave], also notice the divergance after the 4th wave on the MACD [tell tell sign that a 5th wave is next]. at the moment the structure is 4 waves…
although hard to see, the pivot point “R1” lands ontop of the D point also
, you can also see a purple trendline, this is an 8 hour msrt line, if price manages to close below this line on the 8 hour timeframe it is a very good sign,
so far price has had a decent reaction to the “D” point. at the time of writing price has travelled 172 pips from the “D” point, and has gone back up a little bit [hopefully it will come down further] i have set my limit to 230 pips for this pattern, and i think this is a realistic target [based on experience]
as we know though, nothing is certain, ain’t nothing over till the fat lady sings. price could still come back up and stop me out … however hopefully with so much aditional convergance with this trade it will come through.
it was a H4 scott m carney gartley with an x on the 8sma [that’s how i traded it], i got around 75 pips …but it went up alot further
if you look on AUD/USD right now and use the same 8sma again for X [on H4] there is a scott m carney butterfly in progress. I did not take it though because i would like to see more converging factors, but at the time of writing it is looking like it might actually come through…
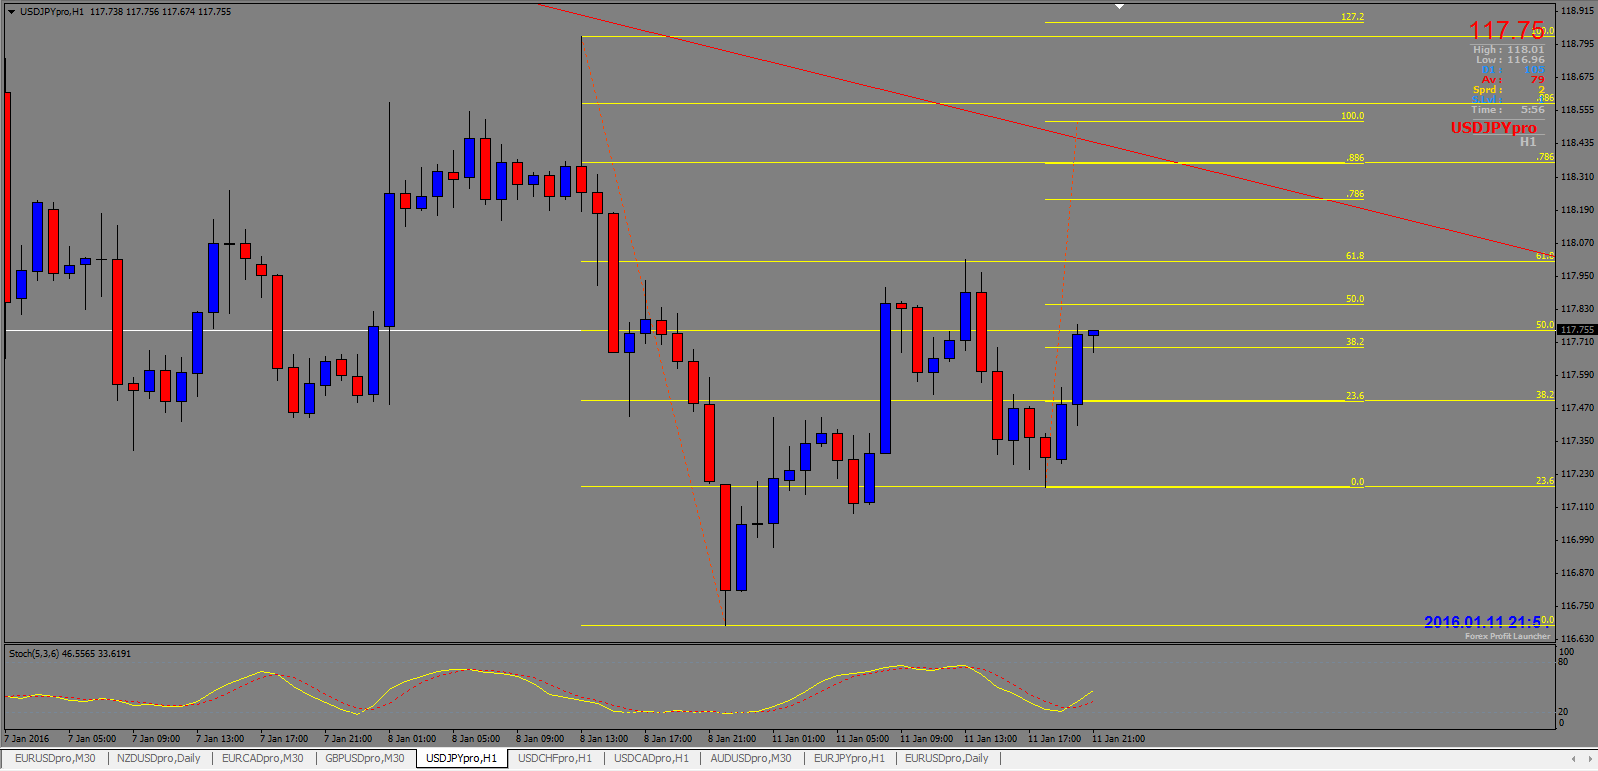
I like this Gartley. The 127 (which is what I use for entry) is supported by the .786 confluence, and there is significant structure up there. It’s in the same direction that the market has been moving in, and there is the 127 extension down below on the daily that has not been hit. Might be a good trade.
Hi Nemo,
I like your pattern buy I think it is drawn incorrectly. According to TMoneyBags, your fib retracement of B to A should be moved so that the the wick of C is on 0.00. This is how I think it should be drawn.
Hi Jusava,
thanks for your advice.
I read about TMBs approach but my pattern was indeed drawn the “classical” way. Just as described in the books. Due to a lack of backtestresults with the advanced techique of TMBs I tend to stick to Pesavento
I don’t understand some of TMBs patterns, e.g. when XA leg is very big and AB retracement is very low. I thought those are invalid Gartleys, but obviously they do work.
I blame my missing knowledge, but I will do my homework and hopefully will have the time to do some backtesting on them.
By now I try to see the basic patterns and believe me it’s very hard for me. Hopefully contributions value will grow with time.
Happy Pips …
Nemo


