Daily Market Analysis By FXOpen

Market Analysis: GBP/USD Rockets Higher While EUR/GBP Slips

GBP/USD is gaining pace above the 1.3220 resistance. EUR/GBP declined and is now consolidating losses above the 0.8500 region.

Important Takeaways for GBP/USD and EUR/GBP Analysis Today

  • The British Pound is attempting a fresh increase above 1.3220.
  • There is a key bullish trend line forming with support near 1.3245 on the hourly chart of GBP/USD at FXOpen.
  • EUR/GBP is trading in a bearish zone below the 0.8630 pivot level.
  • There is a connecting bearish trend line forming with resistance near 0.8570 on the hourly chart at FXOpen.

GBP/USD Technical Analysis
On the hourly chart of GBP/USD at FXOpen, the pair remained well-bid above the 1.2850 level. The British Pound started a decent increase above the 1.3000 zone against the US Dollar.

The bulls were able to push the pair above the 50-hour simple moving average and 1.3150. The pair even climbed above 1.3200 and traded as high as 1.3263. It is now consolidating gains and trading well above the 23.6% Fib retracement level of the upward move from the 1.3030 swing low to the 1.3263 high.

TO VIEW THE FULL ANALYSIS, VISIT FXOPEN BLOG

Disclaimer: This article represents the opinion of the Companies operating under the FXOpen brand only (excluding FXOpen EU). It is not to be construed as an offer, solicitation, or recommendation with respect to products and services provided by the Companies operating under the FXOpen brand, nor is it to be considered financial advice.

How to Trade with Hybrid Strategies

In today’s intricate financial landscape, traders have an array of strategies at their disposal. This article delves into the core methods—technical, fundamental, and algorithmic/quantitative analysis—and introduces the concept of hybrid strategies. Learn how combining these techniques can offer a balanced approach to trading, enhancing decision-making and risk mitigation.

Creating Hybrid Trading Strategies

In the world of trading, there are primarily two schools of thought: fundamental analysis (FA) and technical analysis (TA). Fundamental analysis delves deep into economic indicators such as GDP, inflation rates, and earnings reports, aiming to assess an asset’s intrinsic value.

On the other hand, technical analysis focuses on studying past price movements and trading volumes, often through charts, to predict future activity. You can find all the charts and tools necessary for technical trading strategies over in FXOpen’s free TickTrader platform.

While both approaches have their merits, a growing number of traders are blending these methodologies to create what are known as hybrid strategies.

VIEW FULL ARTICLE VISIT - FXOpen Blog…

Disclaimer: This article represents the opinion of the Companies operating under the FXOpen brand only. It is not to be construed as an offer, solicitation, or recommendation with respect to products and services provided by the Companies operating under the FXOpen brand, nor is it to be considered financial advice.

Chipmaker Stocks Declines

According to the charts, semiconductor stocks underperformed the broader equity market yesterday. While the S&P 500 index (US SPX 500 mini on FXOpen) fell by around 2.2%, the drop was far steeper across the chip sector:

→ The bullish semiconductor ETF (SOXL) declined by 15%;
→ Nvidia (NVDA) shares fell by 6.9%;
→ Advanced Micro Devices (AMD) dropped by 7.3%.

In other words, chipmaker stocks dragged down the broader market, raising concerns ahead of the upcoming earnings season.

Why Are Chip Stocks Falling?

The decline stems from corporate assessments of how the escalating global trade war and new tariffs could impact future performance.

According to media reports:
→ AMD expects to face tariffs of up to $800 million on exports to China;
→ For Nvidia, similar levies could exceed $5 billion.
Technical Analysis – Nvidia (NVDA)

The price continues to fluctuate within a downward channel, previously identified in our analysis:

TO VIEW THE FULL ANALYSIS, VISIT FXOPEN BLOG

Disclaimer: This article represents the opinion of the Companies operating under the FXOpen brand only (excluding FXOpen EU). It is not to be construed as an offer, solicitation, or recommendation with respect to products and services provided by the Companies operating under the FXOpen brand, nor is it to be considered financial advice.

Gold Price Surpasses $3,300 for the First Time in History

Just six days ago, we highlighted the historic breakthrough of the $3,200 level for the first time. Now, as the XAU/USD chart shows today, the price of an ounce of gold on global exchanges is fluctuating above $3,300.

Bullish sentiment is being driven by a weakening US dollar and rising trade tensions between the United States and China, which are boosting gold’s appeal as a safe-haven asset. In response to these developments, Goldman Sachs analysts have raised their year-end 2025 forecast to $3,700.

However, technical analysis is beginning to flash some bearish signals.

Technical Analysis of XAU/USD

Using the latest data, we have drawn an ascending channel on the hourly chart that more accurately reflects price action since 8 April. Initially, the price moved within a narrow range, but after breaking the S-line, it found support (indicated by an arrow) at the lower boundary of the channel.

TO VIEW THE FULL ANALYSIS, VISIT FXOPEN BLOG

Disclaimer: This article represents the opinion of the Companies operating under the FXOpen brand only (excluding FXOpen EU). It is not to be construed as an offer, solicitation, or recommendation with respect to products and services provided by the Companies operating under the FXOpen brand, nor is it to be considered financial advice.

The Pound and Euro Reach New Yearly Highs

Despite global economic instability and Donald Trump’s tariff policy, the EUR/USD and GBP/USD currency pairs are demonstrating upward momentum, reaching new yearly highs.

Today, market participants are focused on the European Central Bank meeting, where significant statements regarding monetary policy are expected. Yesterday, Federal Reserve Chair Jerome Powell highlighted the impact of the tariff policy on the US economy, which added volatility to the currency markets. These events could significantly influence the further movement of major currency pairs, setting a new trajectory for their quotes.

EUR/USD

Following sharp growth last week, EUR/USD has entered a sideways phase between 1.1480–1.1260. If the 1.1260–1.1240 levels continue to act as support, the pair may accumulate potential to resume its upward movement towards the 1.1700–1.1600 range. If 1.1240 is broken to the downside, the downward correction may intensify towards 1.1100–1.1000.

TO VIEW THE FULL ANALYSIS, VISIT FXOPEN BLOG

Disclaimer: This article represents the opinion of the Companies operating under the FXOpen brand only (excluding FXOpen EU). It is not to be construed as an offer, solicitation, or recommendation with respect to products and services provided by the Companies operating under the FXOpen brand, nor is it to be considered financial advice.

Ultra-Fast Scalping Strategies in Forex

Scalping is a high-speed trading strategy that targets quick profits from small price movements. It’s a method that appeals to those who want a hands-on, immediate trading experience. This article delves into three of the best 1-minute scalping strategies: Heikin-Ashi Pullback, RSI Extremes, and Stochastic Oscillator Quick Signal, explaining their nuances and applications in a trading environment.

What Is Scalping?

Scalping is a trading strategy focused on capturing small price movements in financial markets. Traders employing this tactic aim to gain several pips – tiny increments in price – from each trade, often executing dozens or even hundreds of trades in a single day. Due to the high frequency of trades, transaction costs and speed are significant considerations.

VIEW FULL ARTICLE VISIT - FXOpen Blog…

Disclaimer: This article represents the opinion of the Companies operating under the FXOpen brand only. It is not to be construed as an offer, solicitation, or recommendation with respect to products and services provided by the Companies operating under the FXOpen brand, nor is it to be considered financial advice.

Stock Markets Consolidate Ahead of the Holidays

A lull is expected on the financial markets today due to a shortened trading week related to the Easter holiday celebrations.

It is reasonable to assume that traders will get a “breather” after a news-heavy April, which caused a volatile “shakeout” in the stock markets.

US Stock Markets

On Wednesday, Federal Reserve Chair Jerome Powell was both cautious and somewhat aggressive in his forecasts regarding US monetary policy, stating that Trump’s tariffs could delay the achievement of inflation targets.

In response, US President Donald Trump accused Powell of “playing politics”, hinting at his possible dismissal.

European Stock Markets

On Thursday, the ECB cut interest rates for the seventh time in the past 12 months, and European Central Bank President Christine Lagarde left the door open for further easing.

Analysts had expected a rate cut from 2.65% to 2.40%, so the financial markets reacted relatively calmly to the ECB’s decision.

Technical Analysis of the S&P 500 Chart (US SPX 500 mini on FXOpen)

On the charts of European and US stock indices today, a narrowing triangle pattern is forming, indicating a balance between supply and demand — in other words, price is more efficiently factoring in all influencing elements.

TO VIEW THE FULL ANALYSIS, VISIT FXOPEN BLOG

Disclaimer: This article represents the opinion of the Companies operating under the FXOpen brand only (excluding FXOpen EU). It is not to be construed as an offer, solicitation, or recommendation with respect to products and services provided by the Companies operating under the FXOpen brand, nor is it to be considered financial advice.

UnitedHealth (UNH) Share Price Plummets

UnitedHealth shares crashed by nearly 23% yesterday after the healthcare giant reported weaker-than-expected Q1 2025 results:

→ Earnings per share: actual = $7.20, expected = $7.29
→ Revenue: actual = $109.5bn, expected = $111.5bn

Technical Analysis of UNH Share Chart

As far back as a year ago, we highlighted key support around the $450 level. Yesterday’s negative news caused this support to once again demonstrate its strength by holding back further decline — but will it hold?

TO VIEW THE FULL ANALYSIS, VISIT FXOPEN BLOG

Disclaimer: This article represents the opinion of the Companies operating under the FXOpen brand only (excluding FXOpen EU). It is not to be construed as an offer, solicitation, or recommendation with respect to products and services provided by the Companies operating under the FXOpen brand, nor is it to be considered financial advice.

Market Analysis Techniques for Traders

Navigating the financial markets demands a strong toolkit of analysis techniques. This comprehensive article introduces traders to key market analysis methods, ranging from fundamental and technical analysis to more specialised approaches like price action and quantitative methods.

You can pair your learning with FXOpen’s free TickTrader platform to gain the deepest understanding of these techniques. There, you will find the price charts, drawing tools, and indicators necessary for many of these market analysis methods.

VIEW FULL ARTICLE VISIT - FXOpen Blog…

Disclaimer: This article represents the opinion of the Companies operating under the FXOpen brand only. It is not to be construed as an offer, solicitation, or recommendation with respect to products and services provided by the Companies operating under the FXOpen brand, nor is it to be considered financial advice.

Market Analysis: Gold Extends Record Run, WTI Crude Oil Rebound in Tandem

Gold price started a fresh surge above the $3,250 resistance level. WTI Crude oil prices climbed higher above $60.00 and might extend gains.

Important Takeaways for Gold and WTI Crude Oil Prices Analysis Today

  • Gold price started a fresh surge and traded to a new record high at $3,384 against the US Dollar.
  • A key bullish trend line is forming with support at $3,322 on the hourly chart of gold at FXOpen.
  • WTI Crude oil prices started a recovery wave above the $60.00 and $61.50 resistance levels.
  • There was a break below a connecting bullish trend line with support at $63.00 on the hourly chart of XTI/USD at FXOpen.

Gold Price Technical Analysis

On the hourly chart of Gold at FXOpen, the price formed a base near the $3,200 zone. The price started a steady increase above the $3,250 and $3,280 resistance levels.

There was a decent move above the 50-hour simple moving average and $3,350. The bulls pushed the price above the $3,380 resistance zone. A new record high was formed near $3,384 and the price is now consolidating gains.

TO VIEW THE FULL ANALYSIS, VISIT FXOPEN BLOG

Disclaimer: This article represents the opinion of the Companies operating under the FXOpen brand only (excluding FXOpen EU). It is not to be construed as an offer, solicitation, or recommendation with respect to products and services provided by the Companies operating under the FXOpen brand, nor is it to be considered financial advice.

Coca-Cola Company (KO) Shares Trade Near All-Time High

Stock market charts indicate that from the start of last week’s trading through to its close:

→ The S&P 500 Index (US SPX 500 mini on FXOpen) declined by approximately 3%;
→ Pepsico (PEP) shares dropped by more than 1%;
→ Coca-Cola Company (KO) shares rose by around 2.4%.

Why Aren’t Coca-Cola Shares Falling?

The relatively strong performance of Coca-Cola (KO) shares compared to the broader market and its main competitor may be attributed to the fact that Coca-Cola operates a concentrate production facility in Atlanta, USA. In contrast, Pepsico’s equivalent production is based in Ireland. This gives Coca-Cola a potential advantage under the tariff policies pursued by the Trump administration.

Incidentally, according to media reports, Diet Coke is the favourite drink of the US President.

TO VIEW THE FULL ANALYSIS, VISIT FXOPEN BLOG

Disclaimer: This article represents the opinion of the Companies operating under the FXOpen brand only (excluding FXOpen EU). It is not to be construed as an offer, solicitation, or recommendation with respect to products and services provided by the Companies operating under the FXOpen brand, nor is it to be considered financial advice.

Unveiling Market Sentiment in Trading

Understanding the market’s pulse can offer traders a significant edge. The market is driven by human psychology, and by grasping the prevailing mood, traders can position themselves more effectively.

This article will delve into various methods and indicators that offer insights into market sentiment analysis trading, from media scanning and expert opinions to economic and market-specific indicators.

What Is Market Sentiment?

Market sentiment refers to the prevailing mood or emotional tone that traders and investors exhibit toward a specific financial asset or the market as a whole. It serves as a qualitative measure that captures collective attitudes toward market conditions — optimistic, pessimistic, or neutral.

This sentiment is often influenced by various factors such as economic indicators, news, and trader psychology. Understanding market sentiment is crucial because it can help anticipate market trends, offering insights that purely quantitative indicators sometimes overlook.

VIEW FULL ARTICLE VISIT - FXOpen Blog…

Disclaimer: This article represents the opinion of the Companies operating under the FXOpen brand only. It is not to be construed as an offer, solicitation, or recommendation with respect to products and services provided by the Companies operating under the FXOpen brand, nor is it to be considered financial advice.

USD/JPY Analysis: Exchange Rate Falls Below 140 Yen per Dollar Today

As shown on the USD/JPY chart today, the exchange rate between the US dollar and Japanese yen has fallen below 140 yen per dollar – marking the first time this has occurred in 2025. Since the beginning of the year, the rate has dropped by approximately 11%.

Among the main driving factors is the White House’s tariff policy, which has triggered a sell-off in US government bonds and a weakening of the dollar. One of the more recent developments includes the release of the Consumer Price Index report by the Bank of Japan, which revealed that the CPI remained steady at 2.2%, despite analysts (according to ForexFactory) forecasting a rise to 2.4%.

It’s possible that, due to the lack of inflationary pressure in Japan, the yen is in a relatively stronger position compared to the US currency, where concerns persist that trade wars and Trump’s push for lower interest rates may lead to a spike in inflation and a devaluation of the dollar.

TO VIEW THE FULL ANALYSIS, VISIT FXOPEN BLOG

Disclaimer: This article represents the opinion of the Companies operating under the FXOpen brand only (excluding FXOpen EU). It is not to be construed as an offer, solicitation, or recommendation with respect to products and services provided by the Companies operating under the FXOpen brand, nor is it to be considered financial advice.

Tesla Shares (TSLA) Drop Nearly 6% Ahead of Quarterly Report

On Monday, Tesla’s share price fell by almost 6%, dipping below $230 and hovering near its yearly low. Since the beginning of 2025, Tesla shares have lost approximately 44% in value, marking their worst quarter since 2022.

Why Is TSLA Falling?

There is no shortage of investor concerns, including (as reported by various media outlets):

→ Elon Musk’s involvement with the Trump administration, which is said to be distracting him from focusing on Tesla, particularly as signs emerge of slowing progress in the development of robotaxis and autonomous driving technology.

→ A decline in demand — both for the Cybertruck model specifically and the product line in general — especially amid protests and boycotts across the US and Europe. Tesla previously reported 336,681 vehicle deliveries in Q1, down 13% compared to the same period last year.

→ Increased competition from Chinese carmakers, uncertainty around international trade tariffs, and other contributing factors.

According to The Wall Street Journal, analysts at Barclays and Oppenheimer have voiced concerns about “brand dilution” and weakness in China, while Dan Ives of Wedbush is hopeful for an “inspirational vision” from Elon Musk.

TO VIEW THE FULL ANALYSIS, VISIT FXOPEN BLOG

Disclaimer: This article represents the opinion of the Companies operating under the FXOpen brand only (excluding FXOpen EU). It is not to be construed as an offer, solicitation, or recommendation with respect to products and services provided by the Companies operating under the FXOpen brand, nor is it to be considered financial advice.

Creating a Balanced Investment Portfolio

In the vast realm of trading, where platforms like FXOpen play a pivotal role, strategy and skill stand paramount. As the age-old adage goes, ‘Don’t put all your eggs in one basket.’ In the context of trading, this underscores the significance of diversification. Enter the concept of a balanced investment portfolio - an excellent balanced portfolio example, which emerges as an oasis of hope amidst the unpredictable dunes of market volatility.

Understanding the Importance of a Balanced Investment Portfolio

To achieve a balanced investment portfolio, it’s crucial to consider the balance of individual components, especially forex, CFDs, stocks, and bonds. For example, a stock portfolio balance refers to the proportion of stocks in relation to other investment types. This balance is pivotal, as stocks often carry higher risks but also higher potential rewards. By understanding their own risk tolerance and learning how to balance portfolio assets effectively, traders can determine the ideal portfolio balance that meets their specific objectives.

VIEW FULL ANALYSIS VISIT - FXOpen Blog…

Disclaimer: This article represents the opinion of the Companies operating under the FXOpen brand only. It is not to be construed as an offer, solicitation, or recommendation with respect to products and services provided by the Companies operating under the FXOpen brand, nor is it to be considered financial advice.

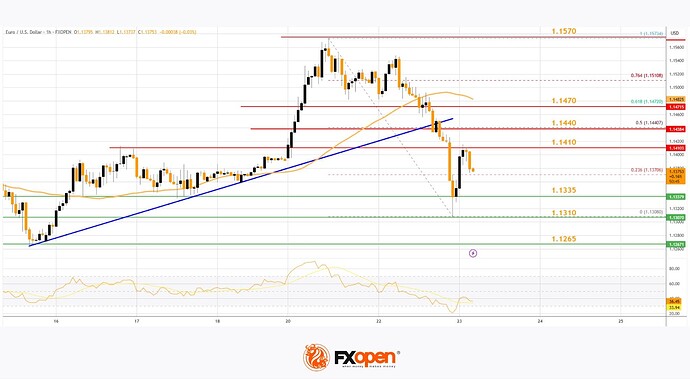
Market Analysis: EUR/USD Dips From Highs, USD/JPY Eyes Fresh Increase

EUR/USD declined from the 1.1570 resistance and traded below 1.1470. USD/JPY is rising and might gain pace above the 142.45 resistance.

Important Takeaways for EUR/USD and USD/JPY Analysis Today

  • The Euro started a fresh decline after a strong surge above the 1.1500 zone.
  • There was a break below a key bullish trend line with support at 1.1440 on the hourly chart of EUR/USD at FXOpen.
  • USD/JPY climbed higher above the 141.00 and 141.65 levels.
  • There was a break above a connecting bearish trend line with resistance at 141.20 on the hourly chart at FXOpen.

EUR/USD Technical Analysis

On the hourly chart of EUR/USD at FXOpen, the pair rallied above the 1.1500 resistance zone before the bears appeared. The Euro started a fresh decline and traded below the 1.1500 support zone against the US Dollar.

There was a break below a key bullish trend line with support at 1.1440. The pair declined below 1.1410 and tested the 1.1310 zone. A low was formed near 1.1308 and the pair started a consolidation phase. There was a minor recovery wave above the 1.1370 level.

The pair climbed above the 23.6% Fib retracement level of the downward move from the 1.1573 swing high to the 1.1308 low. EUR/USD is now trading below 1.1440 and the 50-hour simple moving average.

On the upside, the pair is now facing resistance near the 1.1410 level. The next key resistance is at 1.1440 and the 50% Fib retracement level of the downward move from the 1.1573 swing high to the 1.1308 low.

TO VIEW THE FULL ANALYSIS, VISIT FXOPEN BLOG

Disclaimer: This article represents the opinion of the Companies operating under the FXOpen brand only (excluding FXOpen EU). It is not to be construed as an offer, solicitation, or recommendation with respect to products and services provided by the Companies operating under the FXOpen brand, nor is it to be considered financial advice.

Market Volatility Continues to Rise

Amid global economic instability and escalating tariff tensions, the EUR/USD and GBP/USD currency pairs are showing strong growth. Following statements by Donald Trump regarding the potential dismissal of Federal Reserve Chair Jerome Powell, pressure on the US dollar is intensifying. This is creating favourable conditions for the strengthening of the euro, the Japanese yen, and the British pound.

President Trump has repeatedly criticised Jerome Powell’s approach to monetary policy, accusing him of excessive caution and a lack of flexibility in cutting interest rates. According to the White House administration, the Fed’s current stance hinders economic growth and weakens the dollar’s position in global markets. These remarks are causing concern among investors and increasing volatility in currency markets, supporting the rise of other currencies against the dollar.

GBP/USD


At the start of the week, GBP/USD buyers managed to push the pair to new yearly highs, testing the key resistance level at 1.3400. The price briefly traded above 1.3400, but a sharp pullback from 1.3420 allowed sellers to form a bearish “dark cloud cover” pattern. Technical analysis of GBP/USD suggests a potential downward correction following the recent rapid rise. Should the pair consolidate below 1.3200, the decline could extend towards the 1.3160–1.3100 range.

TO VIEW THE FULL ANALYSIS, VISIT FXOPEN BLOG

Disclaimer: This article represents the opinion of the Companies operating under the FXOpen brand only (excluding FXOpen EU). It is not to be construed as an offer, solicitation, or recommendation with respect to products and services provided by the Companies operating under the FXOpen brand, nor is it to be considered financial advice.

Alphabet (GOOGL) Shares Hover Near Psychological Level Ahead of Earnings Report

On 31 March, we noted that bearish sentiment could push Alphabet’s (GOOGL) share price towards the psychological level of $150. As the current price chart suggests, GOOGL is now trading close to that very level.

Moreover, the price is approximately equidistant from the recent highs and lows (marked A and B), which may be interpreted as a sign of balanced supply and demand — and a wait-and-see stance from market participants ahead of Alphabet’s Q1 earnings release (scheduled for tomorrow, 24 April).

Awaiting the GOOGL Earnings Report

With the Nasdaq 100 index (US Tech 100 mini on FXOpen) having fallen by around 13.5% since the beginning of the year, investors are approaching tech earnings with caution. According to Barron’s, three key themes are expected to dominate the narrative:

→ management forecasts amid continued uncertainty around the White House’s tariff policy;
→ plans for major capital investment in AI-related infrastructure;
→ signs of softening consumer demand.

Given the current climate of uncertainty, Alphabet’s earnings report could prove particularly influential — serving as a benchmark for shaping market expectations ahead of other major tech company reports.

TO VIEW THE FULL ANALYSIS, VISIT FXOPEN BLOG

Disclaimer: This article represents the opinion of the Companies operating under the FXOpen brand only (excluding FXOpen EU). It is not to be construed as an offer, solicitation, or recommendation with respect to products and services provided by the Companies operating under the FXOpen brand, nor is it to be considered financial advice.

Gold Price Plunges After Climbing to $3,500 for the First Time

As the XAU/USD chart shows:
→ Yesterday, the spot gold price stopped just a few cents short of the key psychological level of $3,500 (and even exceeded it on the futures market);
→ But this morning, an ounce is trading around $3,300, having dropped aggressively by more than 5%.

Why Did Gold Suddenly Drop?

The sharp decline followed a shift in rhetoric from President Trump. According to Reuters:
→ The US President backed away from threats to dismiss Federal Reserve Chair Jerome Powell;
→ He also signalled a more moderate stance on tariffs against China.

Market participants interpreted this as a reason to take profits on long positions, as the softened tone from the White House reduced demand for safe-haven assets. As a result, gold collapsed from its historic high, while the US dollar index rebounded from multi-month lows.

TO VIEW THE FULL ANALYSIS, VISIT FXOPEN BLOG

Disclaimer: This article represents the opinion of the Companies operating under the FXOpen brand only (excluding FXOpen EU). It is not to be construed as an offer, solicitation, or recommendation with respect to products and services provided by the Companies operating under the FXOpen brand, nor is it to be considered financial advice.

Algorithmic Trading Overview

Algorithmic trading is an essential component in today’s financial markets, automating trading to improve efficiency and profitability. This article explores the intricacies of algorithmic trading, from how it works to its benefits and drawbacks, providing a comprehensive overview for traders.

What Is Algorithmic Trading?

Algorithmic trading uses computer programs to carry out trades in financial markets. It offers a modern approach that combines quantitative analysis, programming, and market expertise. Essentially, it automates the trading process, allowing for pre-defined rules and conditions to trigger buying or selling actions. While the concept may sound complex, its core function is to improve trading efficiency and potentially enhance profitability. Moreover, its utility extends across various asset classes, from equities and commodities to forex and derivatives.

Both individual and institutional traders employ algorithmic trading to capitalise on market opportunities that may unfold too quickly for human traders to seize.

VIEW FULL ARTICLE VISIT - FXOpen Blog…

Disclaimer: This article represents the opinion of the Companies operating under the FXOpen brand only. It is not to be construed as an offer, solicitation, or recommendation with respect to products and services provided by the Companies operating under the FXOpen brand, nor is it to be considered financial advice.