Main market movements on August 19
19.08.2020
The sentiment is indeed risk-on today! S&P 500 surged to the all-time high, and EUR/USD jumped to levels unseen since May of 2018. Let’s have a closer look.
Fundamentals
Joe Biden, the candidate for the US president, claimed that there is a strong “desire” between Democrats and Republicans to reach a deal over the next fiscal stimulus package soon. Actually, he announced the amount a bit smaller than most expected – 500 billion dollars. Nevertheless, the upcoming agreement itself has improved the market sentiment.
US-China trade talks have been postponed. White House haven’t yet announced the next date of the Sino-American meeting over the trade agreement. Market participants are waiting for next movements.
All eyes today on the FOMC meeting minutes and OPEC gathering.
Watch our daily forex trading plan!
Technical tips
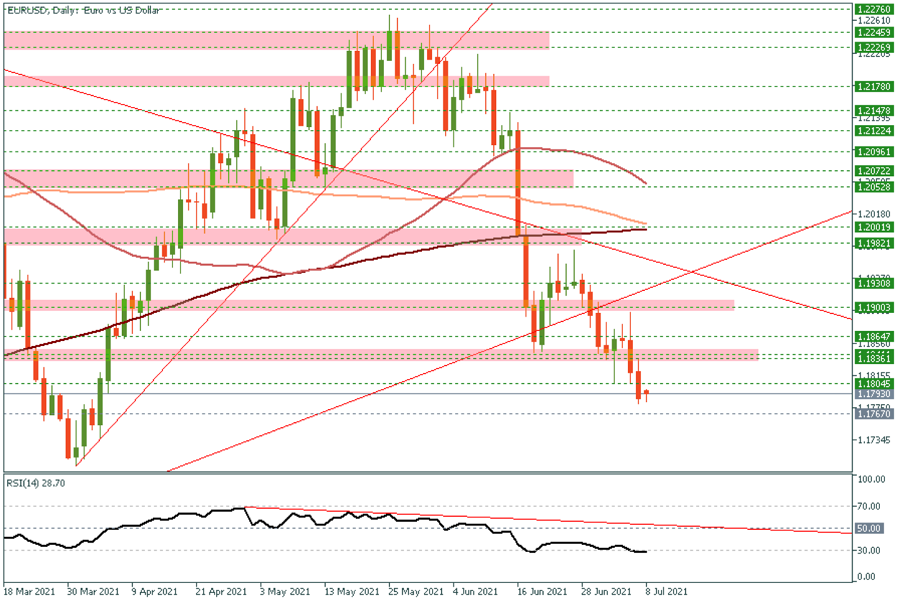
EUR/USD
The most traded pair has approached the resistance at 1.1950. If it breaks it through, it may surge to the next key psychological mark at 1.2000. Otherwise, if it falls below the 1.9000, it may fall even deeper to the low of August 17 at 1.1835.
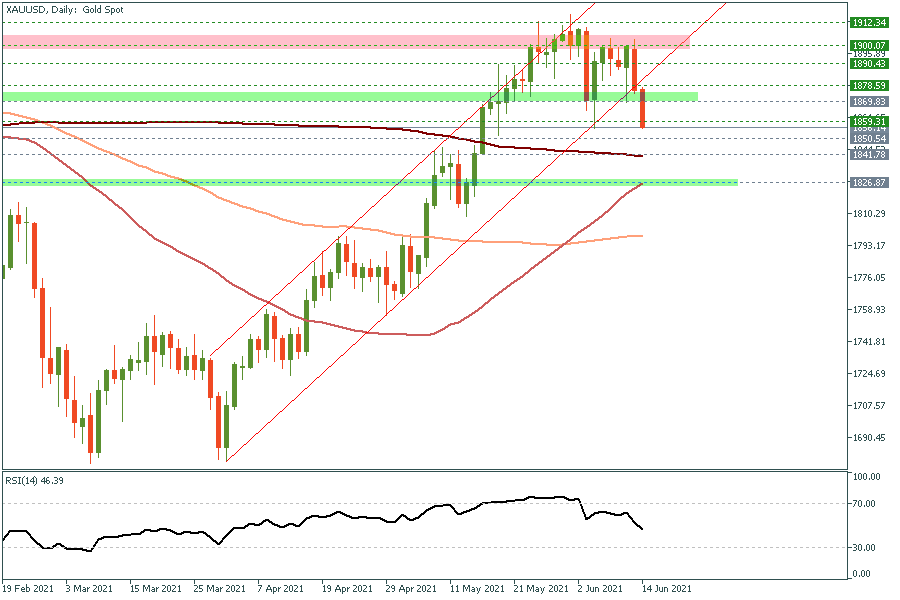
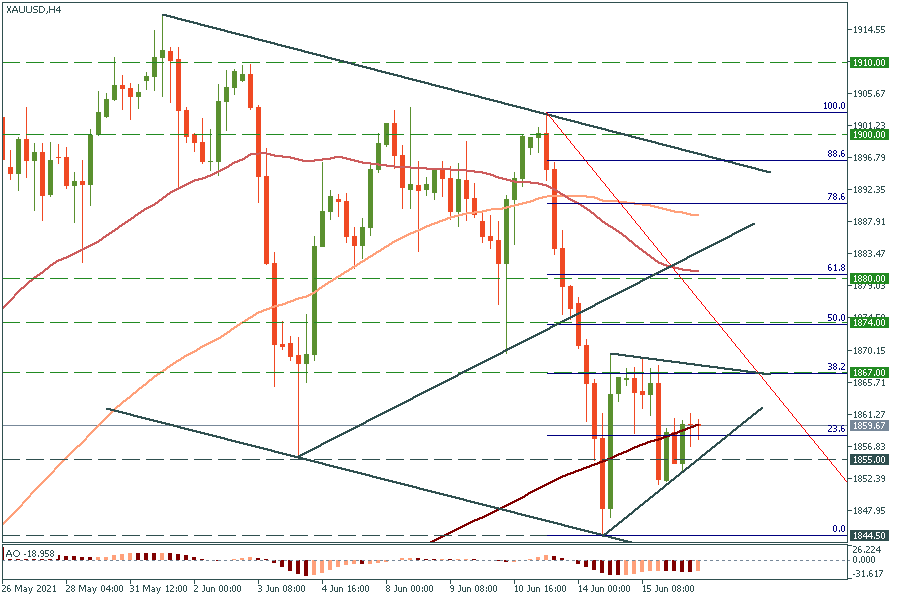
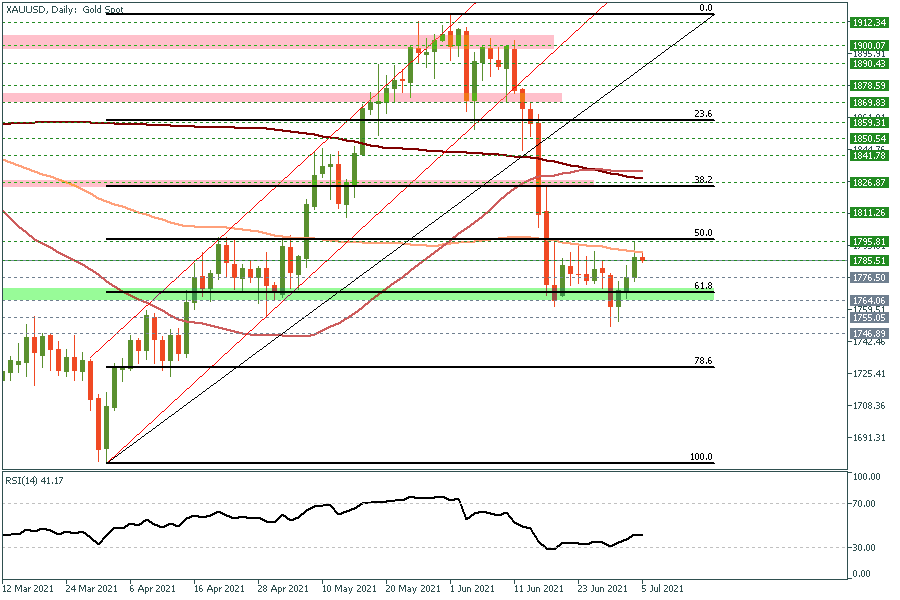
Gold
XAU/USD has contracted after the move above the key psychological level of $2 000. It may be just a natural short sell-of ahead of the further rally up. If it crosses the resistance at $2 010, it may surge to the next one at the high of August 7 at $2 035. On the flip side, if it falls below the support at $1 965, it may fall even deeper to $1 940.
AUD/USD
AUD/USD has reached the 200 moving average on the weekly chart. It’s quite a strong resistance, therefore it’s likely to bounce off. Nevertheless, if it manages to cross it, it will surge to 0.7300. In opposite, the move below 0.7130 may push the price even lower to the key support at 0.7000.
Oil
There is an important event for the oil market today: OPEC meeting. Follow it as it will add some volatility to the oil market. Let’s look at the WTI chart. If the price rises above the yesterday high at $42.85, it will open doors towards the high of August 5 at $43.20. On the contrary, if it breaks down the support at $42.25, it will fall to $41.90.
Follow further news:
OPEC meeting will be hold during the day!
The detailed report of the last FOMC statement will be out at 21:00 MT time! Stay tuned!
Check the economic calendar