Last week I pointed out the price could reach $1.20800 level and bounce back to $1.21793.
The price reached $1.20800 and bounced on Monday back up.
For the next week I am waiting for the price to make a move.
If the price closes on a daily basis above $1.21793 I am expecting to reach $1.22700 level where it could find resistance.
This week the price has made a bounce down to the first support at $1.20800.
The price took three days to reach the support which means bulls were strong enough to hold the price on the upper side.
In the next week I am expecting the price to break out fromt this small range.
If that happens and the price closes above $1.21793 on a daily basis the price will move towards the $1.22845 level.
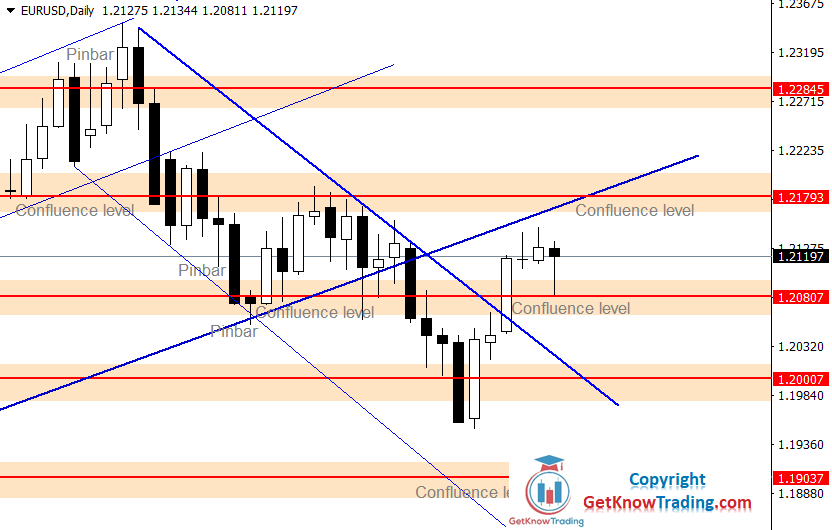
The market has changed its direction and price managed to break below uptrend channel.
The price has broken even below first support $1.20000 which did not show too much strength.
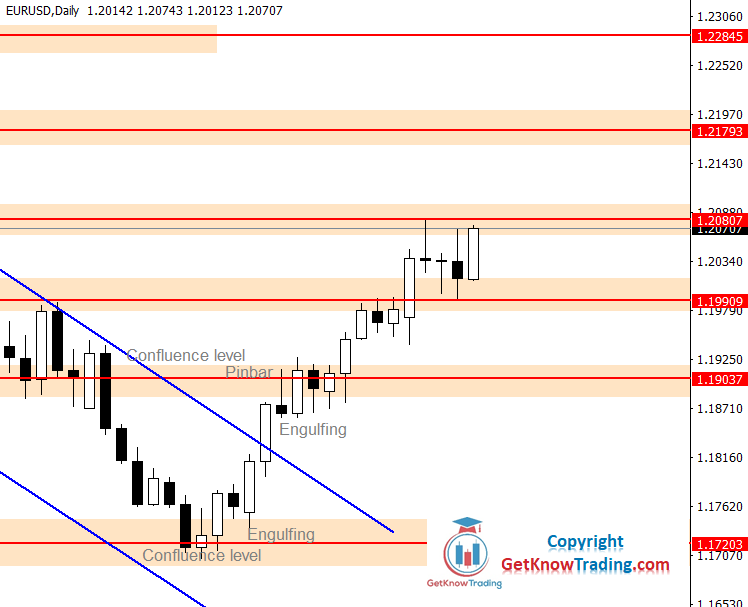
The price could find resistance at the confluence of resistance around $1.20800.
From there the price could move down to $1.20000 to try breaking again down.
The price managed to return back into area between $1.20800 and $1.21793 leves.
It is an area where the price has been around since December.
In the next week I will wait for the price to define where it will move for the next few weeks.
If the price close above $1.21793 level I will look for bullish signals on retrace.
1 Like
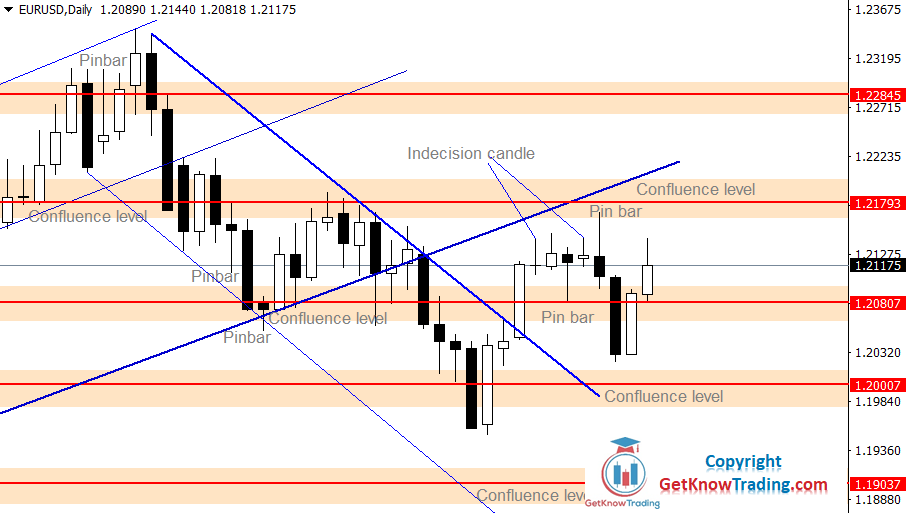
This week has shown indecision in the market where the first few days the price did not show clean direction.
With the support of bullish traders the price has changed the direction and ended the week above $1.20800.
If the price could close above the $1.21280 price it would mean the buyers have succeeded to break above the wall that is preventing the price from moving up.
The price has managed to break higher this week, but the break was short lasting.
In the previous week analysis I have said that if the price manages to break above $1.21280 we could see it moving higher
What I am looking now is for a bullish price action signal on the $1.20800 support level that will prevent the price from moving down and which will make a base for future move up.
Strong selling pressure on the $1.21793 level shows me that it is an area where bears are not allowing the price easily to break above.
We can see the price has reached $1.20000 on Tuesday and made a retrace which was just bears getting out and cashing profits.
The price could find a support at $1.19000 level which will allow the price to move up.
Current market formation does not look so bullish so I am more inclined to sell the pair on the retrace at around $1.20800 and $1.20000.
The pair is in the indecision area because strong support $1.19000 has held the price from moving below and $1.20000 has held the price from moving up.
If the price comes back again to $1.20000 and makes a bearish price action signal it will be a sign the price will move down below $1.19000 support.
That will open the road to $1.17000 which is the lower end of the previous range area from the end of the last year.
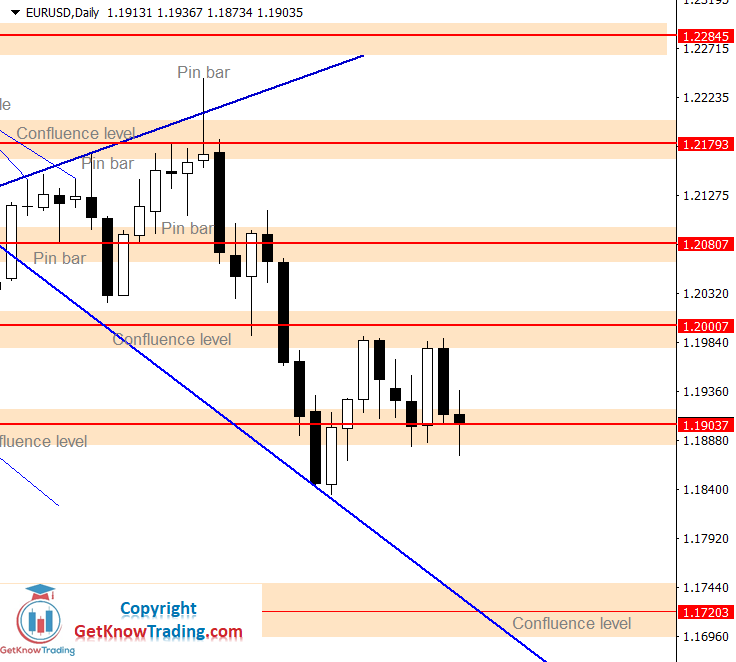
What we can see from the start of the week is that the price has moved to $1.19037 and from there reversed back up next to resistance level at $1.20000.
From there the price returned back down and ended the week with the close right on the support level.
I am still bearish oriented because the price is returning back to support level at $1.19037. It means the selling pressure is strong and eventually will break down.
On Tuesday the price has strongly broken below $1.19000 which was a sign of bears strength.
$1.17000 is lower end of the old range area so I am expecting to see the price first reaching $1.17500 and then reversing back up to around $1.19000.
This could be a nice opportunity to catch the selling wave down to $1.17000.
1 Like
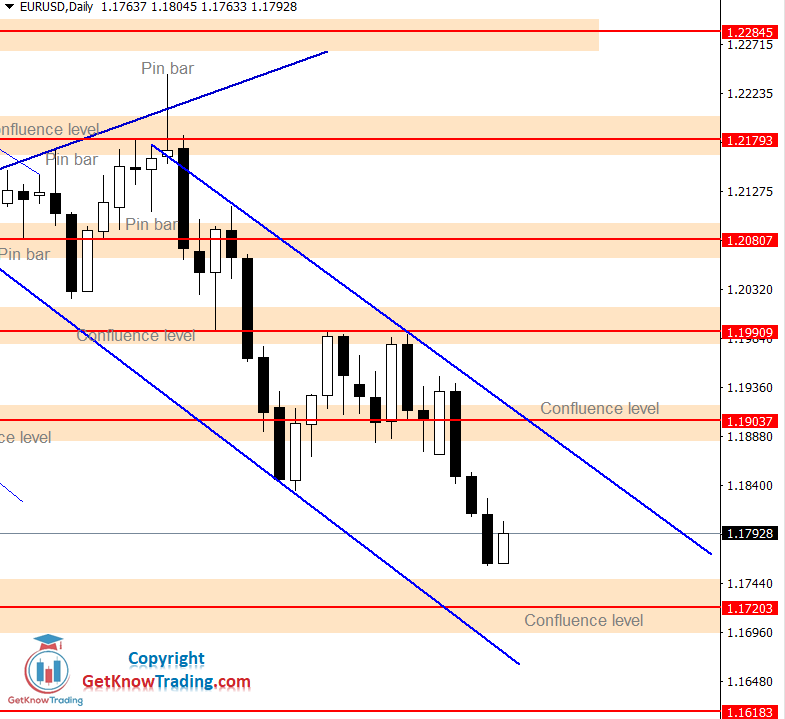
Strong selling pressure pushed the price down to $1.17203 support level where the minimum price $1.17030 was reached.
It will not be too easy to break below $1.17000 support, so I am expecting the price to reach $1.18400 which is the level that previous bullish candles has reached after hitting $1.17200 support.
Looking on the weekly chart it looks like it is ready to move down to reach $1.16183 support level.
The price reverse happened and the $1.18400 was reached as was said in the previous weekly analysis.
But, the price managed to get out from the descending channel and reach major resistance at $1.19000.
f the price ends next week above $1.19000 then it will move market sentiment to slightly bullish.
If the price manages to close above $1.20800 then the next resistance is at $1.21080.
After last week engulfing candle the pair has found strength to move 100 pips up and reach key level at $1.20000.
As I said in the previous week analysis the price will look more bullish if it closes above $1.19000.
Now I can say that the market really looks bullish and I expect the price to reach $1.20800 which is major resistance for the pair.
The price played out just like it was mentioned in the previous week’s analysis.
The price broke above $1.20000 and reached $1.20800 level.
Resistance at $1.21800 is stronger resistance and it will play a major role for the price to break above and to reach levels above $1.22000.
If the price manages to close above $1.22000 it will have a clear path to $1.23000 as a new high.
The week has ended with the price close to $1.21800 level which is now resistance for the pair. ,
The resistance area around $1.21800 was active two weeks ago.
I am expecting the price to go down around the $1.20800 level and find support for the next attack upside.
The next target is $1.22000 which is strong resistance that prevented the price from stabilizing to make a next move to $1.25000.
The price has done what was discussed in last week’s analysis. The price touched $1.21800 and returned back down to $1.20800.
The $1.21800 is close and I am expecting it will break above.
Weekly time frame shows me a clear bullish scenario with a $1.22800 target.
The price broke above $1.21800 on Tuesday and we had strong buying sentiment.
Then the market reversed back down to find support on the $1.21800 which happened on Wednesday.
I like to look on the weekly time frame and what I can see it just started the move up.
So I am expecting the price to move up and try to break above $1.22800.
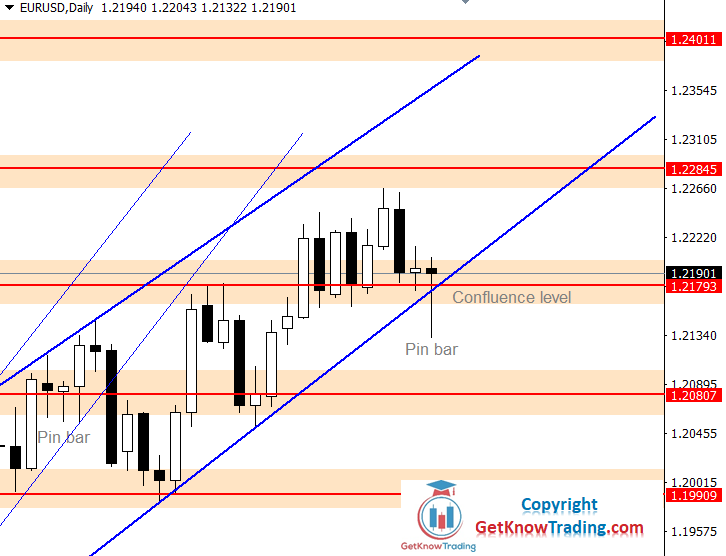
The week started with a bullish scenario at the $1.21800 with the target at around $1.22800.
Price reached $1.22660 and then reversed back down to $1.21800.
The price is currently on a strong support where we have a confluence of support levels
First target is $1.22800 which is now a strong resistance that must be broken so the price can create its new highs
With two Pin bars the price could not reach new highs.
With the start of a week the price moved higher than last week’s ended, but it has short lasted.
The price is below strong resistance that has held the price above for two weeks which means it will need more buyers strength to move again above $1.21800.
Last two weeks were pretty bad for the Euro currency because the price has fallen down to low levels which we have not seen since April 2020
The current scenario does not look good for buyers because the price has support only next to $1.17200.
$1.17000 is an area of support where weekly trend line and horizontal support are crossing so I am expecting that the price will stop there.