Eur/Jpy: CLOSED
AUD/JPY BACK OF TREND LINE SWING 62% [BTLS62]
Correction: This is not a gartley as I defined it. but it is my second top pattern I trade: BTLS%
MISSED GARTLEYS - BTLS’s
Here are some examples of the 30M gartleys and back of trend line swings (including Double Bottom) that we missed from last night. This morning I still jumped in the Australia 200 although the entry was much earlier. The reasoning behind it is though that if it is going to work it is going to work. The downside is that if it doesn’t I might had been at B/E instead of losing 1 unit…Must start my work at a set time, this was at 9:30-10:00 am this morning!
Others were overnight like the US Indices at around 3:30am which I do not work
AUSTRALIA 200: TEXTBOOK BULL GARTLEY AT THE 62% FIB!
EURO50: TEXTBOOK BULL GARTLEY AT THE 79%
Note that it is important to give the market room to move so it doesn’t hit our stop. Like Gartley himself said “some times that market will go back to form a Double Top (Bottom) and rally from there”…paraphrasing…
From here on I am setting my stop at the swing low/high rather than below the candle formation. This will reduce my R:R and the profit amount (since I use a fix risk value) but this is the price to assure that we do not get stopped out prematurely. Alternatively, I could split my entries into 2 stop levels…thinking to do…
UK100 BACK OF TREND LINE SWING FIB 62%:
This is just a version of the “Gartley” or you could say a “non textbook gartley”. I love this set up, it works a large portion of the time and in all time frames…
It doesnt do one of two things usually: It doesn’t have a pre-divergence, and/or it doesn’t take the last swing high (low) like in the Gartley rules. This usually happens when the prior swing was too large…
USNDAQ BACK OF TRENDLINE SWING / DOUBLE BOTTOM:
This is the third type of set up I love and the reason why "we must put our stop at the Swing Low (high). Although the market will form some kind of candle signal at the Fibs 62 or 79, it still can break this as it usually does and head to test the last swing low (high). If we place the stop below the 62 or 79 we would’ve gotten stopped out.
Now, on our defence, there was not a bull candle signal at these levels in the NDAQ…
US SPX BACK TREND LINE SWING 79%:
A textbook set up of this type…my A trades!
TIP: If the 30min chart BTLS or Gartley doesn’t seem clear, jump in the 1h chart (point in case, Euro 50 above)… the set up was much easier to see!
Happy trading!
TT
WED 9 MAR 2022 TRADES:
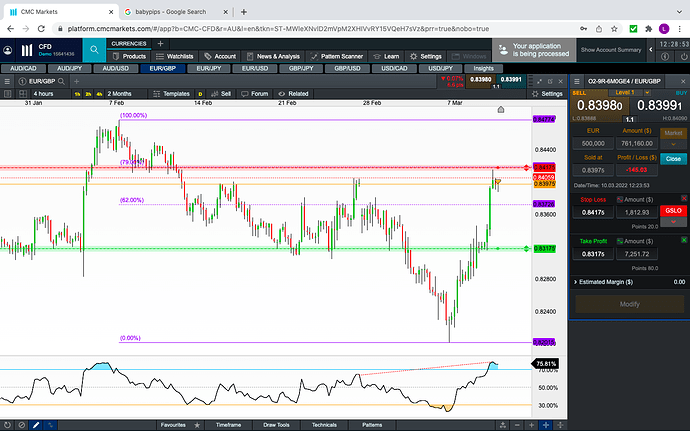
EUR/GBP: FIB TREND LINE SWING CLOSING THIS ONE the euro is going up all around, this one is closed.
AUD/CAD & AUD/USD : FIB TREND LINE SWING
GBP/JPY & GBP/USD : DIVERGENCE
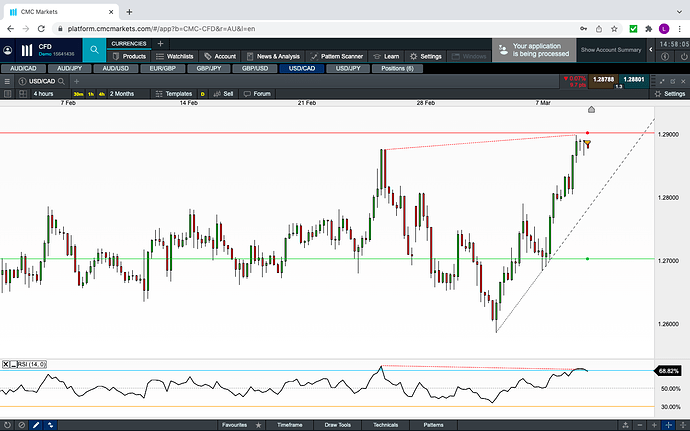
USD/CAD: DIVERGENCE:
HAPPY TRADING
10 MAR 22 12:30 TRADES:
EUR/GBP (1%) & AUD/JPY (2%): SHORTS
AJ should really be a 5% risk given that the same signs are across all correlated crosses AC, AJ, AU
I have closed all above trades last night and this morning.
THU 10 MAR 22 18:30 (UK OPEN) TRADES
AUD/CAD: LONG
EUR/GBP, EUR/JPY, EUR/USD: SHORT
USD/JPY: SHORT
AUD/JPY: POSSIBLE BEAR GARLEY FORMING: Awaiting for the 22:30 4h candle to confirm this bear gartley that is forming
GBP/USD, GBP/JPY: I am already heavily correlated in the Euro shorts (1.5%-2%) all up, and the Pound has not yet confirmed its bear signal. Same as AUD/JPY awaiting for the 22:30 candle.
Positions:
Happy trading.
FRIDAY 11 MAR 22: 11:00 CLOSED
NOTE: I will revisit AUD/USD. If the current live 4h candle doesn’t end up as an Bear Engulfing, then this trade is not confirmed and I will close it off. Otherwise, I will add to my initial risk. I have used the 1hr candle for confirmation of this trade
CAD/JPY CLOSED
EURO50 short
FRI 11 MAR 22 16:30: AUD/USD LONG: 1HR CHART: [TLSF62]: CLOSED & REVERSED
I reversed my position to trade the 1h chart Fib 62% + 2H Trend Line convergence.
I am transitioning from 4h / Day chart trading to the 1h chart, so please bear with me while I adjust my trading accordingly. I found that my “patience” is quite limited to stick with a trade for a week or two while it moves. I have always preferred to trade the 30m or 1h and max the 2h timeframes, but until recently I hadn’t fully tested that my method would work on these time frames, and they appeared so far to do so (I have tested USD/JPY, AUD/USD so far).
OPEN POSITIONS:
**FRI 11 MAR 22 19:30 **
USD/CAD & AUD/USD
AFTER FURHER REVIEW, WE ARE STICKING WITH OUR ORIGINAL AUD SHORT. IT IS A “BTLS” TYPE OF TRADE.
MON 14 MAR 2022 TRADES:
EUR/JPY: We missed this short. It wasn’t clear at the time. It is now… -1 
GBP/JPY: Short Order -1 
GOLD: Buy order -1 
MON 14/3/22 19:30: A bad start for the week. Onto the next ones.
MON 14/03/22 22:30 TRADES:
GBP/USD LONG: 4H CHART DIVERGENCE (correlated trade)
EUR/JPY LONG ENTRY ORDER 1H CHART:
AUD/USD LONG 4H CHART (PENDING):
This LONG will only be an entry if the current 4H candle (due to close at 2:30AM Adelaide AUS Time) finishes as a Bull Engulfing or even a Hammer…So I am posting this possible trade for those of you that can trade this time…
I might be able to get it on a limit buy order tomorrow…
TUE 15MAR22 19:30 TRADES: **Week to Date: -5% ** 
After a few losses, back on the horse with the following swing trades.
The good news is that the EJ has formed the 1st step of a gartley whilst the GJ is in the 2nd step…one more and we might have a nice 1H chart gartley to trade…
AUD/USD & GBP/USD: SHORT TLS Trades


