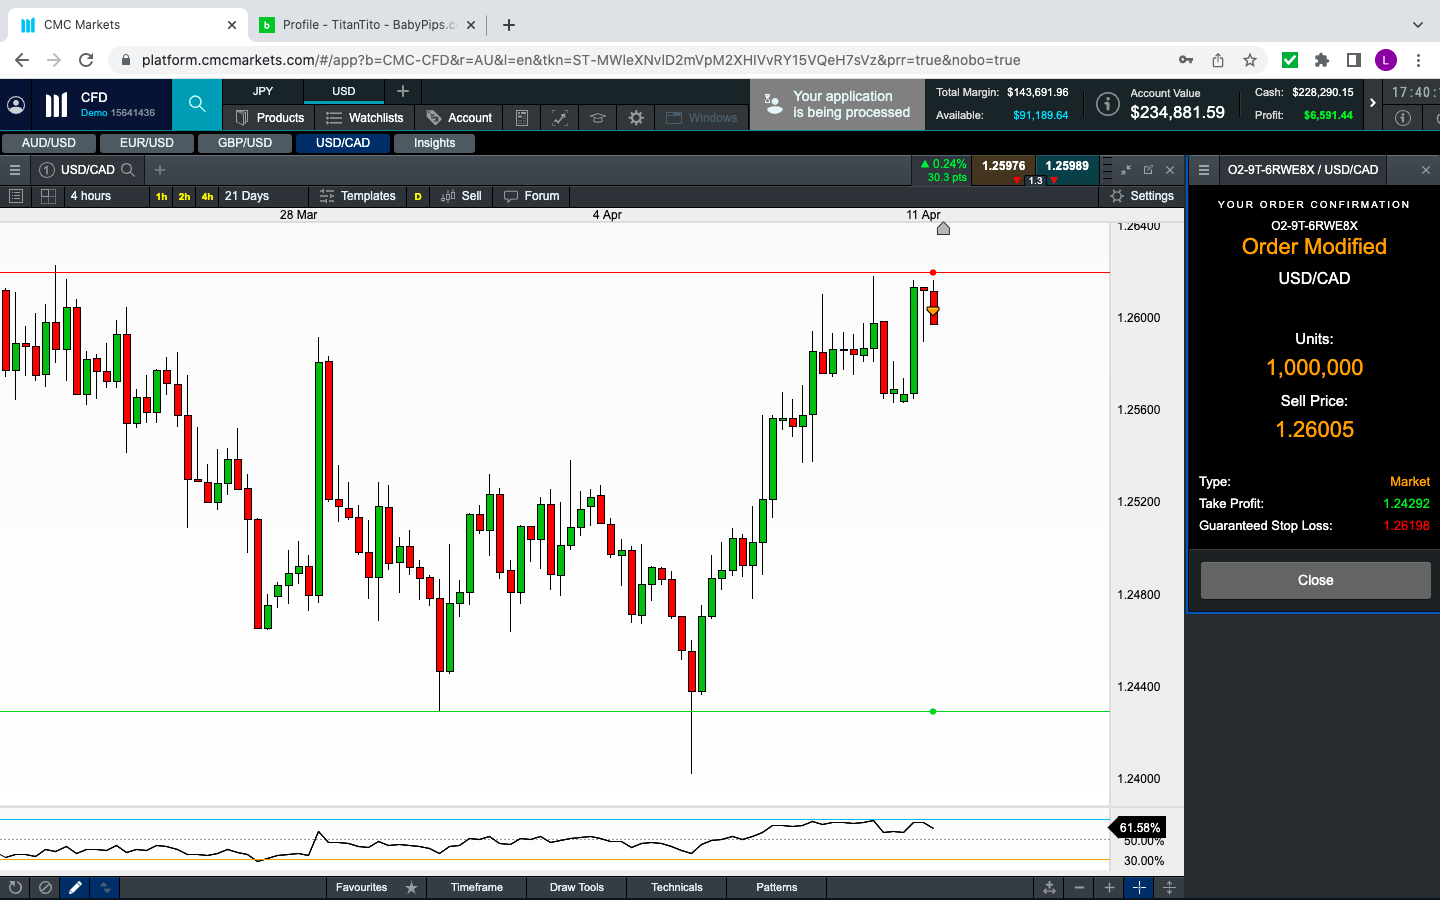
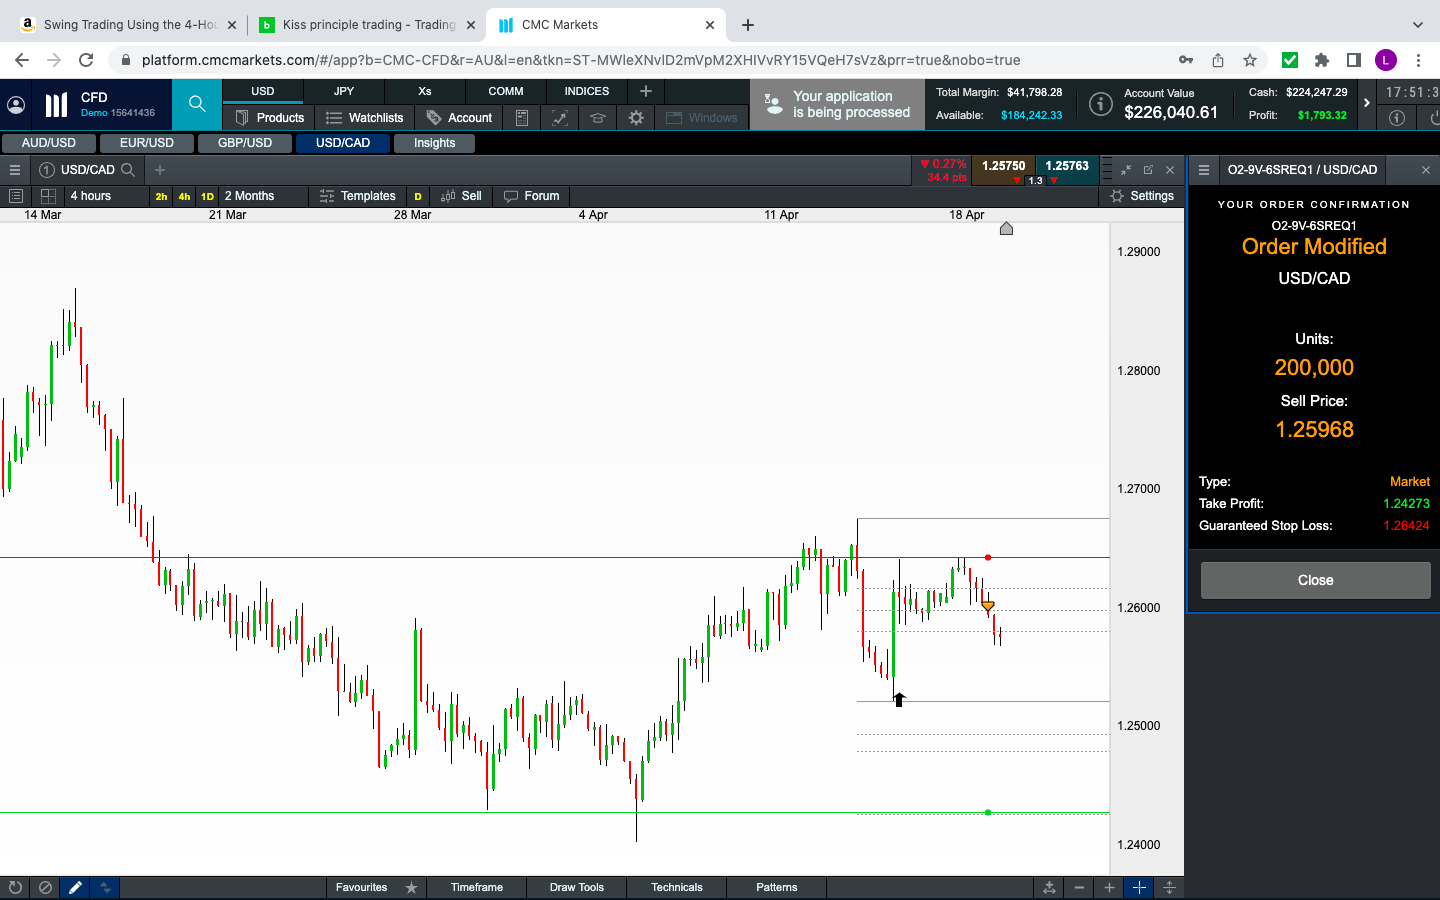
USD/CAD, NZD/JPY


WED 13 APR 2022:


POSSIBLE UPCOMING GARTLEY IN THE 4H CRUDE OIL:
I know, I said I removed crude from my list, but what can I say, I want to crack the commodities, which btw, has provided me with overall profits…

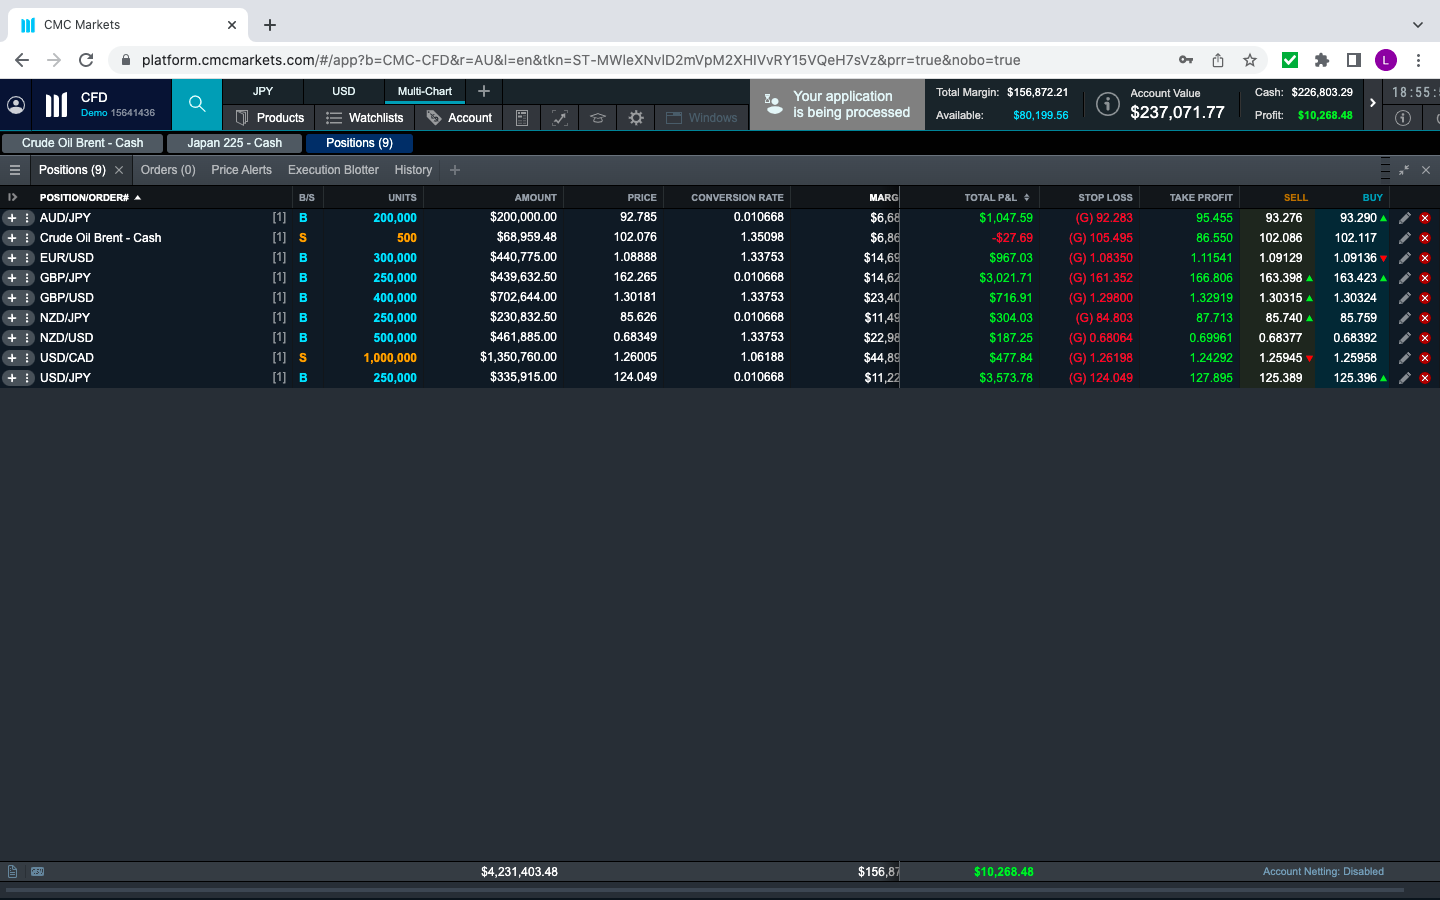
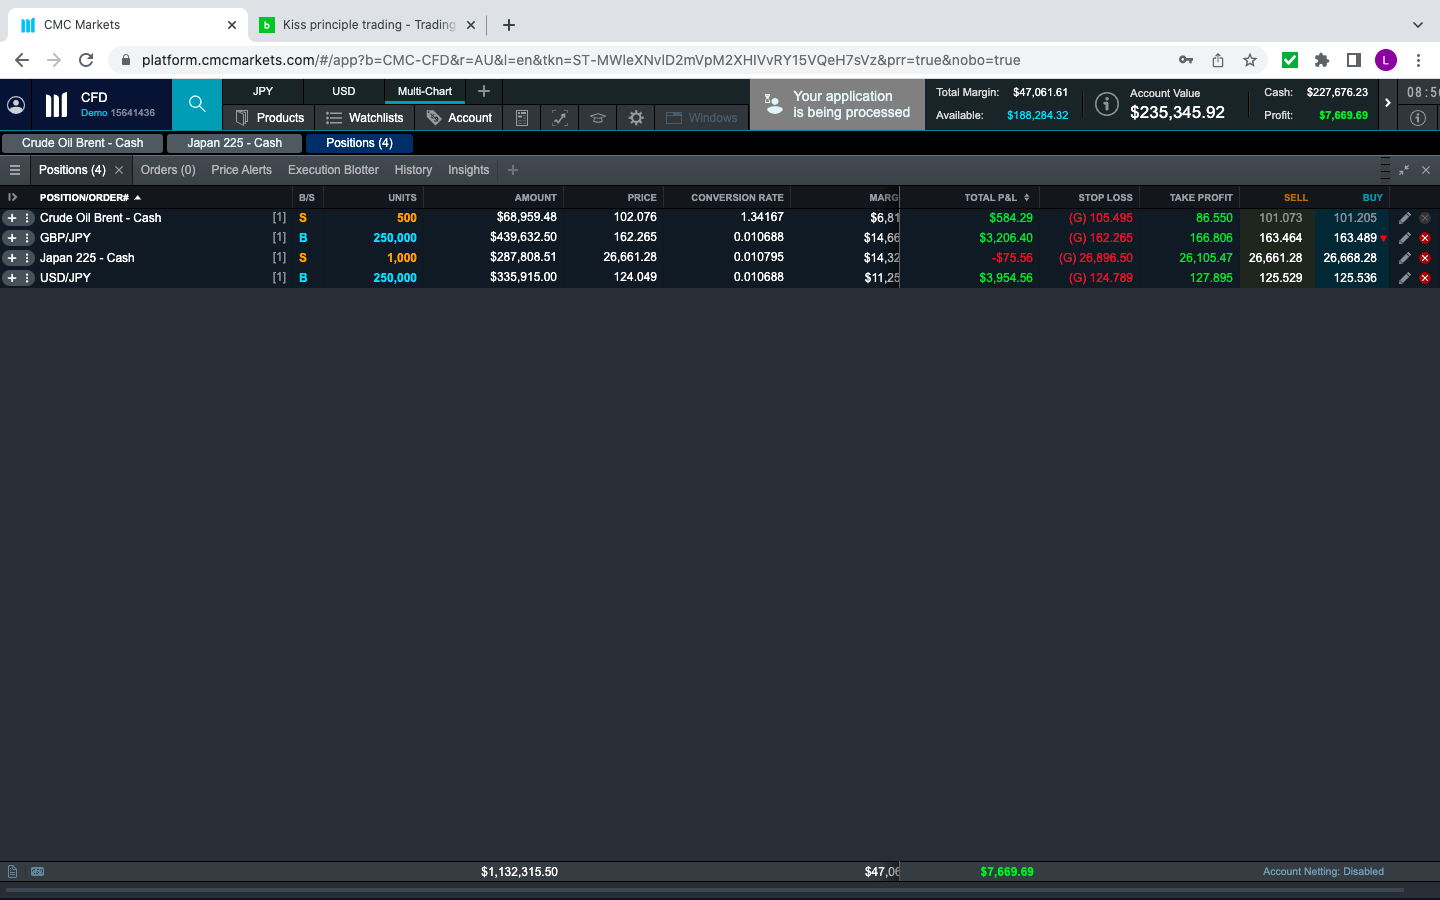
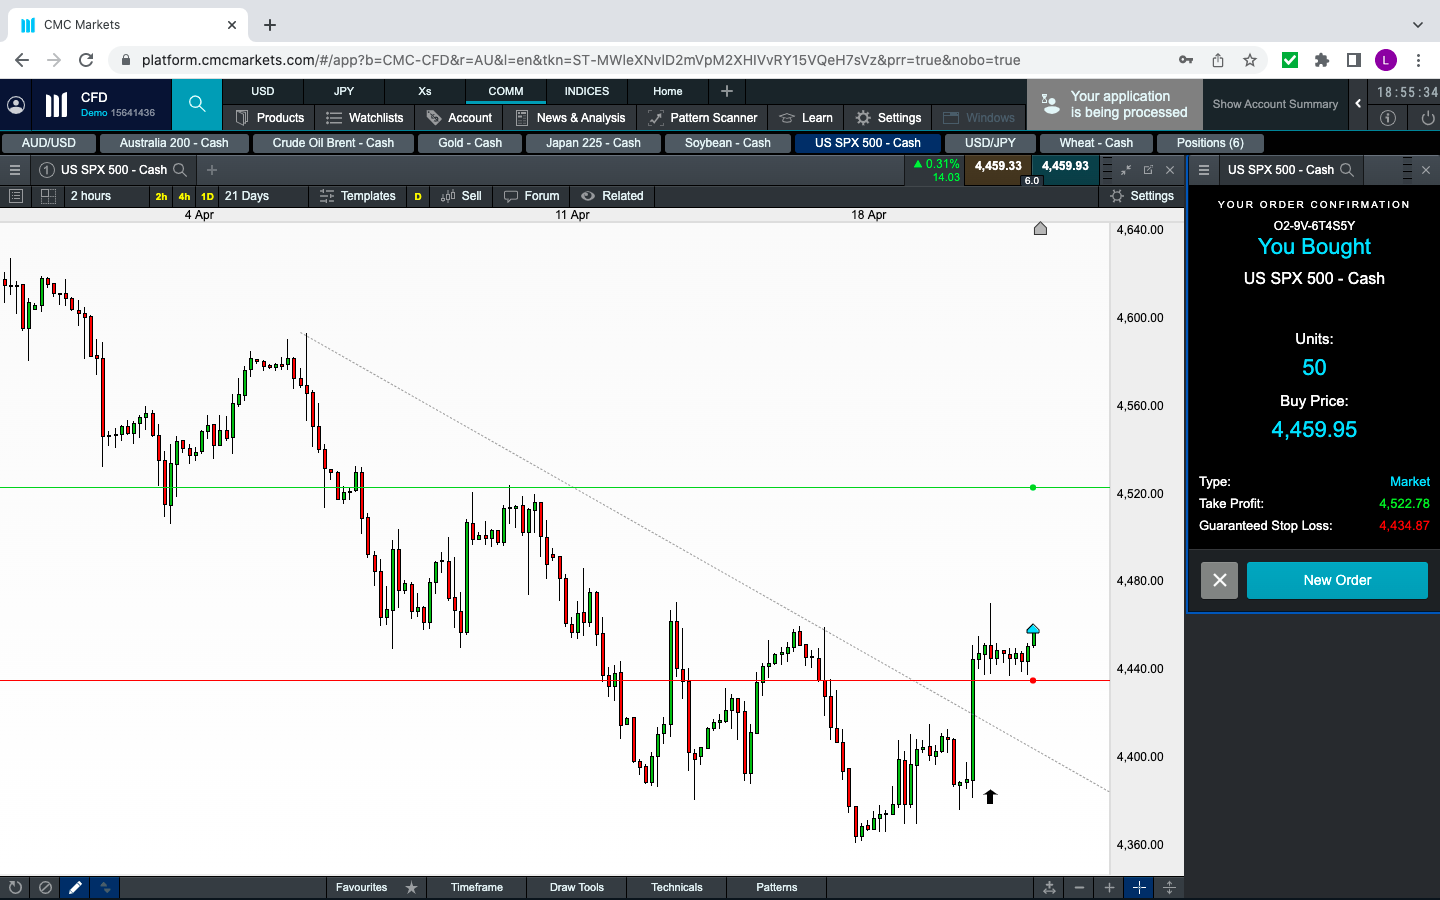
POSITIONS (@ 12:30PM)

PERFECT GARTLEY/CROWN SET UP
As I mentioned before, “The Gartley” def I use is from Gartleys original book I believe Page 226 (got to re-read the book), where he describes pretty much what is nowdays similar to “H&S” or “Crown”. I translated his volume references to RSI and a few other additions like the use of Candlesticks and Fib.
Yesterday morning during breaky my eife needed to make a payment in GBP and looked at the chart, and there it was a “perfect reverse crown/gartley”. The left tip was spot on to the right tip, there was a divergence that formed a “descending wedge” when drawn, there had been a long term downtrend preceding, it had just formed a Harami at the 50% fib.
From yesterday b/f to today’s b/f +200pips move!!
When I saw it I said to my wife “wow I got to trade this after we finish b/f”, … I FORGOT!!! 
I still do not have a “streamline, structured, disciplined, designed method of scanning through the charts”. Or having alarms set to remind me my “days watchlist”…
This cost me 5x at the min, because this move is still long way to go.
On a positive note: I was spot on right! My “gartley ver” worked perfectly once more. And, since this move suppose to head to at least the 127 fib ext, I will watch this cross for a retracement entry prior to that juncture …if it gives me a second chance…
1 Like
MONTH RESULTS (14/3-13/4): +14% 
Not as I was aiming for, we fell short of my 25% sky high target…
I ended up with +14% but I am not complaining. On the contrary, I am grateful for all the lessons I learnt along the way.
On review of my results and trades, I decided to finish my “Bible” which I am doing right now. This is my revised and, at least for now, last version. It lists my rules, depicts the only 4-Patterns I will trade moving forward and the instruments I will trade moving forward (10 instruments in total in the Demo account)
In addition, I will continue reporting “To Date” results meaning from 14/3/22 onwards (when I adjusted my Demo account to $200K start bank). Once again as much as I can all the trades are mirror of my Live trading, but sometimes I can’t post them all.
Hope you all have a nice weekend. I currently have all trades Closed in the Demo but my Live account is in Locked In profits with USDJPY Long trade I took last night.
Happy Easter

THE 4 PATTERNS:
Day RSI Divergence with Day Candle Entry
4hr Double Bot/Top with 4H Candle Entry
4hr/2hr Gartley with 4hr/2hr Candle Entry
4hr/2hr TLS4 with 4hr/2hr Candle + Fib62/79 or +1hr Pattern Confirmation if Fib38/50
Candles: Harami, Hammer/Shooting Star, Engulfing, PP/DCC
RISK: 1% Per Trade
TP: Fib162% (or Trailing if DT/DB, RSI Div)
Pyramid: 1/2 the Previous Trade (Gann Rules)


WED 20 APR 2022:
After a very disappointing day, we are back on the horse
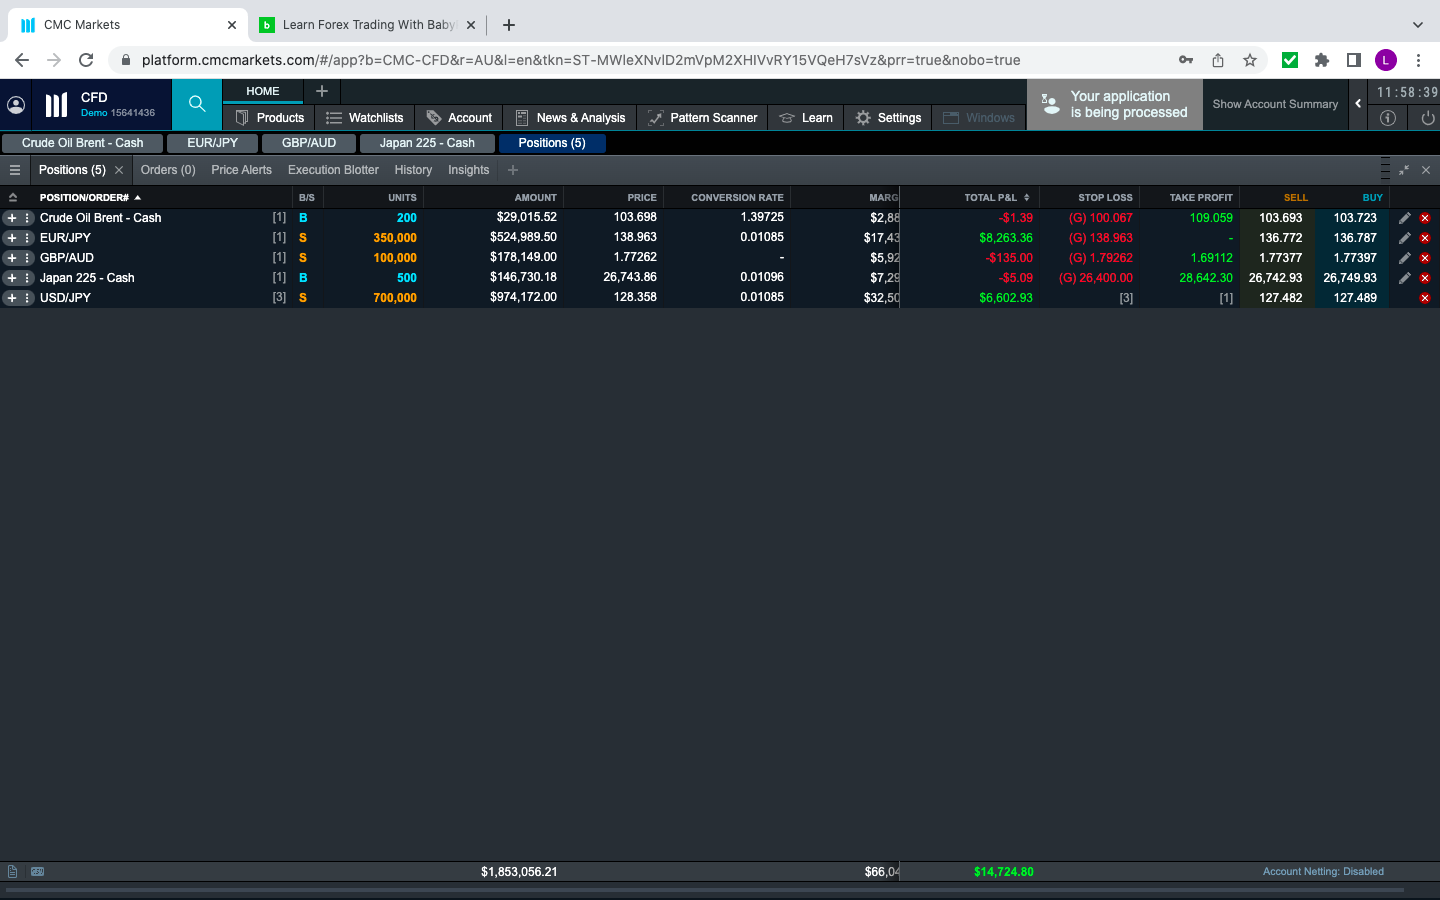
here are the current positions. I got to rush off so didn’t have time to print screen the charts…sorry 

WED 20 APR 2022 UK SESSION
A few of the charts and the list of open positions…at least today we are heading in the right direction


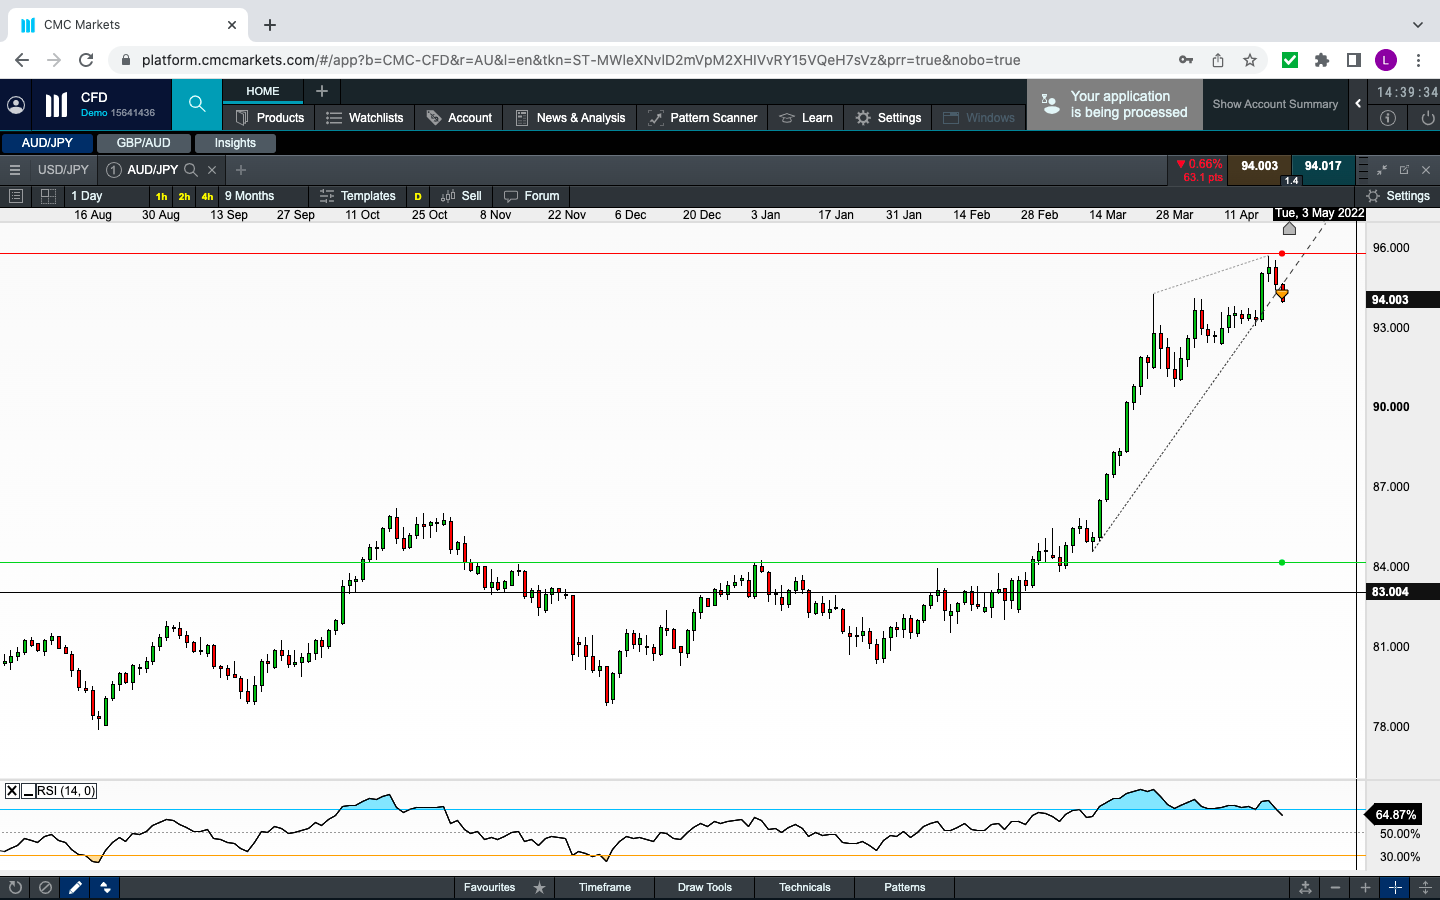
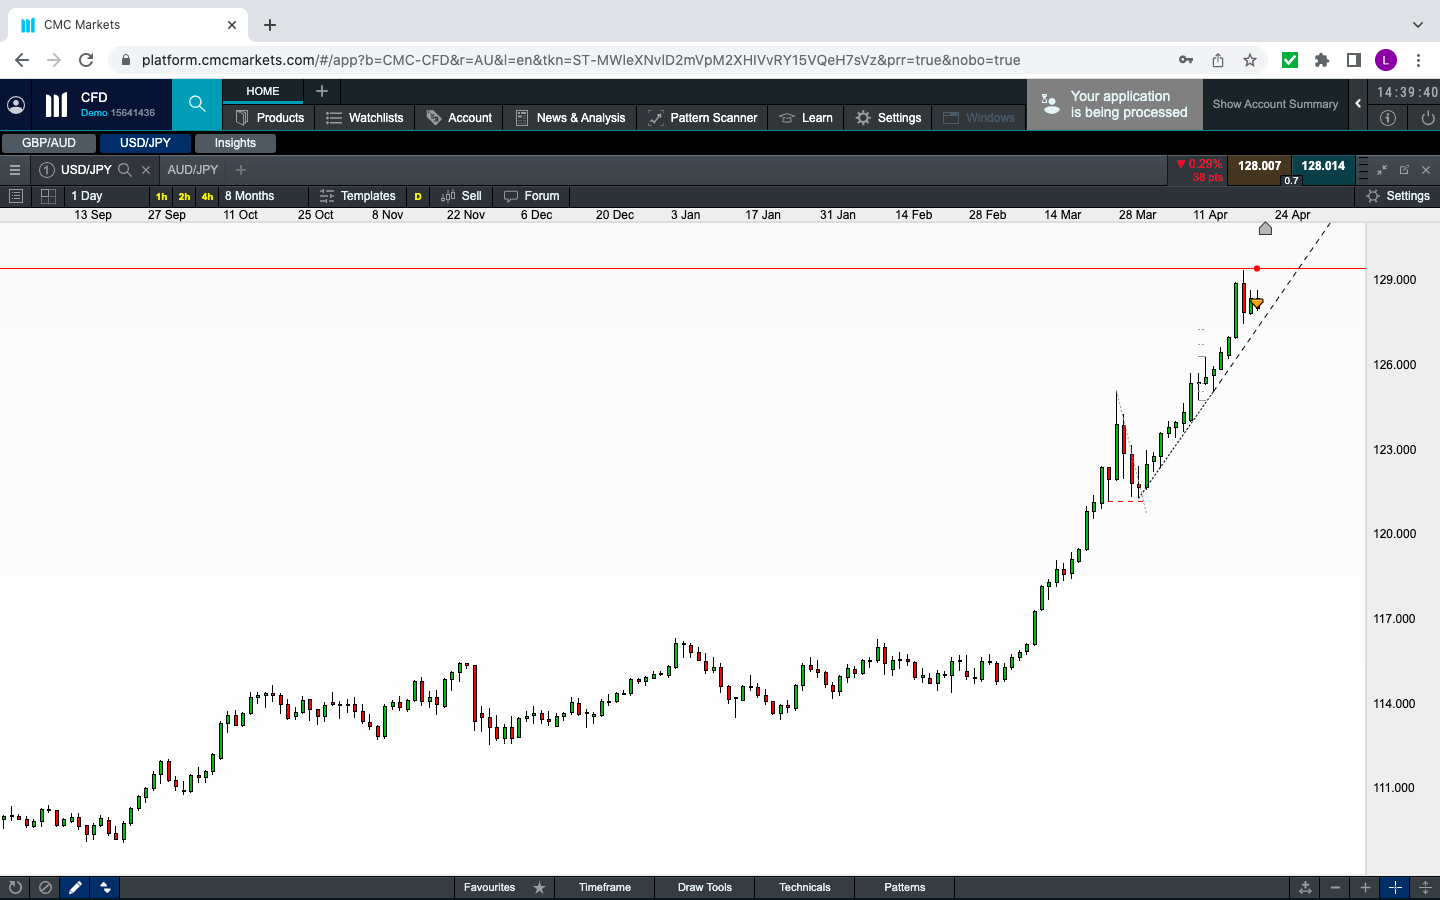
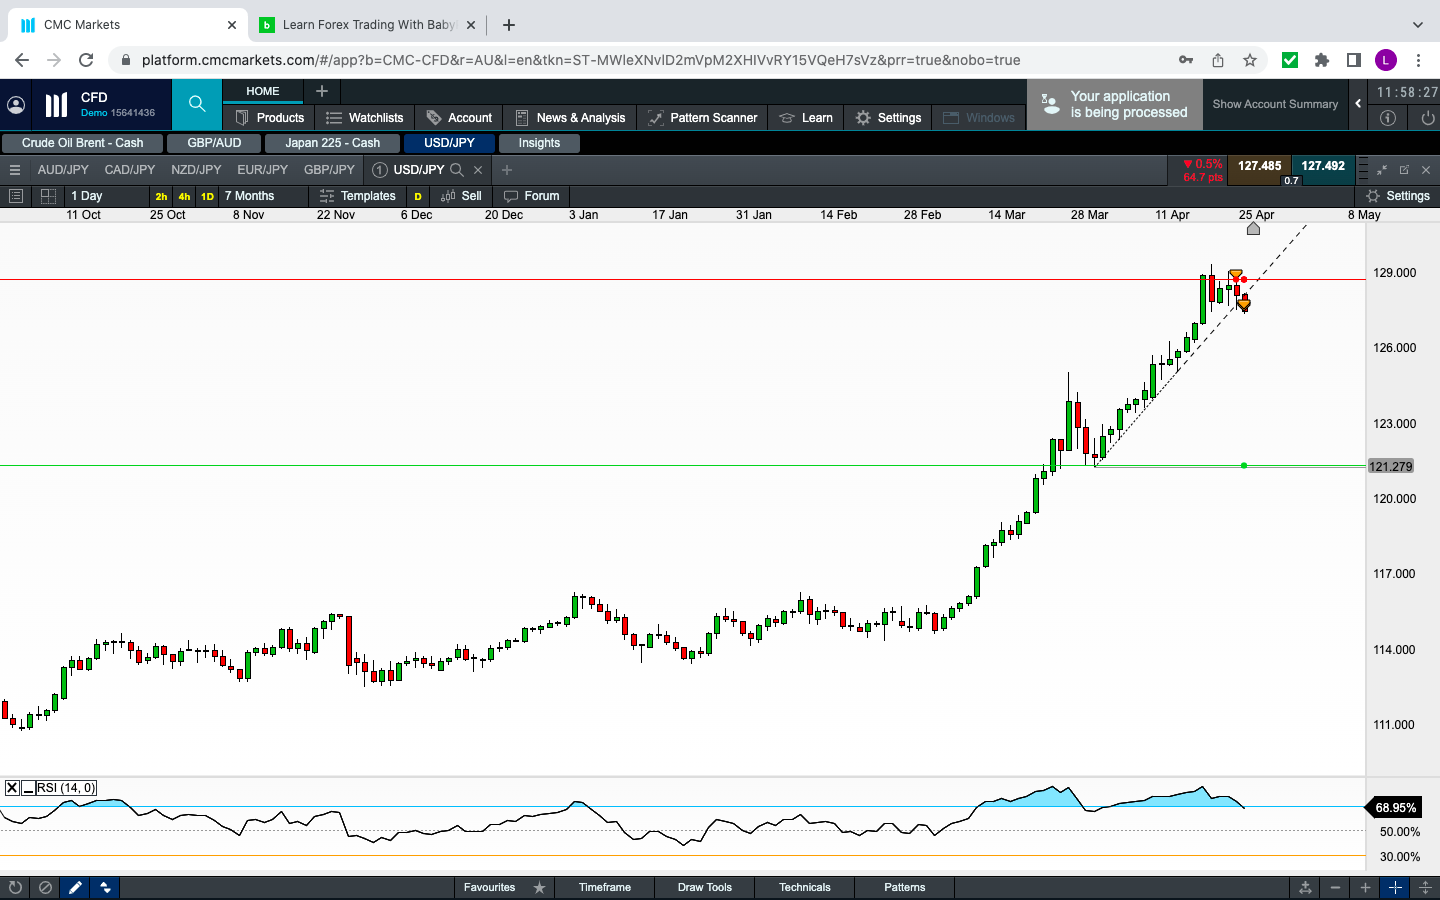
FRI 22 APR 2022: USD/JPY
The right entry was yesterday at 8:30 AU time after the 4H bull candle formed at a Fib and above the Long Term Up Trend Line that has been running for a few months now. Although, the Day RSI is showing Divergence, I will continue trading Long until the TL and the Last Swing Low (4H chart) gets taken out.

MON 25 APR 22: X/JPYs
Friday 22nd April was a very exciting day. All the Xs/JPY crosses Day Chart either had a RSI Divergence or were well overbought. I have been waiting for this moment quite “patiently” I might say.
And it finally arrived. I got very distracted with the Xs/USD crosses thinking that they will also turn around, and I was very wrong on those. however, I was quite right on the JPYs. I had entered AUD and USD/JPY as per the previous post and today I couldn’t wait to jump in the others.
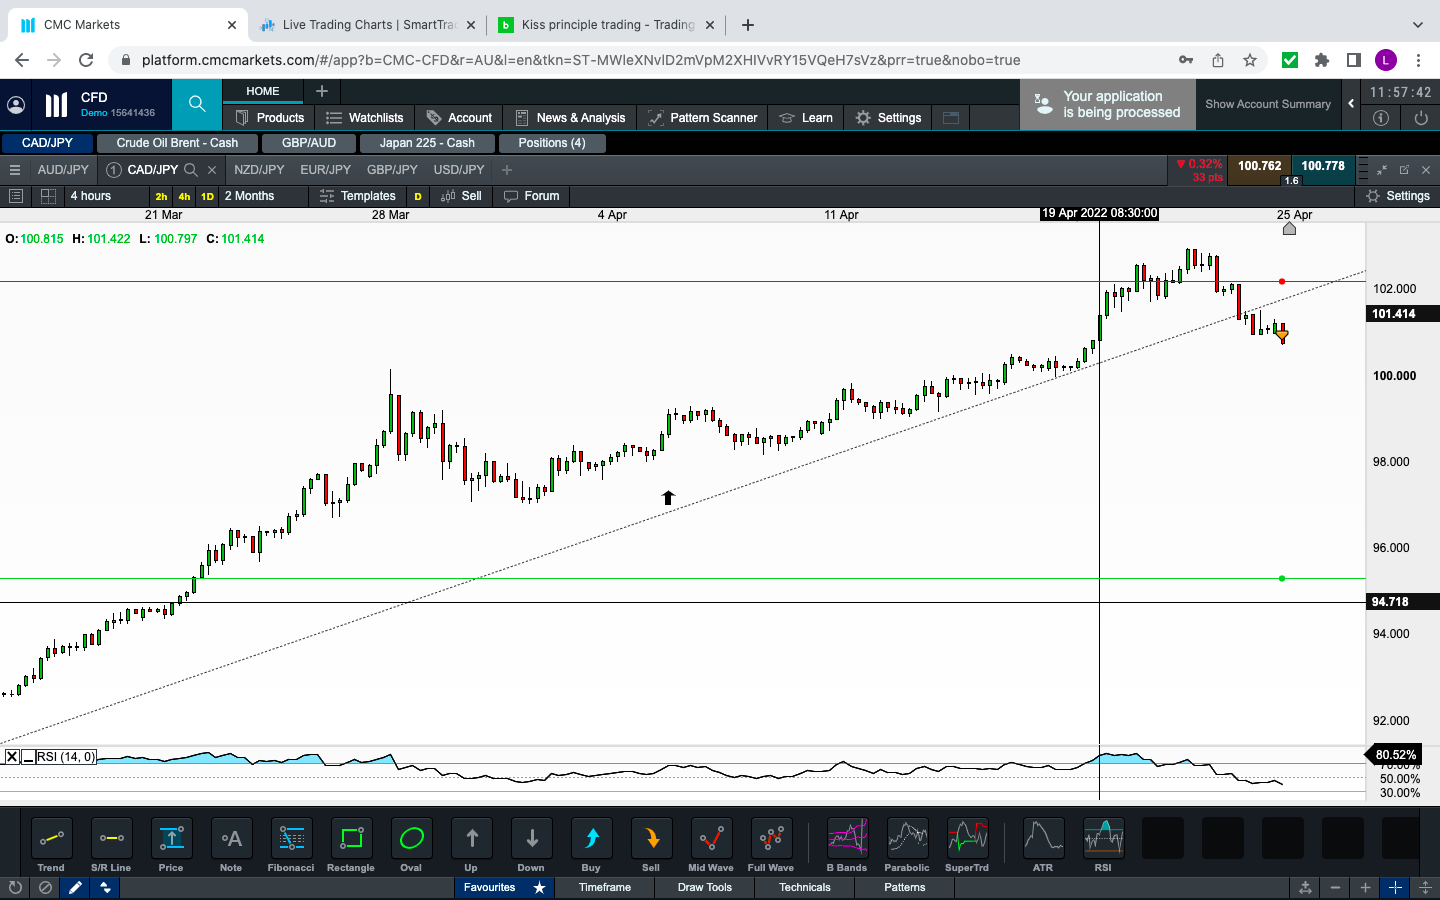

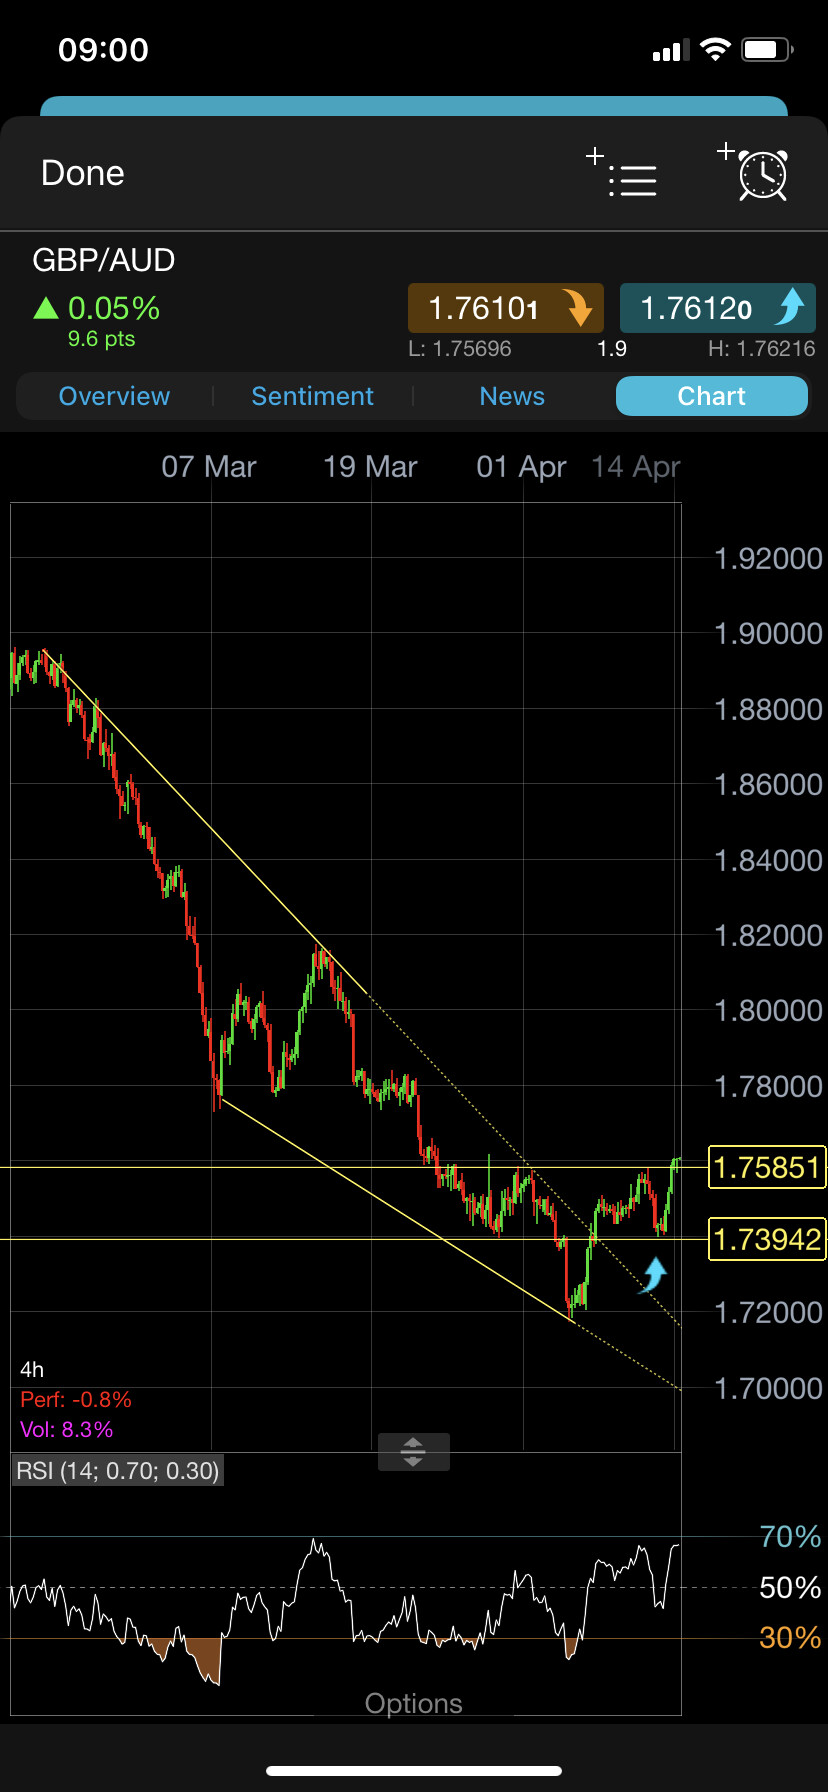
GBP/AUD: On the other hand, this cross has been eluding me! twice! First I missed the nice perfect Bull Crown (or Gartley as I also call it); then I missed the next swing Fib bounce…and today I intended to jump in the 1H chart but by the time I got to my computer, it had already form a Morning Star and had run away… I WILL CATCH YOU NEXT TIME!
So now I am looking for a H1 swing retracement to enter with the stop at the previous Swing Low. ATM GA is approaching a double Fib 618% Resistance Level, so this could give us the next retracement we are waiting for to enter LONG
Below the arrows point all the missed opportunities, NO MORE!

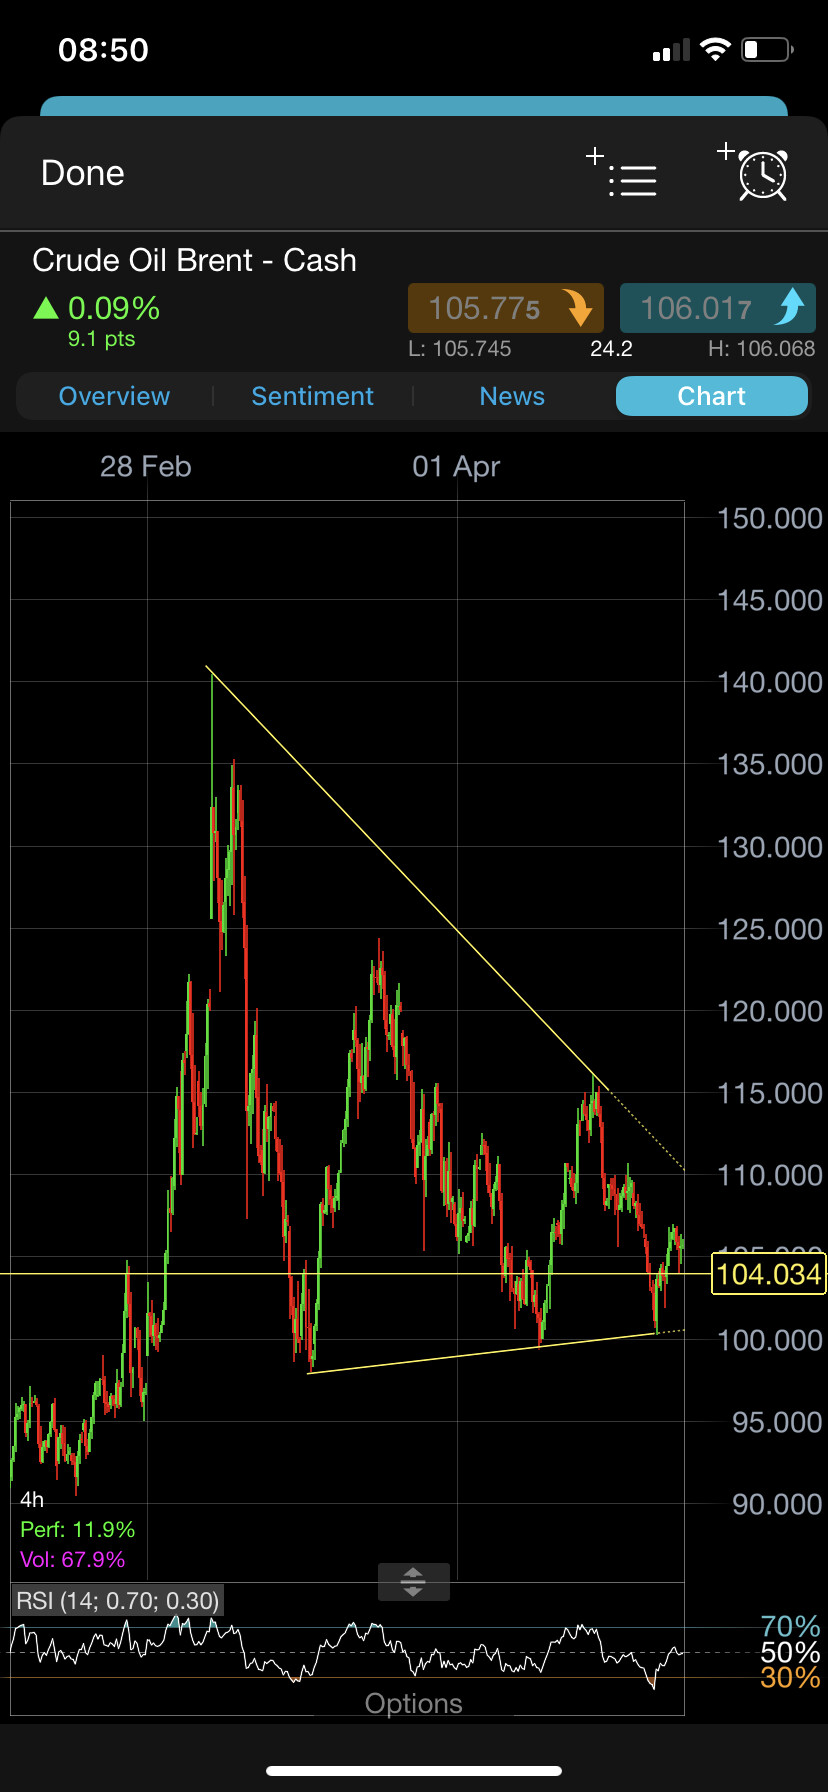
CRUDE OIL BRENT CASH:
Definitely heading south, quite obvious, again a nice opportunity, although not as clear at the time, presented on Fri 22/4 at 8:30am (Oz time). However, there is a 618% Fib support at 94.68 level, however first it will need to break through the 98 level which is the base of a possible Triangle and Week Support.
In any case, I am waiting for the next swing rally to SHORT oil.

JAPAN 225 CASH:
This one I had it totally wrong! I failed to analyse the “bigger picture”, in my case, since I trade the H4 Chart, I needed to analyse the Day Chart for “direction”. Had I done it, I would’ve seen the beautiful Day Shooting Star that had formed on the 21st Apr. Meaning that I needed to LOOK FOR A SHORT IN THE H4/H2 charts!
This perfect entry occurred on Fri 22/4 at 20:30 in the H2 Chart when it bounced of the back of the H4 UTL…
Say no more, a picture speaks for itself!
Now, looking for a rally from the 26000 area or its Fib Extension to go SHORT.

SUMMARY: X/JPYs: Just go SHORT on every rally opportunity that presents from here (AUD/JPY, NZD/JPY, CAD/JPY, CHF/JPY -which I do not trade ever, EUR/JPY, GBP/JPY & USD/JPY).
Preferably at a 618 or 786 Fib with a H2/H4 Bear Candle (for extra confirmation).
There is plenty of room, in some like AJ of about 600 pips to the next major Day Swing Fib 618 support.
Below the “Major” Day Swings Fib 618 Support areas
For what I believe to be a new Down Trend…
AJ: 86.020 (585 pips away from current price)
CJ: 94.50 (625 pips away)
EJ: 130.35 (780 pips away)
GJ: 157.60 (650 pips away)
NJ: 79.90 (480 pips away)
UJ: 124.00 (400 pips) - 120.00 (800 pips)
And the above ranges will increase when entered in the next rally…
Below the Next Possible bounce areas:
AJ: 91.80 (Fib 786), 90.70 (Wedge low)
CJ: 99.30 (Fib 618), 97.00 (Wedge low)
EJ: 136.50 (Fib 618), 135.50 (Fib 786), 134.30 (wedge low)
GJ: 162.60 (Fib 618), 161.00 (Fib 786), 159.00 (wedge low)
NJ: 84.00 (wedge low), it should take this one out and then rally, after that, a FREE FALL to 79.85 (Fib 618)
UJ: 124.40 (Fib 618), 123.00 (Fib 786), 121.30 (wedge low), 120.15 (Fib 618)
So let’s get set to ride this “potential new down trend”…IF I AM RIGHT THAT IS!
MON 25 APR 22: UK SESSION:
GBP/AUD: As expected, this X has formed a very nice “Bear Harami made up of a textbook Shooting Star”. Now, those of you that like “counter trend trades”…we should head south towards the 618/786 fibs of the most recent swing, most likely the 786 given that it coincides with the mid-point of the Bollinger band.
After further analysis, this H4 Harami/SS has formed at a Day 618 Fib Resistance Level and Top of the Day Bollinger.
The last time I saw this happening, recently with the Jap225, it resulted in being the end of a “corrective leg”…So I have entered this trade Short with 1/2 size (CLOSED)

POST NOTES: Sticking to my initial analysis, waiting for a 2H confirmation of a dip.
JAPAN 225:
Another one I have been waiting to turn around and rally so I can enter SHORT.
Also a potential “counter swing/trend” trade here with a 5:1 R:R shall it hit the 618 which is also the mid area of the Bollinger Band…
The entry will be confirmed at 18:30 hrs when the current H2 candle completes the Bull Harami…
Now, this one I will take albeit still at 1/2 my usual size given that it is “not in the book”…


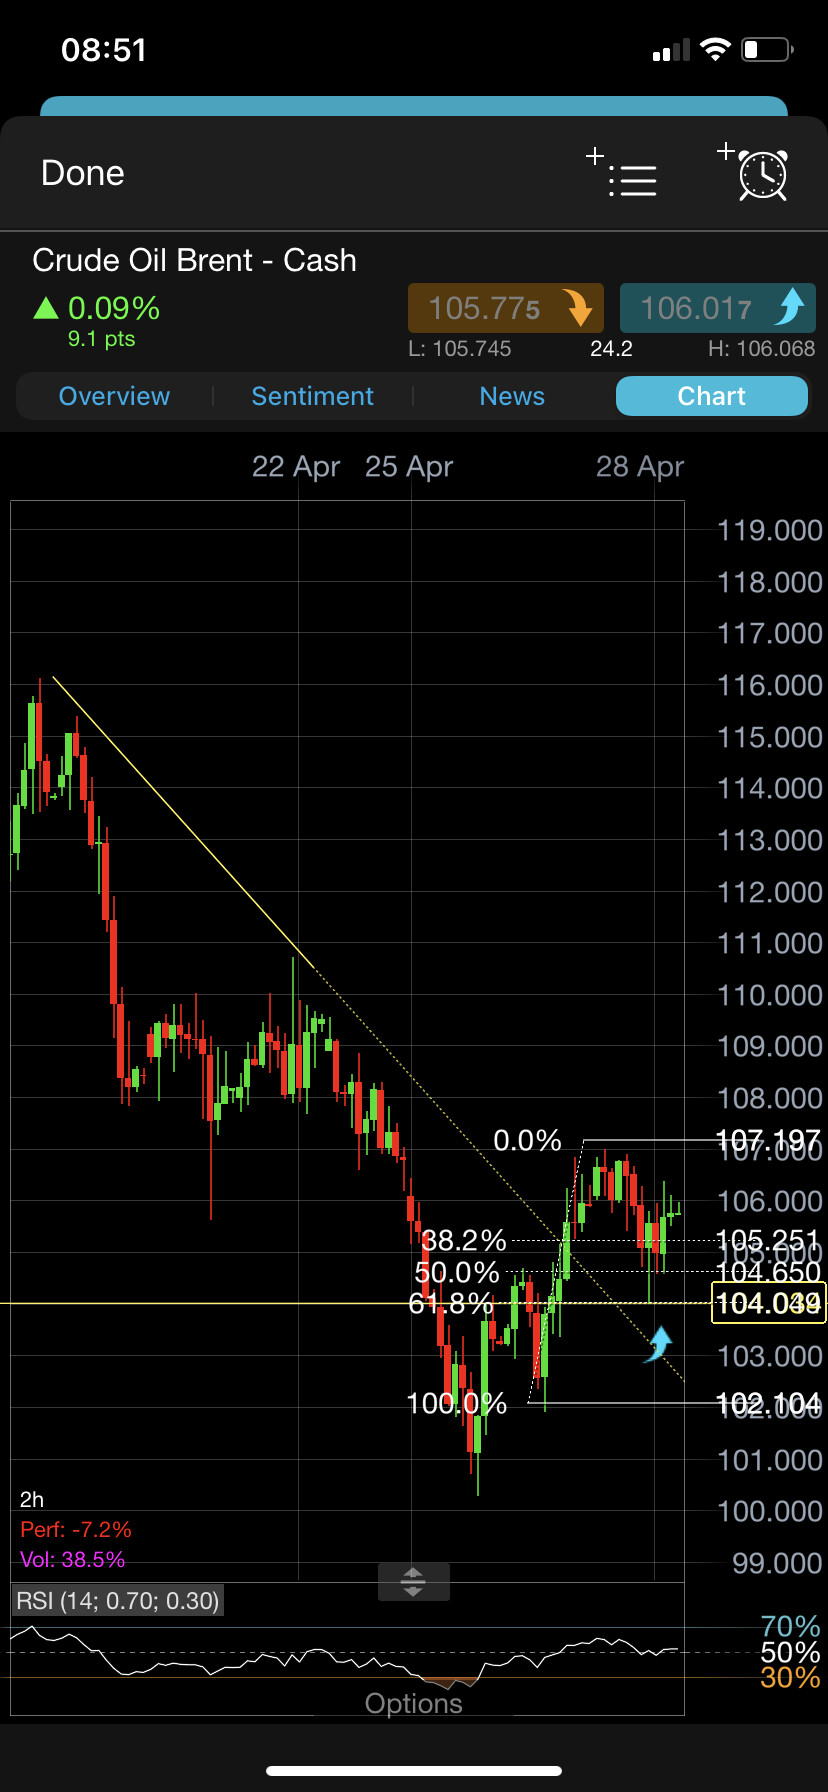
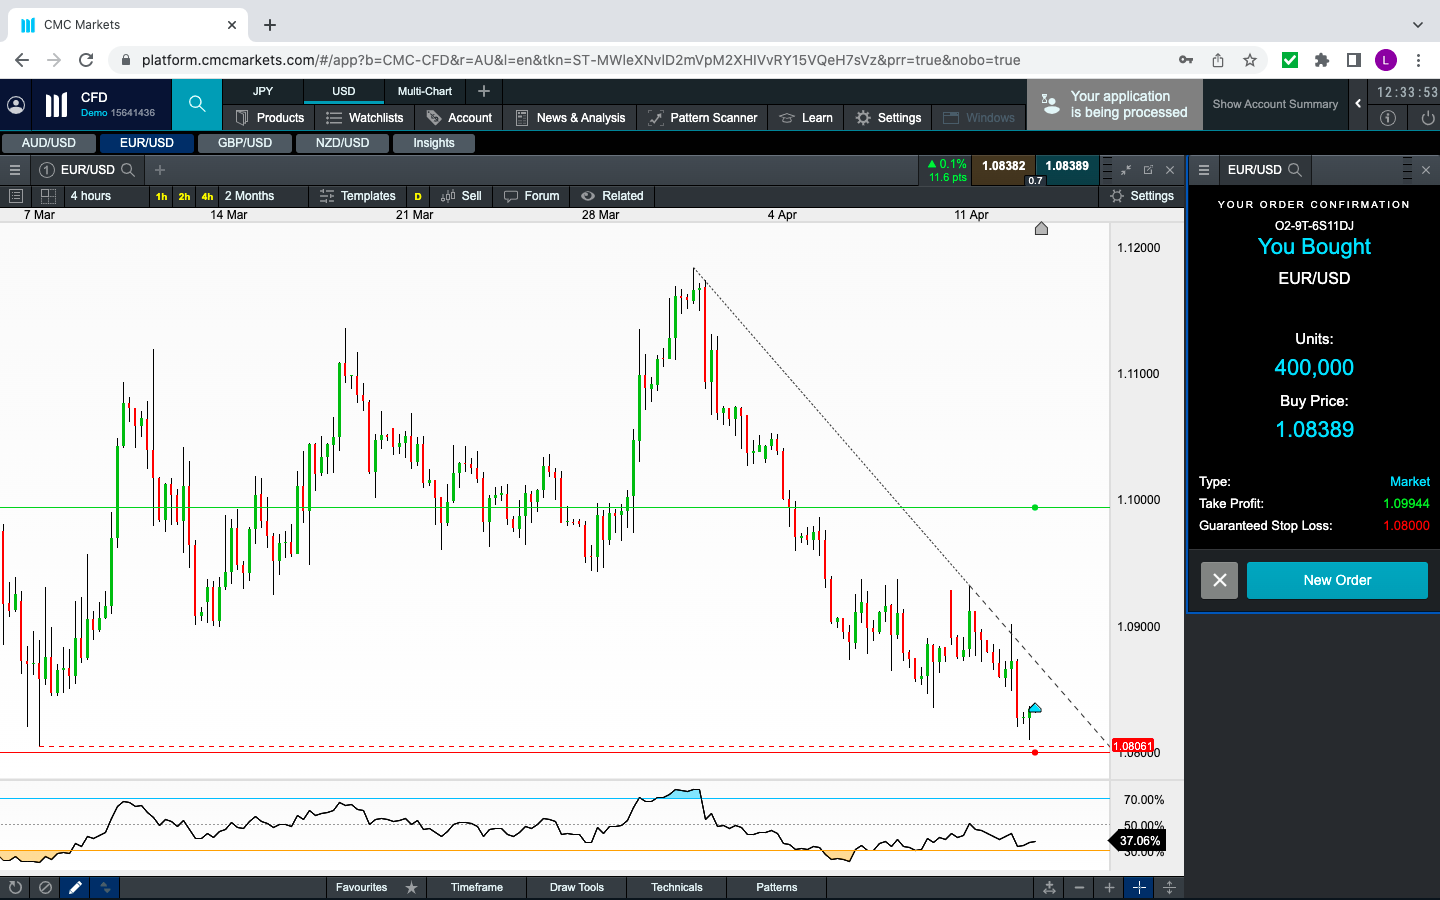
THU 28 APR 22 9:00AM: CRUDE BUY:
Heading towards the upper range of a Day Triangle
After breaking the Most recent H2 Down T/L and forming a nice Hammer at the F618, We are ready to enter Long upon opening.
The market likes to touch the other Fibs sometimes, for instance, after the Hammer touched the 618 the next H2 candle touched the 50 fib, so it wouldn’t surprise me if either the market opens at the 382 level or it comes to hit it. Either way our target is the Upper Range of this Descending Triangle