he he, that is just the table of contents page number of the created template. I am hoping the plan will be less than the 90 pages of notes … but if it includes all the test plan results, perhaps not. 
I really like the idea of looking at given currency strength based on multi pair performance.
I’ve prepared very draft indicator for similar strength comparison.
Below is the result of being always in the market based on strength relation for EURUSD.
If EUR is “stronger” against other major pairs than USD then long otherwise short.

Green areas are the profitable trades, reds are losses.

Worth noting, that every loss was for some time in green zone, so further tinkering with trailing stops or partial exits may be interesting.
Good morning Journal.
Ok. Thanks guys for all that.
Very interesting stuff!
Well let’s see, where am I gonna go today?
I kind of feel like looking at the market. It’s been a couple weeks since.
This is a good time for that, cause we’re climbing out of the turn of the month. Just passed up the NFP Friday, had some major central bank meetings last week. Let’s see if we can make some sense of where the direction of these currency’s want to go in. And I think the best way to do that is to know in which trend they are currently in, and see what kind of changes have been taking place.
Alright, let’s start from the beginning.
The USD index.

Ok. So, we know that this chart tells me the trend their currently in.
On the weekends is the time that I determine their stated trend. And I don’t change this during the week, cause I believe the market operates on a weekly basis. Why? Because, we move from the open to the close. Then everyone regroups and we do it all over again. Every day has their own particular dynamic in which things like to go in. This is the best context in which things repeat themselves, I believe.
So, what’s the USD trend?
I’m not changing their most recent stated trend, just yet. Which is short.
Look back a little. I switched their long trend to a short trend ever since they dropped down below the 1000 gridline level. Sure, someone could come back and say it should be at the 500 level area. Well, this is all subjective. And I called this 1000 level way back in Oct. So I’m just keeping with it. There’s been so much bouncing around at this level.
But look at where we’re at now. Came back up to it. That last day of the week (NFP) didn’t really extend much above it. Now, the lead up to the day sure did make it all the way back up to the top. But faltered on that last day. Therefore, I’m not convinced of a change in trend yet. I stay with the USD on a short bias. We’ll just have to see what happens this coming week. I’m sure it’ll make things more clearer (cause that’s how it works).
How about some other context.
A closer view of their movements. Well, I’ve mentioned this a couple weeks ago. How ever since Oct they’ve been moving low. Like, the consensus is very clear. But now, look at what’s happening going into Nov.
Look. I’ve always, always mentioned this. Change really likes to take place around a turn of the month (I know this because if there’s anything I am good at, it’s documenting how these currencies move). Well, here again we can see this. Look back going into Oct. It changed going into that month. Going low. And what happened? It went low the entire month! But now what? We’ve bounced up some. Look closely. There was a lull from about Oct 21st to the 26th. Then a quick drop then a quick bounce back up to that very same area. Then eventually moves higher above that area. Sure does seem like a change in trend is about to happen. I mean, you have to be able ask the question…Will this month go back up?
It could. Of course. Anything can happen. But the thing is, we just don’t know what’s gonna happen. We don’t (don’t fool yourself). Now. When I start seeing some confirmation , say to rise up and above the 0 line, then that’ll start telling me change just really might be happening. But not until then. No one can tell me we’re not in a down trend here. I’m sorry. Top left of the chart is high. Bottom right is low. That’s a down trend. Therefore, their bias is short.
How about another context.

Got a quick overview of everybody. Plus we can see what happened this past week. And then we just started the month (which is the same thing). And we’re in the second month of the last quarter of the year. And…we have how the year has been playing out. All these are running %'s. Meaning, every day was added onto the last day. I’ll tell you what I see.
— 4TH QUARTER CONTEXT—
- Risk on sentiment stronger than risk off sentiment.
- The CHF has come in between the Comms. This is a bit of an anomaly. Cause they are separated from the EUR, and also the other safe havens. This is not normal. Be aware. Remember this.
- The USD is very negative compared to every other currency (one exception). Note the actual numbers.
— THE FIRST WEEK OF THE MONTH —
- The outlier is the AUD (-11.03%). Has moved in the opposite direction of their trend. They diverged (more than normal) from the NZD.
- The EUR & the CHF are running normal, in tandem together, both strong (strongest).
- The JPY had a good end of the week. And being matched up with the CHF tells me of some safe haven movement.
- The GBP fell pretty badly at end of week. Central Bank reasons.
- The USD not going anywhere. Middle of the pack.
— THE YEARLY CONTEXT —
- The biggest outlier the JPY. Tell me someone sold them all year long…Please…What a lesson here. -151.47% against everyone.
- The Europeans been strongest. GBP, EUR.
- All the Comms very positive territory. With the AUD as the weakest between them 3.
- The USD about at break even on the year. But all 3 safe haven currency’s sitting in the last 3 spots. Comparatively speaking.
That’s nice.
Moving on.
Let’s look at the EUR index. What’s their trend?

Well, it’s been a couple weeks since I changed their uptrend to a downtrend. Just like the USD. I’m not gonna change this yet. Where’s my line in the sand? Well, I’ve called that 6000 gridline the line. If it would go above that, then I would say their trend would change back to that longstanding high trend. But I believe this chart shows a change from that. It’s been moving down.
Sure. We’ve had some serious activity here lately. But we also need some more time to go by. I say the bias is for low. Let’s get a closer look.

Just like the USD. Ever since Oct they’ve been moving down (almost straight down). And well, just like them again, heading into Nov we are seeing a bounce, right? Well, we’ll call it a bit of a correction from where they’ve been moving to. You can’t say this is a change in trend yet. Sorry.
How about some GBP index.

Unlike the last 2, I never changed their long standing bull trend yet. They’ve been trending high. That’s been their stated trend all along. But this past week shows some down movement, huh? Well, do you think it’s enough to cause a change in trend?
This is what I say.
No.
I’ll tell you where my line in the sand is.
Look back at the previous swing lows. Not the first one back, but the second one. At around the 3rd of Sep. I say that’s my line in the sand. If it drops below that point, then I say their trend has changed from bull to bear. But technically, it hasn’t yet. We’re only 44 pips away. Basically, we’re at an inflection point now. Therefore, we need this coming week to tell us, show us, whether it wants to continue on with it’s bull trend, or whether it’s gonna change to a bear trend. Just look back and you can see the same scenario over and over again. They just know how to bounce back.
Closer look at this.
Well, once again, here we go with the turn of the month thing. Look at what’s happened going into Nov. The 29th really started it. Boy, it sure does look like they want to turn this tide, huh? But look. We simply don’t know what’s gonna happen. Cause I could tell you the contrary.
The Pound is a very volatile currency. These big moves mean nothing. It can go back up just as quick as it came down. Plus this is a risk on leaning currency. And if the other guys decide the consensus to be risk on, well then guess what? The GBP could easily take that cue and move higher. Absolutely.
We’ll have to see what happens this week. But I stay with a long bias.
The CHF index.

I got to get some work done here.
Let’s see. What’s been their latest stated trend?
— It’s been a bear trend.
They’ve come down off the double tops. Couldn’t make any higher highs.
— They’ve consolidated around a support level for some time now. Looks like they made a floor to me. Right there at the -2000 level.
— Broke up and out of that. But enough to change their trend?
— Where’s the line in the sand to switch to a bull trend? As I just looked back at my notes, I see I called that -1000 level.
What happened this past week? Well, it went all the way straight up to it and touched it. Dropped down a tad, and went up over it now. I mean look, we’re all around it now. We’re at the inflection point. Here we go with the scenarios.
Will we have a break and retest of this level? Well, we won’t know until this coming week (geeez…how many things do we have waiting to see what happens this coming week…MANY).
Or who’s to say this won’t come right back on down. Just like it did back at the 2 mountain tops. Cause we’re right back at this area again.
I have no idea.
On the one hand, it broke up and over the level. So technically, I should change their trend to high.
On the other hand, I play the week. It’s time that’s the biggest factor. Meaning, WHEN. That’s most important. Therefore, I have incomplete data at this point in time. I NEED MORE TIME TO TELL ME. I need next week to come to reveal where the trend really wants to go in.
I’m forced to decide to keep with their low trend. I’m not gonna change this just yet. The prevailing trend is for short. I have to keep that for one more week.
Well, can I get any more good info from the close up chart?

Consolidated…consolidated…consolidated…then a shot higher, then one more time at the consolidation area (19th - 25th). Then after the 25th we’re going high. All this was at the end of the month. Which, if you look back at the other major currency’s, matched the risk off scenario.
They seem to have the momentum going for them.
So…it could happen…meaning a change in trend for the CHF. This would most likely mean a risk off sentiment change. But, again, I need proof. I need next week to show itself. I’ll make a judgement next weekend.
Let’s move on.
JPY index.

There’s no way I’m changing this down trend for a while. Let’s see. I did make that -10,000 line the line in the sand, to change their trend. But as I look at it now, I’ll even settle for the -12,000 line. I mean, you got to think of their sentiment. Nobody, and I mean nobody, is putting their money long the JPY. I’m talking for the longer term context. I’m not talking about the day traders. Or even those who trade within a week. I’m talking about longer time frame trading. Days to weeks. No one’s banking on a strong JPY yet. There’s no indication of that whatsoever. Maybe they tried back in the summer time when a floor was trying to be carved out. But that went right back on down lower. So no. No one is thinking a long JPY.

There’s no real strength being shown here. Only those who have money to blow will trade them strong, short term that is. But that won’t be me.
Let’s see what the Comms are showing.
The AUD index.

Well, I’m not changing my long bias yet. Yep. This past week it came crumbling down. But not enough to change it. Cause I’m calling that -2000 line the support level. And guess what? Once again, we’re at an inflection point, presently. And we know what that means. Another one more week to see period. What can I say? I did think, at one point this past week, that I would be changing some trends. But I’m not seeing it. Surely not with these guys. What would turn the tide? Below -2000. It didn’t even drop below it yet. So no. It could easily bounce from here.
Let’s see that drop closer.

Man…what’s that? That’s nothing. If that isn’t a nice easy retracement, then nothing is. Completely normal. Looks like a good time to buy the dip as they say. I’m just saying…nothing is telling me we have a change in trend here, that’s for sure. And they’re the weakest of the Comms, no less. Speaking of that, let’s move on.
The NZD index.

I’m sticking with their up trend. The bias is definitely still for long. Yeah, I put the support level at -1000. If you look back, it makes all kind of sense.
Being this much above the line in the sand tells me of more strength. Surely not weakness.

All this tells me is that the NZD is being supported. Seems like more strength waiting to happen, to me.
One more.
The CAD index.
I’m not changing their stated bull trend. Nothing tells me to. Let’s see. Where’s my area…I put the 0 line. And we’re above it.
Let’s see what kind of losses they’ve been having lately.

Well, just looks like been retracing down around 50% or so, right? Went all the way up to 1800 pips. Then came back down to around the 900 area. So yeah, about 50% retracement. That’s completely normal. Not signifying any kind of change. Especially given how much they boosted up since, look up there, around the middle of Sep. That’s a long time for a climb.
Well, there it all is.
What do I think?
I’m thinking I’m gonna keep my eye on the CHF. I mean, you got to wonder where all their strength came from. It seems like a safe haven play to me. It’s like the markets’ favorite one to go to.
Do I think this currency will make all the difference?
That is a good question.
Cause if the market starts selling the Swiss, then that would mean it would be a risk on type sentiment. Right? And that means the Comms would benefit from that sentiment. AUD, NZD, CAD, even the GBP. This would mean that the trends that are in place already would keep. Would get stronger.
What if the CHF keeps up the buying (that has just happened)?
Then we would continue on with the safe haven buying. The Comms would be on the other end of that. Therefore, we would be encountering a market change, then.
Next weekend at this time I could be changing a lot of the currency’s stated trend (as I’ve said above about a lot of them).
I believe we are at an inflection time. The market should show us in which way it wants to continue on going. Now, I’m not saying it’s gonna happen right away. Cause you got to look at the days of the week.
Monday’s. — They seem to go in a screwy way. Not necessarily with the trend. Actually, more against the prevailing trend. Liquidity is the lowest that day of the week.
Tuesday’s. ---- Sometimes called turn-around-Tuesday. Whatever happens on Mondays this turns it all around. Whichever way that would be. But things are definitely trying to get moving by this time.
Wednesday’s. — Characterized by some big moves. By this time, all the big players are in it. Sure, you got to know what’s already happened by this time in the week. Momentum can very easily take place this time. But volatility is highest so far in the week.
Thursday’s. — Since I keep track of volume, I know that this is the day with the greatest amount of volume taking place (for a complete day). Imagine a staircase drawing. That’s how the week progresses. But this is the top of the steps. Friday’s come down from here. But again, it all depends on what’s happening in the market. You can possibly have momentum going on. Or you can have another turn, from Tuesday’s turn. And also it depends on what kind of fundamental events that are going on. Like the Bank of England had this past week. Just know that the volume is the most here.
Friday’s. — Characterized, mostly, by profit taking. Rarely does things move in a straight line. So whatever the trends happen to be by this time, it usually goes by retracements on this day. I think of this day as an equaling out day. It’s more rare for this day to continue on with whatever trend is. Unless it’s a very strong one (which of course does happen in the market).
Look. The market is not that predictable. I’ve seen many different scenarios.
- The market goes one way for the first half of the week. Then on the last 2 days of the week it retraces that strong move.
- The market moves strongly in the beginning, then takes a breather mid week, then goes right back to that strong trend by the end of the week. Classic, on paper, higher highs.
- Then you can have such a non moving market until Wednesday. Then bam! Off to the races we go, all the way to the end.
I mean, we just don’t know in which way it’ll go. So much depends on when the fundamental events occur also. But as it stands now, we just had NFP Friday. The market usually lets us know what it thought of the results of that day.
Alright Journal, I’m done talking.
Sorry to talk you ear off.
Been fun and now I feel better. Thanks!
Mike
1 Like
Good morning Journal.
Let’s see. There’s only one thing I should talk about this morning (well, let’s hope it’ll be only one thing). It’s a follow up on what I talked about last weekend. I, absolutely, need to continue on with the story. The market narrative.
See. I believe a lot of analysts, traders, and all those in between, conveniently forget some recent history. And I think this is a real short coming. Look. I know we all are forward looking, speculating type people. There’s nothing more we like to do than to project what we think is gonna happen in the future. I mean, it’s the nature of what we do, right?
But what I think is just a little more important, and something we shouldn’t forget about, is looking at both the history and the present time with more fervor than trying to speculate what should happen.
That’s nice.
Well, this is precisely what I’m gonna not do, and gonna do, this morning. Cause, boy, did I write some stuff last weekend that hinges on whatever is supposed to take place this coming week. It would be so short sighted to not tie up these loose ends. That’s all. So, here it goes.
Where was I?
Well then, let’s look at what the CHF did.

Top table is the individual daily results. Bottom is the weeks running.
We’re looking at the pink (CHF).
Well, on Monday they started out with being the most sold off currency of them all. Very interesting. Along with the USD. Ok. So. What can we say then?
Looks like some risk off started the week off. The Comms were up above, so that confirms that notion. Then Tuesday (remember…turn around Tue) came in with the opposite. Yep. Looks like the 2 safe haven currencies (CHF,JPY) took the cake. Most bought up currencies. The USD was in the positive also. And the Comms came in dead last. Definitely confirming the sentiment.
Well, I want to keep with this one point. The CHF. They didn’t really do much at all in the rest of the week. Just dead. And I’m thinking the SNB had everything to do with that. Cause you have to see that, I believe, Tue - Thurs was nothing but safe haven buying. The other 2 stepped up to the plate. And also the Comms dragged bottom.
So. Bottom line, with the CHF.
Strength shown. It was on Tuesday. That’s fact. And I’m gonna call the rest of the week the SNB intervening to keep them off the top. But it was more of a safe haven buying week, than anything else. Well, this was continuing on from last week.
Ok. Now I need to remember this, before I’m done. The question will be, will I be changing these currency’s stated trend?
I’ll come back to this.
But moving on now.
I go on to mention how the days of the week typically go. Of course every week goes differently. Well, how did this week go?
I just mentioned this.
Monday came busting out with risk on. That happens to be what the broader market trend is. Then Tues - Thurs went in the complete opposite manner, risk off. Then Friday went back and retraced those losses. Which was back to the risk on sentiment.
Now.
What about this inflection point?
Did this past week tilt one way or the other? Cause that’s essentially what I was saying.
Ok. 2 days going with the trend. 3 days going against the trend.
That means we should have had more of a tilting, or a change in market environment now. Well, looks like we got to measure this. How we gonna do it?
Why don’t we just go down the list and pick 'em off one by one and determine their trends. Remember. When we talk about the market, what are we really talking about? Well, the sum of all the parts. And each of the 8 currency’s are the parts.
From the top.
The USD.
I was calling the 1000 line the dividing line. Even the 500 line a secondary S/R line.
Well, this week blew all that away. I mean, look at what just happened at the 1000 line. Bouncy bounce it goes. Therefore, I call this a change in trend.
The USD was on a down trend. Bias was for short. Ever since that latest steep decline. But it changed now. It’s surely not short anymore (in my mind, it’s one way or the other. I don’t go believe in ranging or consolidation notions). I believe the market wants long now. Plus, it follows any kind of chart reading rules. It didn’t make a lower swing low. It’s on it’s way for a higher high now. Plus…I got to say…this weeks long, straight up leg, is quite large. That tells me a lot. It’s what the market wants.
Ok. That’s enough rationalization. Those are my reasons. It’s what I got to do.
I got to change the USD to a long bias.
This is how I follow. It’s not what I want (trust me, I wish otherwise).
And if this proves to be a false break out, then so be it. I’ll change it when it shows me. And where will this end up to be?
I would say their aggregate pip movement will have to go down back below that 1000 level. And then eventually it will have to go below the 500 line.
Also. I only change these trends on the weekends. Cause I believe the market plays it a week at a time. 5 individual dynamic days of the week, rinse and repeat.
It’s how the market works.
Oh…one more thing.
What are we talking about here, again?
One thing, and one thing only.
DIRECTION
It’s the bias we got to give each currency. I think that’s one of the biggest factors to overcome, when it comes to trading an asset.
Sure there’s other factors.
- What asset to trade?
- Where to get in?
- Where to get out at?
- When to get in?
- When to get out?
- How much to put on?
- Risk management rules in place.
- All rules outlined, and followed.
One thing that I have learned this year, for myself, is that the when to get in and out is to be substituted for the where to get in and out. But when I think about it, I guess you got to be going with one or the other. In any case, these are all factors to be considered. Are all very important, absolutely. But if you get the direction correct, then the rest should make it easier to manage. Cause even if you get the direction correct, that doesn’t necessarily mean you will be in the positive. It’s the oscillations that we always have to deal with.
But that’s why I feel that TIME is the biggest factor.
Sorry 'bout that nonsense.
Let’s move on.
The EUR.

I have them on a short bias.
Their trend is for low.
Well, did it go up and above that line, this week?
Nope.
It touched it and then dropped back on down. So no changing their low bias.
This was last weeks shorter term look.
Let’s see what this week did.

Yeah boy, it wanted to break up and over the top of that V part, huh? But in the last day it came back down to it. So, I’m still not seeing a change in trend yet. Actually, it can’t end up in positive territory for the last 30 days. Interesting, I think.
The GBP.
So what happened?
Well, we are at their inflection point alright.
And we’re all around it still.
How about some exact numbers. The line in the sand is at 9746. This past week dropped to a low of 9750. 4 pips away! And now ends up sitting on the 10119 line.
So the answer to the question of whether this changes trends is a no. Not yet.
I guess we can have more than one inflection times. Cause we’re at it again. Right? Next week can be the tell of whether it wants to continue on with it’s trend, or if it wants to change stated trends. But until then, I have to keep the Pound with their long standing long bias. It never changed over to low yet. Actually that’s for the entire year.
It’s not making higher highs, yes, I know. But it’s not making lower lows either. Therefore, I stick with the prevailing stated trend.
That’s nice.
The CHF.
As the SpongeBob show would say,
“One week later.”

Well, they had their chance. And couldn’t do it. See it? They actually ended lower than where they were last weekend at this time (cause they were above the line…but not now). But, man…just like with the GBP. All around it this week. Therefore, I still can’t call the CHF changing to an uptrend. Boy…I’m sure the SNB has everything to do with that. They got to be spending the money to keep this from moving up. We’ll see who wins out. The market, or big brother.
Before I move on. Let’s take the closer look. It’s worth it with these guys. Cause remember this?
"One week later…"

Look. No doubt. It’s elevated. I think the battles ensuing as we speak. Who knows…it really could go anywhere from here. Higher, of course. Or back down. Don’t know. Again, we need a little more time. The market will show itself. Is lower though than last week. That is one thing we know for sure.
Moving on.
The JPY.
I’m skipping to the shorter term look. Here’s last weeks view.
And this is the latest.

What? A little strength are we seeing here?
Well, I’m not fazed at all about it. You got to take all things into consideration.
Like all the history.
Needless to say, it’s not enough to change their stated low bias. Is interesting though. It confirms the safe haven bid we had in the middle of this past week, right?
How about the AUD. Where were we?
And here we are.

Ok. Here we go.
I got to change their stated trend.
- It went below the line in the sand (-2000).
- Making lower swing lows
- Matches the opposite of the USD (cause I changed them from low to high).
I got to go with what is. Again, I don’t want to do this, but this is being true to what is, and what was. The future never comes (cause when it does, it’s the present).
That’s nice.
I think we need to see check what I said last week on this shorter term look.
You can tell I am hoping they don’t end up changing their long trend. Right?
I’m sorry, but I was biased.
Need to go with facts.
Let’s look at what happened.

Now this is the more that we need. Can’t be in denial forever, right? This isn’t showing any signs of wanting to continue on up. And yep, that last straight down, steep move is being confirmed more and more now. Down it’s going.
Again. Anything can happen in the coming days, but with what we have up to this point, tells me to change their trend. Low it is.
How about the NZD. Following suit?
Well, where were we to begin with?
More of the story.

Wow. Well, Mon (you should remember) they were the most bought currency that day. It’s how the week started out. It shows right there. Hit a pretty good high point. But then fell quite far, since.
Did it fall below the line in the sand?
Nope. It didn’t.
Now. I don’t want to be someone who is so particular and rigid, cause you can’t really be like that in regards to the market. Got to be flexible. And understand anomaly’s happen. And especially when it comes to these guys. They like to overshoot things. But when I step back and see what’s going on here, I still don’t see a good reason to call a change in trend. You can’t deny that the -1000 line is a good S/R level. And well, it didn’t drop below it. Therefore, I can’t change their trend. The bias is for high.
I’m sorry. What we have is a divergence happening again, between the AUD and the NZD. That’s all. What can I do? I’m not gonna get burned again thinking I know what’s gonna happen with these guys. I just don’t know. If they want to be high, then it could stay this way. This is the info that I have now. I go by that. Nothing else (like speculation nonsense).
Must look at the shorter term. This is what I said last weekend.
Anything different this weekend?

Well, I got to say it. Seems like the same thing here. Their being supported.
There’s no bias in that. It’s what the data shows. Looking back at that huge move upward, is not being retraced much. Until then, we got a long biased NZD.
Finally, the last one.
Fast forward a week.
Up and down, of course. But it didn’t move below the 0 line. I keep them with the long bias. Nothing tells me to change this. I mean, and plus, it really hasn’t even retraced half of that humongous move higher, yet. To me, that kind of means that it’s still fresh in the minds of those in charge. In fact, I do believe all moves mean something.
Ok. I digress. I got to go there.
Yes. All moves mean something. Think about it. The only thing anyone has is what happened in the past. I mean, it’s the thing that levels the playing field. For everyone. And I’m glad. Maybe the new traders that come into the market don’t realize that. But it’s what we got to learn.
The old, well experienced, veteran traders know very well they don’t know what’s going to happen. They’re smart enough, and have the experience under their belt about what’s going to happen. You play the odds. It’s the best thing to do. And then you get to the point of knowing that surprises happen all the time. Honestly. They do. Older traders know this very intimately. Time and time again they get surprised and know that it’s what happens in the market. Their not gonna lose their butts like they used to. That’s all. It’s the difference between a grown up trader and a new trader. Experience makes you into a better trader. Actually, a real trader. And when it comes to putting your money where your mouth is, you just do it more smartly the older you get.
But getting back to the narrative, I think an experienced trader reads the market in a more correct way. All the movements have moved for a reason. The market remembers! In fact, that’s how trends are defined. It’s a continuation of a certain direction. Over time, though. Maybe not in the immediate sense, but in a drawn out longer sense, definitely.
Alright. I’m done babbling.
It’s how I think.
All this stuff is what goes through my feeble little mind. That’s all.
Well, that’s how I think they lay.
A recap of this inflection point type of week, goes like this.
- The USD changes from a low bias to a long bias. Trend high now.
- The EUR keeps their low bias. Trend is for low.
- The GBP keeps their high bias. Trend is for high.
- The CHF keep their low bias. Trend is for low.
- The JPY keeps their low bias. Trend is for low.
- The AUD changes from their high bias to a short bias. Trend is low now.
- The NZD keeps their high bias. Trend is for high.
- The CAD keeps their high bias. Trend is for high.
4 high trends against 4 low trends.
Alright Journal, I’m done with all that …(you know what I’m gonna say).
So, when the open takes place, I’ll change this on my perpetual running basket of trades. It’s only so that I know how the market is trading, trending. It’s my way of keeping track of things.
Alright Journal.
Thanks for listening.
Mike
2 Likes
Good morning Journal.
Well, I’m just sitting here wondering where I’m gonna go today (as is usual).
See. Sometimes I’m not struggling with the topic of discussion. Like last week.
Yeah man, that was fun. Some weeks I just got it. It’s waiting to jump out here on the page. And other weeks…well, it’s just not there.
Don’t get me wrong. I do love talking about the market. I guess sometimes it’s more fun than at other times. I’m not too sure exactly why. Maybe it’s me. Cause there’s always something interesting happening in the market. To some extent anyway.
But then sometimes (like now) I’ll remember the purpose of this journal, to begin with. And that would be about, what’s going on with me? Not so much as what’s going on in the market. There is a difference. And so, that leaves me with the thinking of what’s been going through my head this week. Cause there’s always something rolling around up there in regards to the business. My business.
I mean look. I pray for a lot of things in life. Not just for specific people. Surely, this business of mine, is a topic I visit quite often when it comes to the things I bring up to Him. And guess what? There have been some things I’ve been searching and striving out for concerning my business. Therefore, I want to go there now.
Before I forget, there’s a couple things that I’ve been pondering lately. I do want to expound on these before they slip away.
- My future, in regards to a vision. Maybe changing.
- A thought about how my strategies should be. This has been a subject that I’ve been wanting to get to the bottom of. But always forget about.
Let’s see. Where should I go first?
Well, I’ll save this strategy thought for last. Cause I think I really need to start on it. See. I know we’re getting close to the end of the year. And I have a little on my mind about what I should be doing next year. But, it would be nice to have something set up already and to be carried out in '22. We’ll have to see though.
But first. I want to talk about what’s been rolling around in my head this week. It’s the bigger picture. For me. Like…I’m talking…the big picture. So. Let me give it to you straight and then I’ll start explaining.
Vision related.
My retirement aim.
I think this would be something to shoot for.
I think this would be my promised land.
I guess this thought of mine was brought up from a conversation me and Trish had recently. And it had to do with what our retirement would look like. This is what I told her.
I honestly do not have it in mind for me to retire. I cannot see myself as retired from work. I’ll always work.
First off, I should give a definition of what I think retirement actually is.
It’s when you are done working.
Meaning, no deadlines. No responsibilities. No striving after money, in which you need to live on.
But, reaping all the benefits of a life savings. It’s the time where you are not putting in anymore. It’s the time where you are taking it out.
Ok. That looks like a good definition of what retirement should look like. Right?
Well then, that’s not gonna be me. I mean, it can’t be. I haven’t been able to store up, plan, stock pile any kind of finances for this time to come. Plain and simple.
I’m 54 right now. And what am I talking about?
We’ll call it 11 years from now. When I’m 65.
That should be the time when I, theoretically, should be retiring.
Ok then. I got 11 years to go. Can I save up enough money in this amount of time?
Are you kidding me? No way. I won’t even go there. Cause first off, I don’t make any money nowadays to begin with. All my savings go to my Christmas club that I do on a yearly basis. At least I can enjoy that dynamic, regularly.
But then I got to thinking. My promised land is not retirement (as most folks seem to have it). It’s my business!
That’s my retirement!
This is not work. This is not laborious. This is not stressful (well, for the most part). This is not hard. This is not a taxing effort on my body, soul or spirit.
This is what I want more than anything else on this planet.
It’s the dream I’ve been wanting for most of my life.
My own business.
It’s this thing I’ve been trying to build. From the ground up. All by myself.
And one of these days I want it to be completed.
So why not make this my retirement goal?
I can continue to work and retire all at the same time.
What I’m saying is that this is killing two birds with one stone. Like why not?
If I can support our way of life, while having much more time on our hands, all at the same time, then why not? I even wrote it down somewhere that I want to support Trish in where she won’t have to work anymore. Now that’s retirement!
Well, this is what I want. And I’m thinking of drawing up another vision statement on it. I guess it’ll coincide with what I have already. I guess this would be a specific thing to shoot for. Like time wise.
So then, what do I got?
I got 11 years to go. Now…if that ain’t enough time to accomplish something, then nothing is. Let’s put this into perspective.
At the end of this year, between Christmas and New Years, I will have completed exactly 9 years on this journey. My business journey. I think I’ve learned quite a bit during this time, so far. And probably have a lot more to learn, no doubt.
When I think of what I’ve learned, this is what comes to mind. And it’s something I’ve been working on this year. You should Journal, cause it’s all in here. In fact, it’s been a yearly theme for me.
This was at the end of 2019 going into 2020.
And then this was at the end of 2020 going into 2021. A year ago now.
My only point here is that this has been on my mind every year for a while now. And when I think of how I have been navigating this pursuit, have I actually been getting somewhere by now?
I think so.
I’ve narrowed down about how much I would need to start out with. It’s much more than what I was thinking a couple years ago.
And the strategies are coming together. Sure, I’ve been changing things up. Some things stick and some things don’t stick.
I know, and have read, that I’ve always been wanting to continue with one kind of strategy and to prove it over and over again. Like to be able to trade with no changing of the strategy. Yeah, I definitely see that’s something I’ve been wanting.
Sure. I mean, there’s a reason why you need to keep changing things. Probably because it’s not working. And when you can get to the point where you don’t need to change things, then it’s probably working. You would move on to other type of strategies though. So yeah, I’ve been going though changes after changes, year after year.
So then. Looks like I got 11 years to get this under control. Think about it. Should be enough time to accomplish it, don’t you think?
Wouldn’t I like to see this before I really and truly embark on my business in real time. Really.
At least one complete year of simulation trading.
Having 12 months of verifiable proof of;
— how I traded.
— profits and losses
— cash flow statement
— how all my expenses got paid for (paid myself)
All without having to continually change things.
Well, there’s only one other thing that I would need.
Money.
Enough money, to be exact.
And I’ve been down this road also. I kind of learned the hard way.
This was back at the end of 2019. What a year that was for me.
I thought about this factor.
Should I embark on an 11 yr journey to come up with the amount of financing I would need?
And well, it’s still a thought, at this point.
I just don’t know.
See. I’m not in control here.
But I do know who is.
And if He wanted to plop down the amount that I need, then I’m sure He could in an instant. Just like that. I believe it. It reminds me of His chosen people Israel. He was giving them the promised land. It was all for them. Did they have to work for it? No.
All they were to do was go in an possess the land. It was all ready to go. It was the land of milk and honey. And built up and livable. It was their inheritance.
But what happened?
The were scared. Some of the recon people came back and told everybody that there were giants in the land. Basically, the people wouldn’t come to trust in their God. God told them that He would go before them and would rid of all the inhabitants for them. They wouldn’t have to do anything! He could use a swarm of insects to drive them all out, if He wanted to. But they just wouldn’t believe.
And so, what happened?
That generation would die out and the next generation would be the ones to go in and take possession of the land (40 yrs later). They had to battle their way through it though. But even then, He was with them battle after battle. All they had to do is obey all along. And it happened. They eventually got it. It’s the history of Israel.
Well, my promised land is going to be a retirement time of my life in which I will be able to run this trading business full time. Fully self sustaining. In which Trish won’t have to work anymore. And I won’t have to work anymore either! Cause this is not work to me. Are you kidding me?
And one which will be fully funded with the right amount.
Don’t quite know how yet. That’s His job. He’ll show me.
In the meantime. All I’m doing is continuing the simulation theme. Practicing how I’m gonna pay myself every month. Prove and show how it will happen. Continue to build the process.
Sorry about that Journal. That’s a lot of nonsense.
But it’s what I’ve been thinking a lot about.
I’m gonna continue on with this line of thinking when we get closer to the end of the year.
But there was another point I wanted to make.
How about I just start the discussion. I need, though, to embark on this.
Concerning strategy.
In the last few years, I’ve been working on my Anchor Trade.
But for the longest time I’ve been wanting to develop a strategy (strategies) that have this component to them. It has to do with TIME.
I want:
- A long term strategy
- A medium term strategy
- A shorter term strategy
See. I don’t want to have to depend on only one particular strategy. Cause we should all know by now that one strategy is not going to always work out, as planned. Right? Well, what about multiple ones?
What makes more sense than to have some back up ones running?
This past week I thought maybe I should go with this.
Since I keep track of these time frames that I should develop the same.
- Yearly
- Quarterly
- Monthly
- Weekly
Well, I got the data that I can go back on and analyze with. Some back testing analysis. Right?
To be more specific, I’m talking about a strategy in which I’ll have a trade (well, I think it’ll be one pair, not all that sure yet) that runs for the entire year. Perpetually. And some how able to work the position sizing all along that time. Maybe even like taking some profits along the way. I don’t know yet. But something like that. A one year trade.
Then one for a quarter. That’s a 3 month long trade. Now I don’t know about taking profits along the way, cause that’s not all that long amount of time.
Then one for a month. Just looking for some profit. That’s all.
Then the shortest would be for a week. That’s absolutely the shortest I would go. And I’m not talking about even for the whole week. Cause I do have a strategy parameter that uses the week as a whole. I’ve talked about this before. And I like it very much. You wait out the first 3 days of the week. Then get in on some kind of flow (Wed or Thurs) and take profit before the week ends. That’s the shortest time in the market I would want to do.
Anyway. I was thinking about this. In fact, I believe I had this idea way back in the beginning of my trading career. And looks like I never followed through with it.
It’s like diversifying your strategies. Sounds like a smart idea to me.
I don’t see anything wrong with coming up with an anchor trade for each time period. But I think I have some work to do first. The back testing I talked about.
Remember. I’m not keeping track of these daily stats for nothing. It’s what I do. It’s what I like to do. But I should use them for this purpose.
I’m not too sure if I can come up with something before the new year starts. We’ll have to see, though. I do have some time coming to me around the holidays. That’s some of the perks of working for a school district. They always seem to have days off (compared to a real job out in the work force).
Speaking of that, it’s starting this week. We only work through Wed. Then off till next Tuesday. I will be having some time on my hands. And I think I’m gonna get on this. Like really. I can see a mind map coming. I can see some pencil and paper writing, in my business journal. Many early dark hours of the morning time, when it’s real quiet to think about all this.
Ok Journal.
Well, that’s what’s been going on with me.
Thank you very much for listening. Cause remember, it has to be you. There ain’t anyone else to talk to about this stuff.
And now I feel better!
Thanks!
Mike
3 Likes
Good morning Journal.
So. This is what I’ve been up to.
I’ve been wanting to answer the question of whether this particular strategy would be the way in which I should trade (my long term trade, next year). Here’s the details.
— A year long trade.
— One pair running the entire year.
— Does not have to be the same asset the whole time.
— The determination of the pair will be whoever is the strongest and weakest on my yearly running table.
Well, I have some results.
Interesting.
But seems like I have more questions than answers now.
And that’s why I’m talking to you about this, Journal.
To start things off here, it should be understood that I only back test off of my own historical data. So all I’m doing is working off of my excel spreadsheets. Therefore, at the present time I’m a little lacking on how much time I can go back to. But even that can be debated. Cause I’m not so sure years and years of historical data amounts to anything. Think about where we’re at now. We are in a different era, than ever before. Given that, I’ve uncovered some interesting aspects.
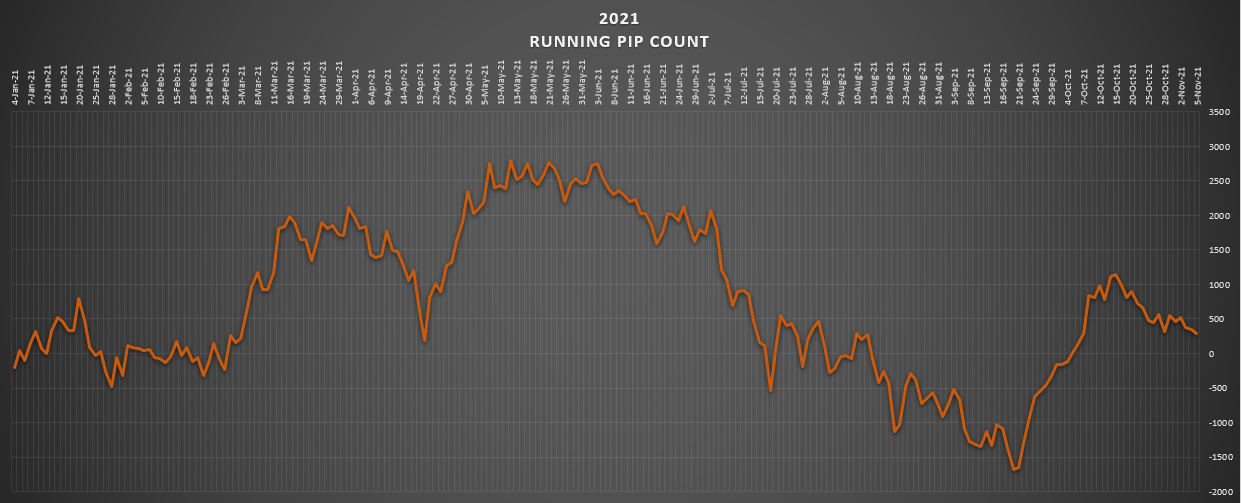
I completed this year of a back test. 2021.
And I completed the year 2020 of a back test.
I’ve just started on the 2019 year. And plan to go back to 2018.
But what are the results so far, if I would have traded this strategy?
2021
Let me explain how I do this.
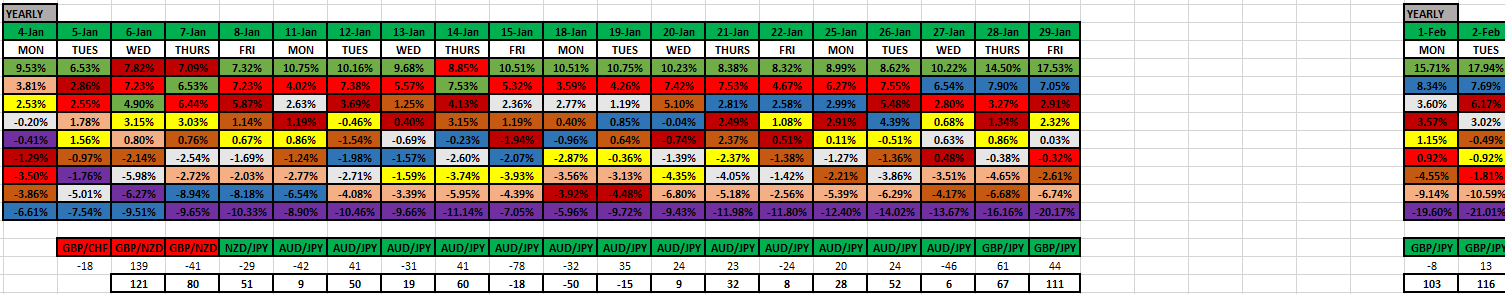
Here’s a sample month.

Well, I need to know which method is better. Picking the strongest and weakest % running pair. Or picking the strongest and weakest running pip count pair.
So. You got the top half, which is the % count. And the bottom half, which is the pip count. And in the middle is the totals. Compared side by side.
As you can see, both sides are in agreement with the GBP/JPY pair being the pair traded. And all I’m doing is adding up the daily pip results, on that pair. And keeping a running total for the entire year.
Let’s get to some results.

- Picking the % spread pair is the way to go.
- Very positive for the year.
- Presently ending around 2000 pips in profit.
This is pure vanilla. Meaning, if I picked the strongest against the weakest pair, from the % table, without any kind of tampering done to it, then this is that result.
Position sizing is not being a factor, at this point. That would be another back test.
But this simply tells me that this might be a viable option. For a long term running trade option. Right?
I should mention exactly what trade(s) were running, during this time.
By the shear fact of this method, you’re gonna have a very mixed up month of Jan.
This is the starting point of the count. Therefore, there is no way for any currency to start on an established trend yet. It’s way too soon. There’s not enough time passing by yet for all the players to have a consensus on something yet. And even then, if that does come to be, then who’s to say that should continue? That would make it too easy. Since when is there something easy about the market?
Anyway.
After this point, guess what?
We do have a consensus about which currency is the strongest and which is the weakest. The GBP on top, and the JPY on the bottom. This all started in Feb.
Well, this did not change for the whole entire year. Can you believe it?
That even stayed true for the pip count running method (that’s why the two lines above stayed equal apart from each other the whole time).
2021 was the GBP/JPY show. Plain and simple.
Sure. Someone (probably all traders do this) could just look at each and every one of the 28 pairs’ charts. If you would compare them all, and you were looking for the biggest mover, for the year. This would be the best pick.
First off, I don’t believe in charts.
I refuse.
I don’t.
And I won’t.
Look at them.
This is the biggest deceiver among traders. And everyone wonders why things don’t work out the way they want them to. It’s because of the charts.
I’m sorry.
But the answers are not there.
The secret is out.
Anyway. Where was I?
I come to the conclusion of the GBP/JPY pair to be the best pair to trade because of the % daily spread conclusion. It’s the widest. In another words, strongest to weakest. That’s my reason. Surely not because of what a chart shows.
Moving on.
The year 2020.
Results.
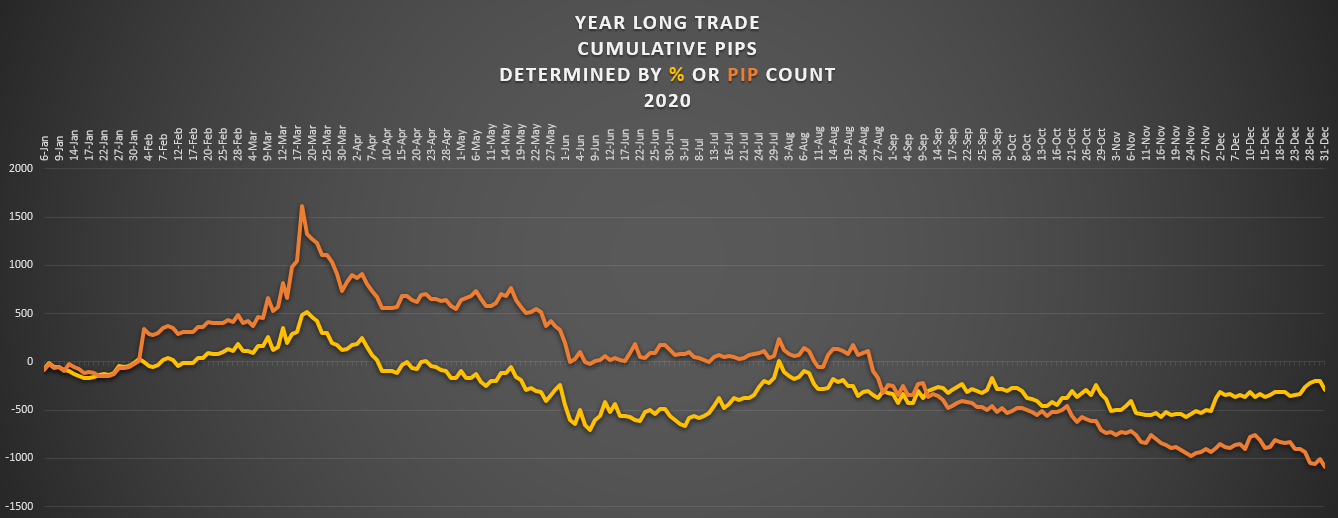
Different story here.
Probably because the world got upended. And this started the new era.
- Both methods end in negative territory. But the % method fares better.
- When the volatility goes haywire, going with the pip count method is better.
Let’s see what the month of March looked like.

Now you can see the difference between keeping track of the %'s to keeping track of the accumulated pip counts.
Bottom line here is that when volatility is high, picking the biggest spread of pips pair fares better than picking the biggest spread of % pair. That’s in the middle.
Let’s see. What can I say about all this?
First, I guess, I need to ask the questions.
- Is this a viable yearly trading strategy?
- Have I gotten enough back testing data to prove this?
- What is it that makes this work or not?
- Will running '19 & '18 prove anything pertinent?
- Does polarization (how clear a pair to trade) make that much of a difference?
I need to talk about that last question. This is what I’m trying to get at.
This year ('21) was a success (profitable) because it was a no brainer of which pair needed to trade? The GBP was on top the whole entire time. It was strong. I have all kinds of data to support that. And the JPY was weak the entire time. Same thing here. Everyone knows how much of a depreciation they went through this year.
Is it because of this one fact that this strategy worked this year?
I’m kind of thinking yes.
That’s why I’m calling it polarization. The market went by way of some real long slanting. The strong got stronger. And the weak got weaker. Like, all year long, so far. And this very well could be the one and only reason why this strategy worked out. This is not what happened in the year before. We had some real turns, last year. The USD got real strong. Well, all the safe havens did. All this was exponentially compounded in the month of Feb and March. Maybe even a little April. But then for the rest of the year it went by way of the opposite. It was all risk on.
But does that really matter though? We’re talking about who’s on top and who’s on the bottom here. Right? Does it really matter what market environment we are in?
Probably not.
Well, then, what explains what happened this year?
Having 2 anomaly’s? GBP, JPY.
Like, the perfect storm?
Will every year prove a different scenario? Results?
All I want is a viable way to have a trade run all year long, to take advantage of a possible anomaly. Which should be profit. But I’m not gonna know whether this happens until after the fact.
And you would think it should happen when you’re sizing them all up and taking the top and bottom currency. If the gap is large, and is long running, then that should spell some kind of profit.
It’s a chance. That’s all. I don’t know whether it will occur or not. But I think it’s worth a chance to take.
How about some amendments to the strategy, to ensure it’s viability?
Like taking some profits off the table along the way.
How would I do that?
Well, I need to take advantage of the time that I have. That is something I know for sure I will have on my side. This will have all the time in the world to play it out. I’m wondering, along the way, is there a way to compound profits, when it comes. And on the other hand, is there a way to minimize losses, when it comes.
Invariably speaking, the only way will be through the position sizing. Right? It’s the how much that I will have on it. I don’t see any other way. But how?
I’m just gonna throw some stuff out there. Like, how about every 100 pips of movement I take some action. Either add on some position sizing (moving in my direction). Or subtract some sizing (moving against my direction). Or take some profits off the table. I don’t know. There’s got to be a way to compound on the profits that are had, and minimize the amount of losses that are had.
Ok.
I’m getting lost here.
I think I need to quit. Typing. I’m just not getting anywhere.
I’m gonna proceed on with seeing how '19 & '18 years turn out.
What can I say Journal? This is precisely what I’m going through now.
Maybe some ideas will come through as I churn out the data. We’ll see.
I need to remember that all of this originated with the one idea I had. And that’s going with the dynamic of the strongest against the weakest pair. There’s got to be other ideas. To capture profit for the specified time frame. Something would be telling me which pair to trade. All year long.
Well, if that’s the case, then how about a pure discretion trade. I mean, if it’s all about what particular pair, which doesn’t have to be the same one the entire time, then why not my own pick? Whatever the most outlier pair I can find, on a weekly basis.
I could go with:
- The pair with the highest volume.
- A bell whether pair, AUD/USD or AUD/JPY, and pick which sentiment the market is presently in, either risk on or risk off.
- Determine which 2 currencies have the strongest trends and trade that way. A copy of what this year did (GBP & JPY).
- Copy last years dynamic. Stay with the biggest moving ones, USD & AUD.
Yeah, I wonder what dynamic I can dig up for '19. And even '18. Surely there is some kind of theme playing out. Even if it’s nothing but the back and forth kind.
Alright Journal.
I got some work to do. Continue.
Thanks for listening to that stupid stuff.
I’ll keep you up on what I’m gonna do.
Mike
1 Like
Hi Mike,
Again, good to read your journal. Over such a long period, fundamentals really matter. I have no idea about the JPY, but being a Brit, I have a very good idea about the GBP. It has been moving progressively weaker against USD most of this year. The macroeconomic issue has been the settling in period after Brexit (British exit from the Eurozone of economic trading). The short term effect in late 2020 and early 2021 was as many had predicted - that the UK would suffer in the short term with higher costs higher business uncertainty and weaker Pound. The weakness relative to the USD has surprised me. My wife and I had run a physical goods and services trading company since 1993 in the Middle East, providing equipment and first line support to oil and gas companies. Over nearly 30 years, we used a fixed GBPUSD rate of 1.50 and a fixed EURUSD rate of 1.00 for our internal accounting. 90% of our goods purchases were in either USD, EUR or GBP, and our customers’ preferred payment currency was USD - par for the course in the oil and gas industry. So we have carried currency risk most of our working lives, and have those exchange rates firmly planted in our heads. So for me a “strong dollar” means about GBPUSD = 1.20 and a “weak dollar” means about GBPUSD = 1.80. Same for GBPEUR with strong EUR being 1.10 and weak EUR being 1.50. If I were to start off a one year plan starting in Jan 2022, looking at the very long term averages, without wishing this to adversely affect your thinking, I would be choosing an initial direction as follows:
EURUSD - Euro weakening, trading range 1.20 to 1.05
GBPUSD - Pound weakening, trading range 1.40 to 1.20
EURGBP - Choppy, trading range 0.85 to 0.77


1 Like
Good morning Journal.
And thanks Mondeoman!
Definitely good stuff there man. Very interesting.
Well Journal, here we go.
This is not gonna be fun.
Is was wondering what I was going to do in here. But then I remembered what I had to do. So I got to work. And just finished up.
And ok.
I guess this was my answer to what I should talk about this morning.
Trust me, this is not going to feel good. I’m about to swallow a very huge humble pill.
Well, I’m not going to break my streak of monthly journal summary’s.
And that’s what I had to do this morning.
November journal
November trading results
Mind maps.
I had the goal, for this year, to have a summary for every month. So far so good. And I’m not gonna blow it this late in the year.
But I have to be honest with myself, of course.
It was a bad month.
Well, the good thing is, that I’m not going to explain anything. All I’m going to do is throw out to you my 2 mind maps (cause I don’t think I have the strength to talk about this).
Here it goes.

That’s a weekly chart. Had to be zoomed way out to see the big picture.

All that should explain everything (cause I don’t want to).
Look. I had a great month last month. Figures. This month upends everything.
Maybe I could feel a little better if I shown you a summary of my pay myself.

The only thing that makes me feel any better is that I forgot that I have that extra available equity account. I’ve been trading only with 1/3 of the total amount that I have.
Well, all that means nothing.
Money.
What’s my issue?
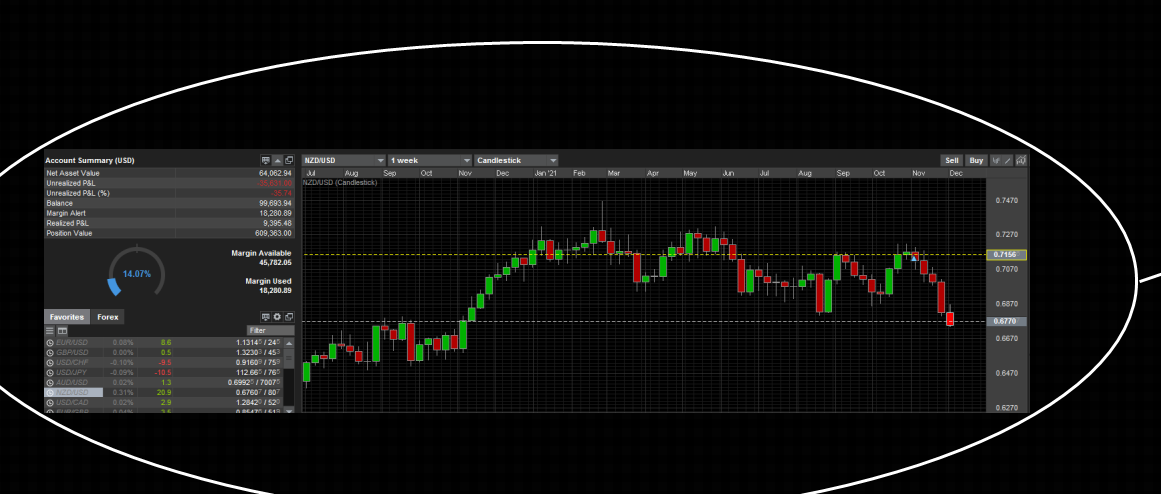
It’s with my one and only trade.
I did say this before. And it is still true.
I haven’t lost anything yet, cause my trade is still open and running. I’ll prove it.
Here’s a shot of what my broker has on file for me. Look.

This is when I opened the trade. You can see it there.
But you got to scroll over to the right to see all these other categories. Look.

See what my account balance was when I opened it? It’s there on the right.
But look at the daily financing rates column. Every day that gets taken out and subtracted from the account balance. Messed up, huh? I know.
Don’t ask me what that is.
I kind of think that’s what they call the interest rate differential rate that needs to be balanced on a daily basis. I think. Honestly. I’m not too sure.
Would it make a difference if I knew what it was? Probably not. Not at this point in time for me anyway.
I’ll visit this aspect down the road, Journal. Or if I ever trade a strategy in which takes this into account. I think it’s the carry trade strategy.
Anyway.
If you scroll down the right side and see the account balance, all it’s doing is taking those financing fee’s into account. That’s it.
Look at the latest.


So. My whole point here is that my account is not reflecting the loss that it’s actually at right now if I closed my trade. But the thing is, it’s not closed yet.
I’ve said it before, and it is true.
I have not lost anything yet.
But Mike…don’t you need to protect the account?
I know.
It’s a game of chicken.
Theoretically speaking, if my account balance get’s low enough they’ll shoot me a margin call. I understand that. I’m not unaware. Of course. Come on.
Yes.
I’m faced with my greatest fear.
The draw down that just might not be recoverable.
I’ve encountered this scenario multiple times already this year. The difference being, is that I’m writing about this during the middle of this awful time. It’s the waiting period. Journal, I’ve written about this before. My account is frozen. I can’t trade any other new trades. That’s just not in the rule book. I think this is # 14 trade. All of my trades have ended successfully, this year.
This one just might be the one that makes me change this rule.
Well, if you look up above, you can see what my plan is, moving forward.
I got until the end of the year. Let’s see what happens in this month.
In any case, I got to close it out before next year starts. And when that time comes, I’ll have to decide whether this strategy needs a rule augment. Or not.
Patience.
It’s paid off me for, like, every single time.
I’m just in the middle of this now, that’s all.
Will I be able to look back at this point in time and see that this is what I’m supposed to be doing? Being patient? Waiting it out? Knowing that it will work out?
Cause it has every time before? Am I on the right path? Is this just how it works? I need more patience, this time? Or is this the thing that tells me to change something? How long do I wait it out, before I need to conclude a slightly different strategy?
Well, what’s the longest I’ve waiting something out like this?
41 days. That’s my longest. Where we at now? 22 days open.
But I got exactly 20 days till the end of the year. Maybe a day shorter, because of the holidays towards the end of the year.
Well, that means this trade will be open for a possible 42 days long. That’s it.
The new year’s gonna come and I want to (always do) start the year out fresh.
Therefore I’m going to have to cut it short.
I like those questions I posed above. And this is the one I need to answer the most.
How long do I wait it out, before I need to conclude a slightly different strategy?
What can I do though?
The best I can do is stick with this plan and make some decisions at years end. That’s all.
In the meantime, my account is frozen. I am not doing any more damage to it by trading any other trades. I can’t. This trade must end properly before I move on.
I call that protecting the account.
Yeah well, you’re not protecting it if it continues on lower, Mike. Margin call is still possible.
Yeah well, I also can’t believe I will lose this much on a horse that has such a higher interest rate than the other. NZD = 0.75% //// USD = 0.25%
I guess if it wasn’t for that fundamental fact, I would give up on it.
But I’m not, because of that.
The market can stay irrational longer than you can stay solvent.
Ok. I believe it.
You win.
All I can do is when the time comes, before the year ends, take all available information on this trade and come to a conclusion about this rule of mine.
Boy, it sure does not seem like I’m gonna turn a profit before it’s over.
The fear…the uncertainty…oh…and the fact that the world is going to hell in a hand basket (sentiment)…it’s not looking good. Risk on sentiment looks practically impossible, at this point of the game. Honestly.
Sorry Journal, all that is what’s going through my mind. And there’s nothing I can do about it. But wait.
They (analysts) like to talk about a ‘Santa Rally’. Well, that would be good for me. Cause all that means is that the risk-on sentiment would take control. And this pair would go straight up. I guess it could happen.
But when I think about all this, you know what? What’s most important for me?
Like, right now? Is it money? Is it profit? Is it the health of my account balance?
Or how about learning something that needs changed in my strategy. That one rule.
Maybe, just maybe, this is a good thing to happen to me.
And well, if it is, then I just want to know what to learn about it. That’s all.
Learning lessons is not a bad thing.
I just thought that patience is a virtue. A good thing. Something that will inevitably pay off, when stretched to the limit. Well, it has worked on every single trade that I’ve taken since April 29th of this year. Never lost on any of them. But this just might be the one that cracks the egg.
Alright Journal. I’m sorry for chewing your ear off. I’m such a complainer.
Maybe that’s why, in the past, I’ve always waited till the trade was over.
But I had to complete Nov’s trading journal. And well, here you are, for me to vent on. At. Sorry.
You know what really stinks?
Man…I’ve been wanting to trade the JPY. Boy…it seems like all year long I’ve been waiting for this currency to grow legs. And guess what? I believe they have recently.
You don’t believe me?
Sit back and check this out.

Well, I guess I can’t complain all too much. Cause my line in the sand is the -12000 gridline. And it looks like we’ve just arrived at it. Like now. So maybe it’s a good thing I can’t trade it just yet.
But Journal, how many times have I told you, this year, that if there’s only one opportunity to take it’s this. When the JPY gets strong. It’s that mean revision play that I’ve been waiting for. Like, we’re talking, prime opportunity here. Right?
Let’s look a little closer.

We’re talking carved out floor plans here. Look there. One at the end of October.
Another all through November. No one’s really getting burned if you got in with the JPY and held it for these last 30 days. No way. Then moving through the end of Nov got some big boost. You can’t tell me this isn’t on purpose.
Well, I’m on the sidelines. Thanks to my NZD/USD trade. And it continues, also.
For this entire month. And what do you thinks gonna happen if this guy get stronger and stronger? My trade spells MORE trouble. Man…I’m sitting here now thinking my -300 pips is bad. I just might not know what real trouble is, yet. Who knows…
Alright Journal, I’m done talking. Plus this is making me more depressed. Cause I wouldn’t like to see the JPY get any stronger (even though it seems like that’s where their heading). UP.
But then again. When I look up at the longer term chart, it very well could bounce back down here at the -12000 level. I call that the resistance area. And technically, I shouldn’t trade until it goes above that anyway. Well, this all means nothing. I simply can’t, and won’t, trade anything for the rest of the year.
Therefore, I’m done talking.
I’m sorry Journal for the complaining.
Let’s just get through this month.
I’ll be seeing you next time Journal.
Thanks for listening.
Mike
2 Likes
Good morning Journal.
Well, as always is the case, I’m wondering where I’m gonna go today. Cause not a whole lot is going on with my trading. I mean, specifically speaking anyway. I’m on hold. Plus…I divulged all that nonsense last week. But there’s got to be something.
Well, it was only yesterday that I opened up my Business Journal and began some writing in it. So, whenever I do that, it’s pretty important. Because it hit me that I don’t want to forget some of these things. This will be something that I will follow up on.
See. I am trying to get prepared for my end of year. I see it coming. I’ve had this idea rolling around in my head recently. I know I’m going to want to review this past year. As always, there’s been some good things that I’ve done. Believe it or not, not everything I do, or start, ends up being something that I should continue on with.
Ok. Why don’t I just shoot out to you how I started this entry in my journal.
RELFECTIONS — OF '21
- What really worked this year?
- KEEPERS — From this past year
- Too important to forget about
This is exactly what’s in my binder.
And I put down, maybe, the biggest thing so far (cause I really don’t want to forget this). Alright. Don’t laugh. But this is exactly what I wrote.
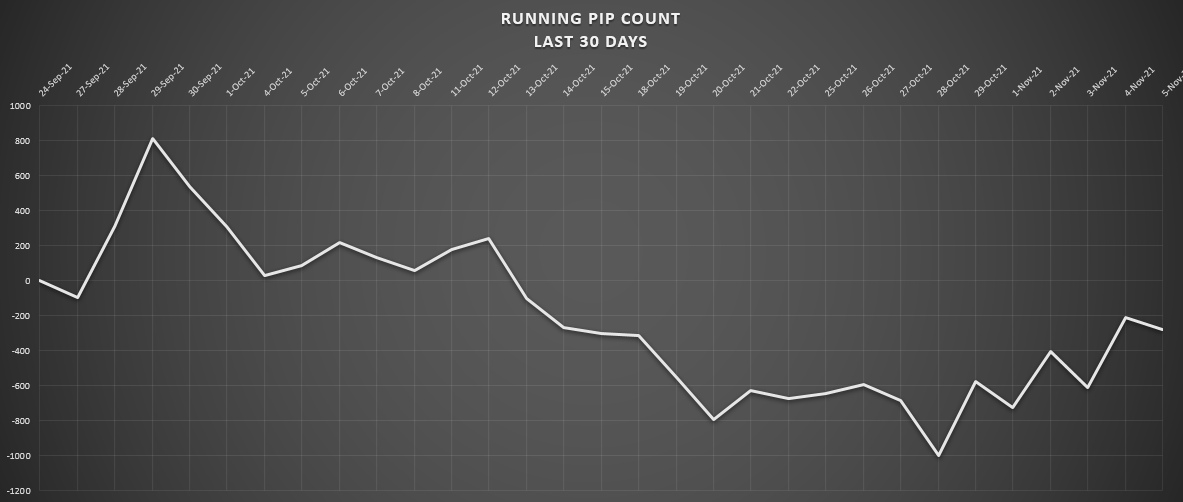
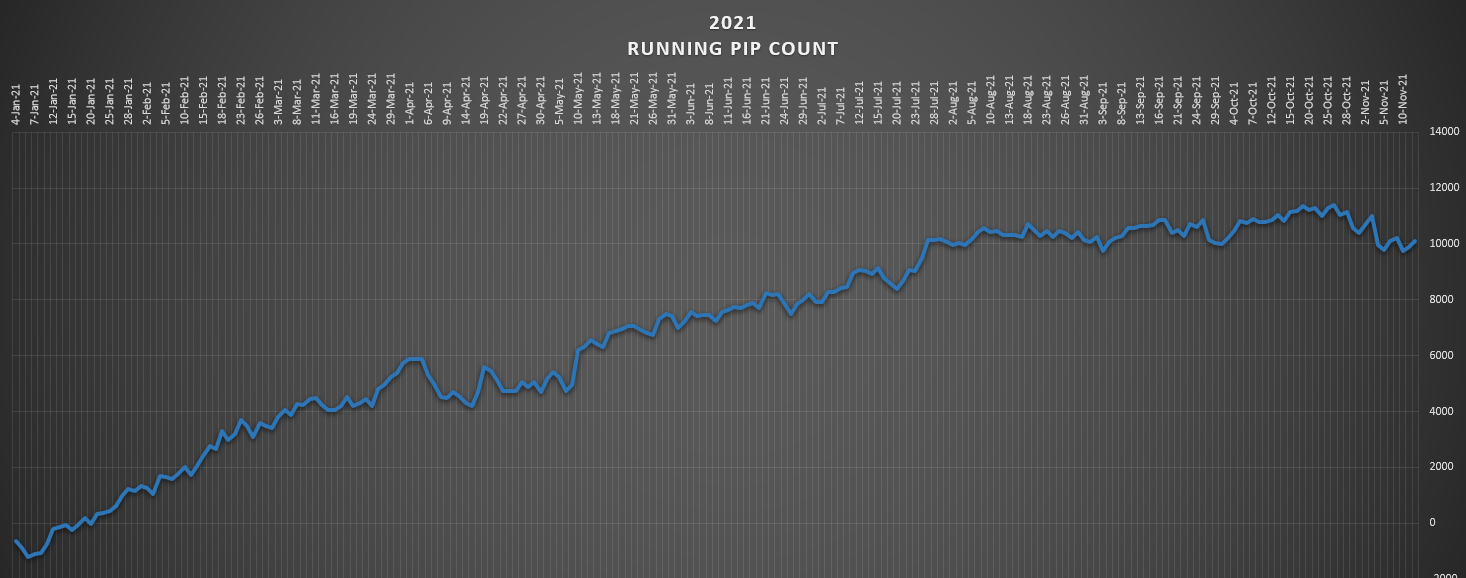
— MY SECRET WEAPON —
-
RUNNING PIP COUNT CHART — Aggregate currency
-
This tells me direction, stated trend. For the aggregate currency dynamic.
-
There’s no exact time frame perspective - (needs expounded upon)
Well, I’m not lying here. These words are what I wrote down.
And now, I want to talk about this (cause I need someone to listen).
Look. I know this is nothing new. In fact, I think anyone who knows me knows that I do this. In fact, I don’t even know when I started doing this. Either this year, last year, or the year before. In any case, every now and then, something rises up inside me and shows me that this is probably the biggest tool that I’ve ever discovered. I’m talking a revelation. A realization of things. Like having a mirror showing me about something that I’m doing. And well, I think all I’m doing is here is bringing it forward and wanting to start using this as a very important part of a strategy. I’m not too sure if I’ve even done that yet. Sure. For analysis purposes, of course I use it. But incorporated into a strategy, I’m not too sure.
Anyway. The more I think about this. The more I explain it to myself. The more I really feel that this proprietary tool is the most accurate indicator I can come up with. Check this out Journal. I want to explain this.
— A currency’s aggregate — is the starting point.
- Is the sum of all it’s parts. All 7 pairs (out of the 8 currencies) combined.
- The sum total of all their movements, in pips. Not %.
- Results in a true market consensus of what it’s been doing.
— A currency’s direction — is the ending point.
- Represented in chart form. One chart.
- Utilizing chart theory. A predictive tool. IE…S&R levels. Fractals.
- In effect, is the same as its 7 charts boiled down to 1 chart. It’s the perfect substitution chart.
— A currency’s stated trend — the bias each currency should have.
- Either long or short.
- Is not bound by specific parameters. Other than the foundation of a daily metric.
- Is more objective than subjective, if the rules are abided by.
Ok, Journal. That’s as many points as I can come up with at this time.
But you’ve heard me say time and time again. About how I despise charts.
How can that be?
Well, I guess I need to be a little more specific now, huh?
What goes through my mind is how all traders simply run to the charts.
Which charts?
All the charts that the brokers have for you.
One currency pair chart.
First off, I’m not gonna do what everybody is doing. It’s called the crowd mentality.
I absolutely despise that. For that fact, and that fact alone, I refuse.
Secondly, do you know how many times I’ve gotten burned looking at a chart and thought that it should go in a particular way? And it doesn’t? I mean, come on. Who’s stupid enough to continue looking at that and thinking it’s gonna end up the way you want it to. It doesn’t happen. Even Einstein learned this. Cause he said something to the fact that “You’re crazy if you continue doing the same thing, getting the same results.” I mean, honestly. You don’t need to be a genius to figure that out.
Thirdly, I’ve come to realize that for every reason why they think the chart is saying one thing, you better believe I can come up with a counter reason for that. When you’re not biased and can look at something objectively, you can make a case for absolutely anything! Bottom line is that I think that’s not conclusive enough for me.
Fourthly, I think that the problem just might be in the candlesticks. As opposed to line charts. All I really need is to know where things end up on a daily basis. For whatever a person can tell me what a candle is telling, I’ll bet you I can tell the opposite. For instance, wicks. What are they saying? A reversal? Or direction. You got a 50/50 chance, and nothing better. Probably the only thing they got right is the doji candle. And guess what that means? Indecision. Sure. Take the easy way out. Basically, all that is saying is that you don’t know. It isn’t an answer to begin with! Might as well frame it for what it is anyway. You have no idea! It can go either way. Well, you know what I say? That should go for just about everything a candle can possibly say.
Sorry Journal.
I guess I have a serious problem following what others are doing.
I just don’t think you should blindly accept the mainstream. Think things through.
I did. And I think there’s a lot of nonsense flying around. I’m not gonna buy it.
Where was I?
Well, I think it’s time to look at a chart.
Ironic, huh.
I’m not being two faced.
I just want to prove why these charts work much better.

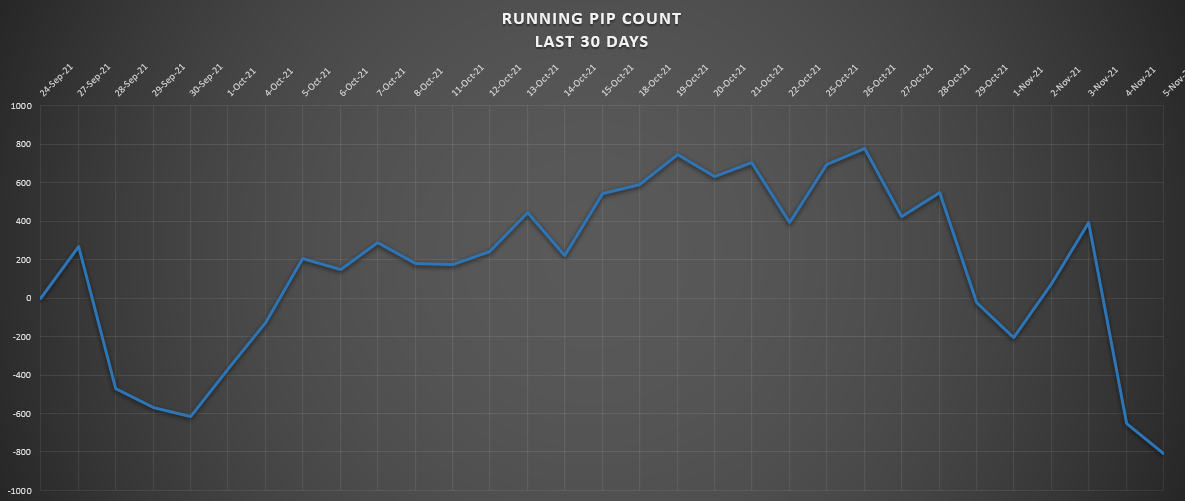
We got the USD. Present day. What do we got? Keeping in mind:
- Aggregate- It’s consensus.
- Direction- Where it’s been coming from.
- Stated trend- The stamp to put on it. Final determination.
— It’s trending high.
— The bias needs to be for long.
— It’s on a bit of a relief recently. Call it a slow down from it’s massive upward movement of late.
Now. All that is knowledge. It’s the facts of what’s going on with the USD. Cause that’s what everybody knows. Since no one knows what the future will bring, this is the only thing we have. It’s how the playing field is leveled.
But I’m not talking about how to trade this. That’s a different thing. This is where everyone differs. You got trend traders, momentum traders, countertrend trading, opportunity traders, short term all the way up to long term trading tactics. Man…there’s multiple ways to go about this. And I haven’t even crossed over to the fundamentals about them. See? It’s enough to drive a man crazy. Of all the possibilities.
All I want to know right now is what the facts are.
Trust me, I’m talking to myself.
Cause I need to keep these things separated in my mind.
But another good point about this method of determination of a currency is that it’s not bound by a specific time period. It’s dynamic. It’s flexible.
See. I remember the last indicator that I thought was the most truest. Moving averages. Man…I just thought they were it. I mean, ma’s smooth out all the noise, the oscillations that filter out a direction it wants to go in. You just got to pick the right numbers. That’s all. How many days do you look back on?
Anyway. I think this is better. Look. Sometimes a trend is short. Sometimes a trend goes much longer. You just never know when things are changing. Well, I’m not bound to any specific time frames here. Just by the fact of looking back, it’s possible, to see some starting points. Even ending points. It changes all the time. I’m talking about when a trend starts and ends.
Here. Let me show this chart again and I’ll mark up when the trends have changed.

Wow. Am I learning something here. I’ve been working on this for a couple hours now. And I’m sure that looks like a bunch of gibberish. No one’s gonna understand it. Even me. But there’s a point in all of this.
Hindsight analysis is quite different than forward testing analysis.
Well, since I have notes on everything that I do, I had to go back and find out exactly where (according to this chart) the bull markets and bear markets have been stated. Every circle you see is exactly where I changed their trends.
I only have 2 lines in the sand there. The 1000 line, and the 533 line.
Ever since Sep 6th to the present I’ve called the 1000 line the dividing line. Above it is in bull market territory, and below is bear market territory.
You got to remember my other rule. I play the market a week at a time. My only (possible) changes occur on the weekends. So that’s why my changes don’t occur exactly on where the lines cross.
I don’t want to get all into it now, but I’m learning something here. Even though I’ve always been aware of this dynamic.
You just don’t know what’s up and coming until after the fact.
Let’s look at the latest trend. Would I have possibly made some money, during this time, if I would’ve traded them long?
Absolutely. Up until this point that is. See where I called and changed their previous downtrend to an uptrend? And then what happens next? A big climb on up. Sure. It can work.
But. Look at the previous down trend. Would I have made some money? Well, for that very short period of time. Probably in that very first half of that whole time period. But in the second half of that time, nope. Would be losing my shirt. It’s in a down trend and where does it go? Straight up. Then the week ends and I then change it from a down trend to an up trend (which is where we’re presently at).
So. During that whole amount of time, what are the chances of me making any kind of money off of the USD in their down trend status. Not a chance at all. Remember, my line in the sand was the 1000 line. And it was below it, in the beginning. But when it moves up, boy, it goes up alright. Losing all kinds of money and everything that might have been won up until that time. Basically, it was a drawdown that cuts into all previous profits.
Bottom line on that trend is…some times you lose.
Well, that’s if I would have traded the USD on their stated trend. See. I don’t necessarily have to trade them, right? I got options. And that’s one of them.
You don’t always need to be in the market.
Well, that’s a tough currency. I think. They’re all not this difficult.
I’ll show you some of the more easier trends.
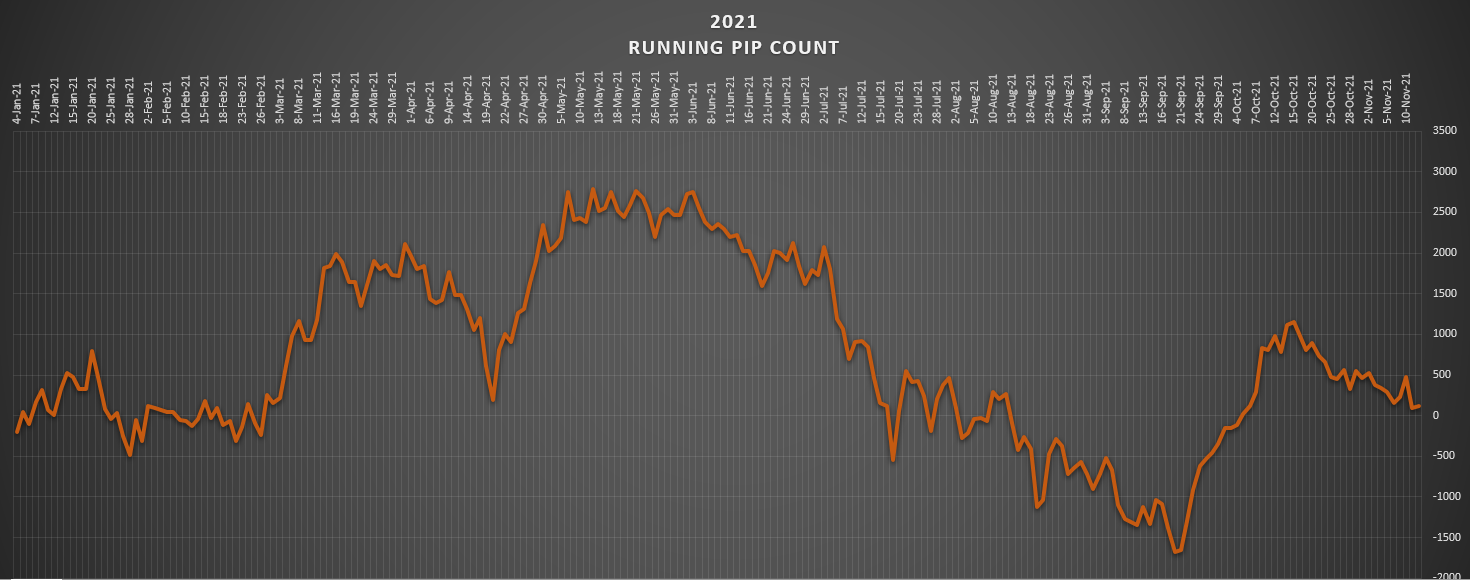
The EUR.

Well, all year long, with the exception of 2 times, have they been in a bull market.
Now. I accept the fact that I messed up there July 5th - July 9th. That was my mistake. It was such a stupid error. But, it’s what happened. I can’t lie about that.
And then recently, my dividing line between bull and bear market territory has been the 6000 line. Oct 18th - Nov 26th is when I deemed them in a bear market.
Would I have possibly made some money then? Due to this analysis? Sure. I can see 3 separate times of a real drop down during that time. And even the ending boosting up and breaking out part wasn’t all that terrible. Sure, some lost profits that was previously had. But not all that bad.
In any case, in the rest of the year, there was ample opportunity for some profit. Whether I went in with a long standing running trade…possibly a basket of EUR trades…or even shorter term tactics would have worked also.
This doesn’t even compare to the fake outs we had with the USD.
No comparison.
How about with the GBP.

Once again, I can’t lie. For some reason my brain wasn’t right during July 5th - July 9th. I called it, and made them in a bear market (just like I did for the EUR). There’s no excuse for that. It shouldn’t have been.
But other than that, the entire year I had them in a bull market. And this method proved itself. I think it works. It worked in hindsight as well as all along the way (for the most part). Surely more profits than losses. The only way to get burned here would be for any kind of very short in and outs. That’s why I don’t go there. I can’t do it. I work off of the longer time frames. Remember what Einstein said.
I don’t want to go through all of the currency’s.
But I am thinking of one more though. Cause I want to make some kind of point with them.
The JPY.

I don’t lie. Sure. I made some stupid mistakes this year. You can see where on those 2 occasions of where I made them in a bull market. I’m not gonna pretend that I didn’t. But I do chalk it up as a learning experience.
Technically speaking, there’s nothing remotely close to a fake out on this chart. There isn’t one excuse anyone could possibly throw at me that would invalidate any kind of charting rules. You won’t find any higher highs, at any point in here.
I have to admit, I thought it was getting close lately. I only have to go back a week and show you what I was thinking.
Remember this.
Ok.
So.
I did think the JPY was on it’s way up. I’ll admit it (after all, those are my words).
All those words are simply saying that I thought it was going up. Even to change the bear trend to a bull trend. I mean, I was thinking that, and feeling that.
Feelings are one thing, but facts are another.
And that facts were:
- My line in the sand was at -12000.
- I play the week at a time.
- I never changed their trend (was giving it one more week).
Well, what happened this past week, with them?

Down they come.
You know I was right about that -12000 line as being a resistance level. To correlate that line to this shorter term chart, it would be no higher than where that 2500 line is. Basically, just above those 2 high points.
Man, was my thinking wrong last week.
Look Journal.
This is nothing new. I’m wrong all the time.
I’m talking about my thinking. Not necessarily my trading.
In fact, that’s the whole reason why I have rules to abide by. They are not based on my feelings. They got to be based on logic. And must be proven. Lines in the sand are a logical conclusion. In fact, all they are, is support and resistance levels, taking the previous trend into consideration.
Alright Journal.
Let me step back and see what’s going on here.
I have a technique going here that I definitely thinks a keeper.
I do think and believe this is my secret weapon. This has to be my starting point.
A starting point in regards to a trading strategy. In fact, maybe for any and all ways of my trading. I’ve said it multiple times. In getting the direction correct for a currency is the hardest aspect.
After that, there’s the:
- WHAT exactly to trade (pair)
- WHEN to get in
- WHEN to get out
I only have 2 or 3 more weeks before the year is up. There are other aspects that I have learned this year that should be keepers.
I’ll visit them in the days to come, Journal.
Thanks for listening Journal.
Mike
1 Like
Good morning Journal.
Well, I guess I made it. Cause I was thinking I wasn’t gonna have the time.
I’ve been busy. Plus, I wasn’t quite sure what to type about. I hadn’t had anything on my mind to talk about. But, I guess that’s what you’re for. For me to simply bounce things off of, or just to talk about whatever I want to.
Ok then. This is pretty stupid, but it’s what I’m in the middle of.
I only started this yesterday. I was just looking around at all my data, that I collect. And you should know about my secret weapon by now. Well, I was just looking at it closely. And I decided to add onto the year of 2015.
I just finished it now. And now I can talk about what I think.
But first off, I was thinking about how far back I want to go. I know they say (in the realm of back testing) that the longer the better. I don’t buy it. I just don’t think you can compare what’s going on today to whatever happened in history. It’s a new day. In fact, I believe it’s always a new day. But moreso, because of COVID, I definitely think a lot of dynamics have changed. So why even try to compare how these currency’s might behave the way they used to? I think that’s not so smart.
But, what brought me here to begin with, was when I was looking at the JPY. And that leads me to this point. The point of finding out how we can learn about the past. I do think there are some benefits we can derive from history. Well, at least what we should be aware of anyway. This is what I want to talk about.
Yeah.
The JPY.
Sorry. I’m back now.
Wow. I just put together a bunch of numbers. This is something.
But yeah, I want to show you some stuff alright. The Yen. Check this out.
This just might blow you away Journal (cause it did for me).
The JPY, from 2015 up to the present. Running pip count, against the 7 others.

For no charge I showed you my bottom tabs. That’s proof right there what I’ve been working on, in my excel sheets. In this tab is where I combined every year
(TOTAL CC). That’s complete currency’s.
Anyway.
This answers the question of when was the last time the JPY was this weak.
Yep. June 2015. How about that? Isn’t that interesting? I think so.
Look at the support and resistance levels. Where we are presently, looks like we bounced up at a support level. And of course it remains to be seen what’s gonna happen around here. It could very easily bounce up and down like a ball hitting the floor. Where the bouncing gets smaller and smaller and then falls off the cliff, for lower. Or it could find this place as it’s boost up higher.
We simply don’t know what’s gonna happen.
Well, my idea is to continue the back testing at least to the year 2013, I think. Somewhere around there. If I remember correctly, that’s around the time when I first embarked on this journey. And I do remember when Japan started on it’s quantative easing journey. Basically, they devalued their currency like never before. Man…honestly…I do remember when the USD/JPY price was below 100. I know a lot of traders here in BabyPips were taking full advantage of those times. Boy do I wish I was up to speed when that was occurring.
Anyway.
I want to back test to around when that was. Just to see how their complete devaluing story has turned out. It’s not pretty. Actually, I think it should be an embarrassment. Whatever they tried to do just didn’t work. Well, that’s a topic for another day.
This is what I find interesting, Journal. But keep this in mind. How you have to take history with a grain of salt. Meaning, it’s always a new day.
I want to throw some charts out here to make a point. Let’s go year by year.
Well, since I just complete 2015, I want to talk about this year for a moment.
How about a quiz?
Who knows what happened on Jan 15th 2015?
I bet I know a couple guys who remember this all too well.
Let’s see. Which chart should I put up here?

Yeah, that is not an error. 12,000 pips accumulated against everybody. In one day.
Who was it?
It was the Swiss.
I remember it so well. In fact, I was sitting right here (at my table) in the early morning hours of the day (dark, and no one up in this part of the world). But, all of a sudden I noticed how the AUD was losing their butt. I was trading them at this time. In fact, I was trading them as a complete currency at the time. What a mistake that was! Cause you should have seen the carnage taking place. I was more into the numbers back then than the fundamentals. I guess you got to grow up sometime. All I remember was that I couldn’t believe my eyes. I was watching it as it tumbled. Truly unbelievable.
The Swiss took off their peg to the EUR. It was cataclysmic. I honestly don’t know if I will ever experience something like that again. Now that I’m aware of what’s going on in the world, I’ll probably be more prepared to handle situations like that.
Ok. Let’s get back to the currency on topic.

There’s a point I want to make. I’m actually gonna spoil the ending here. But as I go through each years charts, for these guys, I want to just look at one thing only. The fact that every year the JPY has had some good runs. I’m talking appreciation.
Keep this in mind, Journal. If you had a strategy that simply waits on a strong JPY, then what are the probabilities of making good on that? Not that I’m saying that’s an easy thing to do, but it is possible. Somehow. But look at this particular year. There’s at least 2 real good possibilities. Let’s move on.

Wow. 2016 was a good year for them, huh? For the course of this year they accumulated as much as 12,000 pips. All that happened in the first 3 quarters.
You can’t tell me that strategy wouldn’t have worked well that year. That last quarter looked like a major retracement from the first 3 quarters. Right?

Overall, this was not such a good year for them. Possibly some kind of profits up until about April 15th. After that, it’s all down hill. Well, actually, I guess it depends on the strategy, cause there’s a few spots in there for a ride higher. And I guess you need to see how far they’ve traveled. They only got as high as 4k pips, and as low as -2k pips. That’s not much at all. Again, not a good Yen buying year. But is slightly possible.

Ok. Not a bad year. There’s definitely more upside than down.
And I don’t know if you’re paying attention, but you should be able to see that when they want to move, they can move. There’s some serious straight up lines around.
I guess that goes for the other way as well.

Definitely some possibilities this year. All in the middle part.
Again with some straight up moves.
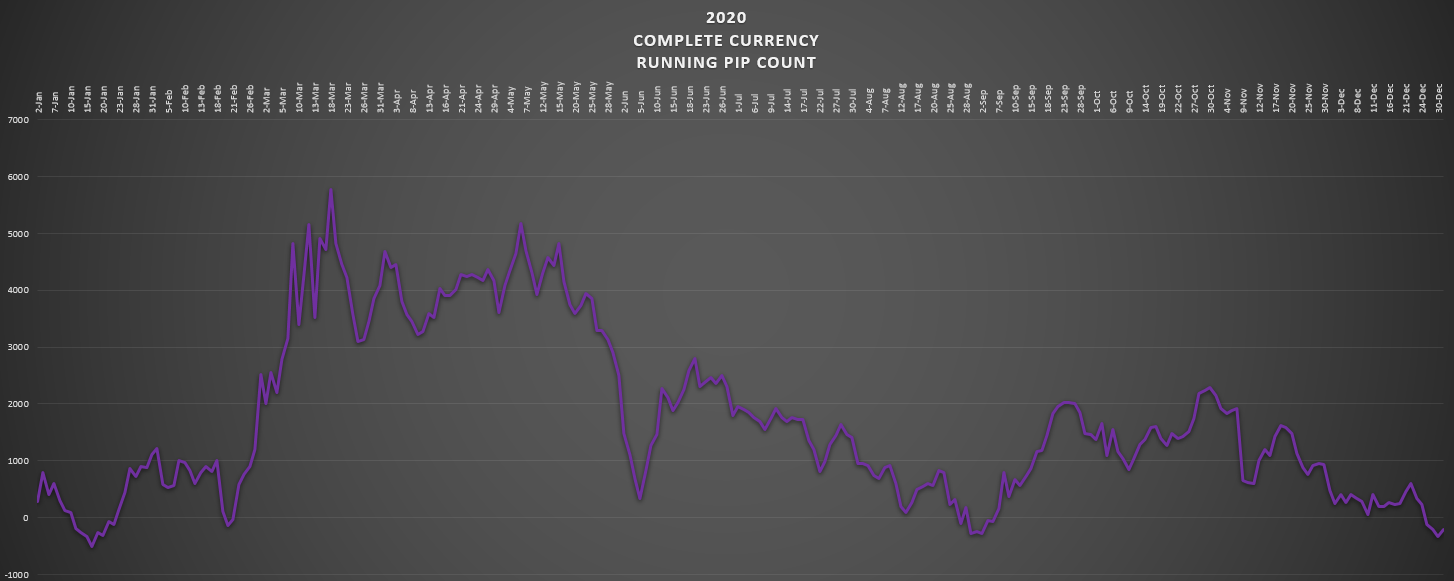
And who doesn’t remember last year. It rose up to 6k pips on their run up to the COVID era. Some big moves.
But then comes this year.

And this is my whole entire point. This is an entirely new ball game. I mean, we got no more big moves. And in one direction only. Even look at how many pips were lost this year. 14k! Yeah, compare that to any other year. No comparison.
Whoever would take into consideration how the JPY historically trades, probably would have lost a lot this year. Cause I’m not seeing any resemblance of how they’ve normally traveled. Right? Well, let’s put it this way. Whoever’s a retracement kind of trader, yeah, would’ve lost a lot. Cause it hasn’t done that at all.
On the other hand, whoever is a good trend trader, would’ve (should have) done very well this year. Right? Well, I guess you can say that I am. I lean trend trading than any other. So why have I not done so? Well, probably cause …
Let’s face it…Hindsight is one thing. Forward trading is another.
To be honest, I kept thinking and waiting for these moves to go higher. It just never happened. I mean, I never hopped on board and went all out trading the JPY short. Well, I didn’t develop a particular strategy for it anyway.
But I did correctly establish their down trend pretty much the entire year (I showed all that on last weekends post).
But stating what their trend is, and trading is two completely different things.
Let me say this again (cause I’ve said it multiple times in the past).
Hindsight is evil!
You just can’t possibly think that you should have known better when you see the data afterwards. If that were true, then by all accounts, whoever is a trend trader and looks for trends to jump on would have made some serious money this entire year against the JPY. There’s no excuse. You don’t get any clearer, predictive, most easy trend to ride, do ya? Nope.
Has this happened ever before?
Well, not in all these years that I just got done showing.
No. Not recently.
But I do think there’s one good point here to take away. About this hindsight dynamic.
That would be the fact of how long of a trend this has been. That is fact.
This would be an anomaly.
There is great potential when things like this occur. You just got to be ready for it.
I just can’t see any other opportunity that the market can possibly throw at you, to be better than this one right here.
The JPY.
One way or the other.
Cause the market has been setting this all up.
Alright Journal, I’m running out of time.
Got much more to talk about but I guess it’s gonna have to wait.
The year end is approaching, and after this coming week I’m gonna have some good time on my hands. I plan on getting a lot of work done.
Don’t worry Journal, I’ll share everything with you.
Mike
4 Likes
Good morning Journal.
Alright Journal, I’m finally ready.
Yeah, I’ve been off of work since right before Christmas. It’s been great.
Oh, you better believe I’m enjoying this time off. I have been taking full advantage of this time that I have. Let’s see. I don’t think I’ve gotten up any time after 4 am every day. And I’ve had some 2 am mornings.
Needless to say, I am getting a lot of work done during this time. And I am sorry that I haven’t come in here yet to type away. Cause this is one of the big things on my list to get done, during this time. Journaling my end of year recap. I think it’s important.
But trust me Journal, I’ve been so busy trying to finish something. And do you know how hard it is to stop? Especially when I’m on a roll, and I have the time to do it. Therefore, that’s been what’s keeping me from this. And I’ll tell ya what it is.
I’ve been getting ready for next year. In my excel sheets. See. I’ve really been wanting to get more efficient (even more than I have already) regarding how I perform my EOD numbers. I’m just finding quicker and quicker methods of getting it done. Well see, I wanted to take care of the entire year, now. This way I can copy and paste the whole entire thing for a templet. This way it’s blank and clean and can easily be used for subsequent years.
In times past I’ve shown you some of the details of all the data that I collect. And I don’t want to get into all of it now (cause it’s pretty massive) but let’s just say that with the power of excel it’s possible to copy and paste one simple set of numbers (% movements and pip movements) a certain way and then can be automatically, and instantly, transformed into many different kinds of formats. It’s awesome. And always has been. But I’ve just been trying to cut down on the amount of time that it takes. There always seems to be a better way.
That’s nice, I know.
But that’s what’s been keeping me.
I did take some time out yesterday and dove into my year end analysis. I did this via my mind maps. More specifically, when I completed my Dec journal and when I completed my '22 goals mind maps. So I did make my way around all of what happened this past year. And I want to talk about some of this stuff.
But first.
I got to do it.
This is how it all started.
The lead up period went like this. For about 6 months leading up to this particular time I remember grilling Trish on what kind of business we should get into.
I so badly want a business of my own.
This reminds me of previous times, back in the '90’s, in which all I can do was dream of having my own business. Well, back then I actually did follow through with one. See. I was an auto mechanic. And there was a time when I got business cards made for myself. Boy I had a bunch of them. I would pass them out to whoever needed a personal mechanic.
Well, I only have one story that came about all of that.
One day I was at a gas station and I seen a mini van smoking real bad. Since it was a particular make and model I knew exactly what was wrong (oil was leaking through the valve seals, causing the blue smoke to exit the tail pipe). Therefore, I stopped the guy and gave him my card. I told him I could fix it for him (for a price of course). Well guess what? He gave me a call sometime shortly thereafter.
We had a deal. I came to his house (out on his driveway) and fixed his van. It cost him $500. I forget how many hours it took me to do it, but I did get the job done. It was awesome. I think what I liked most about all of that was the business part of it. There was only one other time that I did another job. And I can’t believe I actually did this.
I took out a transmission, out of a mini van, all by myself, in an alley. That’s with no power tools, or for that matter, any specialized equipment that’s supposed to be used to do something like that. I can’t believe I did all that and it actually ran afterwards. I don’t know, somehow I got through it.
But, I just do not like cars. It’s amazing how a person can do something for 21 years and not like it. Honestly. God really has a sense of humor. Cause I am absolutely the last person who would be called a car guy. I hate everything that has to do with cars. I mean, I even remember my mom thinking I was absolutely crazy to want to get into fixing cars back then. She knew that wasn’t me. On one of her last days, in the hospital bed (cancer stricken), I remember she said to me, “Mike, you do not like to get your hands dirty or even wet, and you want to become a mechanic?” I know, I don’t know what I was thinking. She was right and she knew me better than I did. But I wasn’t going to quit this newly found career that I was about to embark on. I was 30 years old at the time.
Sorry 'bout that.
But it is true that I’ve always had a dream of having my own business. Ever since I got out of the Army back in '91. And well, that’s about all it’s been, nothing but a dream. And so, much later on down the line, I got the fever once again.
Like I was saying, me and Trish talked every day about what kind of business we should have. And I don’t want to get into the particulars, but at every turn, I was quite disturbed and had a realization that we would have to be dealing with employees. People. And I’ve come to realize that I don’t like people. Therefore, how in the world can I possibly come up with a business idea that doesn’t involve people? Like, it’s impossible! You’re gonna have to be dealing with workers and that’s something I wasn’t crazy about. In fact, it was ending up being a deal breaker for me. I can’t have a business because it’s too much trouble having to deal with people. And I won’t.
Well, after getting to the end of my rope (because of this fact), this happened…
It was between Christmas and New Years, heading into 2013.
I read something somewhere. I was being enlightened on the financial markets.
Not only that, but seeing that it was possible to trade the market opened my eyes.
Boy…you should have seen the lights go off in my head. It was like the closing time of a fireworks display. I mean, everything, everything, everything about it was me. The industry. The nature of the business. Numbers. I’m talking, everything. Mostly the fact that it’s an individual pursuit (no people…yay!!!).
This even drew me back when I was in high school. Me and my brothers would play the stocks and bonds board game. We evolved and advanced all of that and eventually made our own game. A big piece of ply wood. Magic markers. Couple decks of cards. We had tons of fun with that. But see, back then in the early '80’s, there was no such thing as trading the markets like today. The only way was with a lot of money and a broker that you would call. And of course all that took place down on Wall Street. It wasn’t for the lay person. And surely there’s no chance for those without money.
I’m even talking about before computers were really going. I remember I had a cousin who was into computers. He showed me what he knew. It was this thing called MSDOS (whatever that stood for). The screen was black. The letters were green. And it was nothing but line by line. All the way down. And at the end he would put run. Whenever he did that, he carried out a lot of calculations that happened very instantaneously. All of that seemed to be the very beginnings of computer programming. But at the time, computers weren’t a thing yet. And we just didn’t know what was coming. Well, maybe Eric did, cause he was a very smart guy. And I do think I remember him telling me that this was the future. He was so excited about it all. But, I couldn’t get into it though. It was so foreign.
Anyway.
Back to my story.
I spent the month of January of '13 learning about all of the different markets (much reading books). And then when February came is when I discovered the Forex market. I knew, without a doubt in my mind, this was my market.
This is what I want to learn.
This is what I want to become an expert in.
This is what I want my business to be about.
This is what the rest of my entire life will be spent on.
That was exactly 9 years ago, to the day.
It’s my start.
And as I knew then, still holds true now.
This is why I was born.
It’s my destiny.
This is what I’m learning though. It’s a long process to become completed in it.
This won’t be completed until the day that I depart from this earth.
It’s ok though. I’m enjoying every step of the way.
That’s the biggest reason why I started this journal. Cause I know it won’t end.
The learning. The evolution. The experiences. The stories.
This should be something to behold, cause I like to type. I like to tell stories. I like to learn things. Oh…I most especially like to explain things. Things that pertain to psychological matters. Now that’s interesting stuff. I think.
Anyway.
All that nonsense should explain why I do what I do.
And what brings me here. Literally.
Well, how about what happened this past year?
Yep. Let’s look at it.
I guess the best place to look is at the beginning. How about this…


Well, what I wanted to show you is what I had down since the years start. All that’s in yellow. I guess I did some good. I put down my answers to the right of that.
Let’s see. I did accomplish the very simple but important goal of coming up with a months summary for every month. I know it seems like a stupid, easy thing to do, but it wasn’t. Do you know how quickly a month comes and goes? Man…like, it’s not easy to have to write up something that doesn’t always turn out so good. But I did do it. For every month. I can show you, but trust me, I did it. And that’s how I started all of this year end analyzing. I went through each and every month. Read it all.
As I mentioned this in the mind map, I realized that in just about every month the topic of my excel data collecting came up. Whether in being more efficient, or whatever, there always was something going on with my excel tool. Therefore I know I’ve come to realize, even a little bit more, how important and useful this excel is to my business. And I’m sure the potential is there for way much more. In fact, that’s why I bought the book, earlier this year, on it, The Excel Bible.
Look. I know this is so obvious stuff. But what can I say, it was an important thing that I realized this year. I got to say though, for all the data that I collect, it’s amazing how quickly it can be gotten. All my charts, tables, particular spread sheets, templets, historical data, etc…I can’t imagine working without all that. And it all comes by excel.
That’s nice.
What else.
Oh yeah, I have to admit it. I came up with a lot of strategies along the way. And they just didn’t pan out. In fact, I wrote it down somewhere that I realized that at one point I had up to 5 Anchor Trades. That’s 5 different strategies.
That’s nonsense. I shouldn’t need that many.
Look. I’ve said it many times before. And I know myself and am aware of this.
I want to be consistent with a proven strategy. At least one. That’s why we call it the Anchor Trade. I learned this from my mentor a while ago. That it should be the one trade that you can always go to for profit. One trade. The most proven & trusted strategy you got. It makes sense. I mean, how can you expect to progress any further down the line if you’ve never settled and learned one particular way to make some money in the market in the first place?
Honestly.
Nothing makes more sense.
Well, being the perfectionist that I am, it seems like I’ll be on this pursuit for a very long time. And that’s the problem with this one strength and weakness that I have.
Perfectionism.
A good thing and a bad thing.
Oh…I won’t quit till I get there.
Get where?
Perfection!
But the thing of it is, in my mind there’s always something better that I can attain to.
Which means I could be spinning my wheels till infinity. Like this anchor trade. Trust me, it can always get better. But when do I get to the point that it’s good enough?
Well, I think I might have found it, this year.
Maybe this will explain some of it.

Journal, I’ve talked to you about this many times. And I’ve been doing some serious thinking on it. You might have remembered our last conversation. I needed to decide on what to do with this.
Is this viable or not?
Cause this last trade that I’m in isn’t going well. It very well could be the example that tells me it doesn’t always work and when it doesn’t, it’s too detrimental.
But I had to go back to the drawing board and see everything that I’ve done with this trading strategy. The good along with this bad. I mean, I have all of the 14 trades right there for you to see. So when I was putting all this together, I kind of realized that this is not so bad. I shouldn’t throw this all away (see what I mean about being a perfectionist?). Cause I definitely considered chucking it all.
Getting back to the subject.
Anchor Trade.
I’m going to make this my Anchor Trade. Cause it sure does seem like I was getting there. I mean, I have to say, of all the strategies I’ve tried, this one comes the closest. And, in fact, I think it’s the longest running strategy that I’ve kept with.
Alright. More on that later, Journal.
I wanted to mention some other things that I learned this year.
For as much as I don’t want to admit it, I have to.
This year taught me that having a basket of trades don’t work out.
What a shame. Cause this is where all that came from.
This was back in May.

Look. This stuff is nothing new to me. I jumped in that thread way back around '15 I think. I’ve always been enthralled with that methodology. ALWAYS
But I’ve come to realize, in these last couple months, that it’s not profitable. It’s something that I have to admit (and only God knows that I didn’t want to accept that about myself). What a hard pill to swallow, Journal.
Even you know that Journal. I mean, what do you think trading Complete Currency’s is all about? Basket trading. It was me. I think it’s still me. But I can’t go there now. Boy…I remember Clint telling us in that thread that the only way this will benefit anyone is when you already have an established way to get in and out (a.k.a. proven strategy) will this be possible. It’s the compounding affect that provides very much success. And in the same breath to say, that if you don’t have that, this will cause much disaster. Cause the compounding affect works both ways. It’s not pretty.
And look. Who wants to admit that they can’t even come up with a proven strategy? Even after years of hard work.
Well, that was me.
And I guess it’s still me.
Finding your Anchor Trade should be of the utmost importance.
Alright Journal, I say all of that nonsense just to tell you that I’m going to continue using this strategy this coming year.
Why don’t I just show you this.

There it is Journal. I’m an open book.
Those things are what I will be working on this year.
And like what I did this year, I want to do next year at this time.
Take a look at this very thing. Come up with some answers.
For instance…
Did I keep with the Anchor Trade? If so, what does every trade show?
Also, have I come up with a viable long term trade?
Yeah…that’s something we’re gonna have to talk about Journal. Like soon.
I recently told you about wanting a yearly trade, quarterly trade, & monthly running trade. Well, I’m not so sure about all of that. But I would like one long running trade.
And that’s it!
Honestly Journal.
2 trading strategies.
One, for when opportunities present itself. Swing style trading.
One, for long running, account balance accumulating (hopefully) type. Position style trading. For those long standing trends (I can only hope for another one like what the JPY demonstrated this year).
Ok. Well, those are the things that I deem important to my business.
I just hope I can come on in here next Dec at this time and see some serious progress, from where I’m presently at now. Know what I mean?
Alright Journal, I think I covered everything, regarding my year end analysis.
I definitely learned a lot this year.
Some things I got to let go.
Some things I got to keep.
Now that I’m done with all that nonsense, boy would I like to talk about strategy.
Even about market stuff.
But I’m out of time.
It’s ok though. I got this time on my hands to continue accomplishing all that I want to. I’ll just have to share with you those things that I’ve been working on, Journal. Right?
Don’t worry Journal, God’s working all through me.
And I will tell it!
Thanks for listening Journal!
Mike
5 Likes
Hi Mike,
As usual, it was a pleasure to read your Journal entries. And I liked the deep background. I know what you mean about managing people. In my last ever “job”, I had been sent to Syria to grow our business from a 1% market share to what turned out to be around a 50% market share. Having been sent (expats) a total of 35 staff, and having hired (locals) another 35 staff, I became disillusioned with the increasing bureaucracy and inter-country squabbling from country managers whose tactics were not always altruistic. When I resigned my “job”, I quickly grew a small company with my wife, and at 15 employees, we started to experience the same BS in our own company as we had in our employed lives.
One day, one of our (subcontract) employees went to my wife and asked for some days off. He was in the middle of a job he had promised our customer he would finish by a deadline, the took off on leave, leaving me to fix the problem with our customer. On that day I decided that I was no good at managing a lot of people, and told our technical manager to stop taking on work that our contractors brought but did not own, and we quickly shrank from 15 to 6 employees. I was much more comfortable with that, appointed our lead tech to General Manager, and let my wife run that business for the next 20 years. I, too, wanted a business that “did not have employees” and when we decided to purchase far too many houses and became landlords, even despite appointing managing agents, I could not avoid the necessary human interfaces with bank, agents, suppliers and tenants. I had no passion for running either type of business. About two years before you took up your love of Forex, I did too. And the main reason was the nirvana of not having to deal with other people.
I still can’t say that I have achieved anything substantial with Forex, but I have done so (finally) with Crypto. It is now the second highest contributor to income and 18 months ago it was not even on our radar.
Stick at it. I am interested to learn how you are going to take your learnings from 2021 and apply them to 2022. And a happy new year to you and your family.
3 Likes
Hey Mondeoman!
Thanks for all that.
Interesting stuff. And again, thanks for you experience.
Yeah man…there’s no way I would, could, be able to deal with people like in your story. No way. I mean, all I’m doing right now is smiling and nodding my head from the details of your story.
Good stuff. Thanks.
It’s things like this that I cherish. Learning from the experience of others (through stories like this), especially from those older than I.
Mondeoman, again, thanks for the input.
I appreciate it!
Mike
Oh…by the way…I’m so glad to hear you making some good headway with Crypto.
Awesome!
Stay smart!
1 Like
I was laughing when I read this. In the UK we have a saying “there’s nowt so queer as folk”, which translates to “there is nothing as unpredictable as people”. I have been self employed since 1993, and whether I am consulting for a corporate client, or just hiring a tradesman for some property repairs, observing human nature is fascinating - and often so disappointing. Try this at home. The next time you need a quote from a tradesman and he starts rubbing his chin or touching his ear, don’t hire him. It’s a sure sign that he is not confident he is telling you the truth. Those guys who just say “$50 an hour” are probably less risky than those who say “I’ll do that job all in for $200”. One of the hardest things to get right in my consulting job is getting specialists to arrive at an honest estimate of their effort required for well defined tasks. Humans are almost hopeless at this. Even when they work with me to work out an estimate, I always ask them if they mind if I double it for the purpose of cost estimation. Most agree to when I explain to them that if I double the estimate I do not expect them to tell me later “they just didn’t have time”, and I need not factor in any of my time to help them achieve their goals. That is a luxury when they actually do complete the tasks within the agreed timeframe. Best not to have that stress, but managing projects does pay well 
3 Likes
Always good reading your thread Mike!
I just want to wish you every success in your trading in 2022, you deserve it!
And, of course, the same wishes to all those, like @Mondeoman, who have been encouraging you along the way.
Happy 2022! 
3 Likes
Good morning Journal.
Let’s see. First off, Happy New Year!
Looks like we just arrived.
It’s gonna be a good year. Boy do I love the idea of something new.
Turning over a new leaf. Out with the old, in with the new. New Years resolutions.
I’m so ready for what we have coming, this year. See. If there’s one thing that I know, it’s this. I know Someone who has it all under control. I have every reason to be happy, and comforted in this life that everything is gonna be ok. Cause I know He’s bigger than anything. Even all of the things I tend to worry about.
Yeah, if there’s one prayer I have, it’s this. To know my God more. And realize how much He’s in control. Now that’s something to be happy about. I don’t need to be a worrier anymore. Nope. Everything’s gonna be ok. I know it.
Alright Journal. Other than that, I do have stuff I need to get out. A couple things.
First off, I really need to wrap my head around what’s going on in the market. Plus, as I do this, I want to show you what I am keeping track of. It’s all of the EOD data that I collect. I think this stuff is important to know (or else I shouldn’t be doing it).
I spent so much time on this in these last so many days. You wouldn’t believe it. Well, that’s why I’m going to show you. In any case, I believe this is some essential market data that must be known. You’ll see what I’m talking about here in a minute.
Ok then. Let’s get to the getting.
How we gonna do this?
Well, we just had…months end, quarters end, and years end data. All of it.
I think the best way to go about this is by looking at each of the currency’s status, with all of that in mind.
Got to start out with the USD. Their the most important currency. Nothing is more effectual than that one. Let’s see what they’ve been up to.

Let’s go with some facts:
- Still considered trending high.
- Lately been sold off pretty good (counter trended) these last couple weeks.
- Has a ways to go to be considered trending low. Looks like I’m gonna call the line in the sand the 1500 line.
Well, you can probably get away with those few facts, moving forward.
Sure, we can move along to the other currencies, but we’re at years end. There’s things to be noted and kept in mind. I’ll point these things out.

Switching over to the %'s that I keep. Let’s look at the year in total. USD in white.
Now, against all these other currency’s (including the CNY) the USD ended the year in the positive. See it there, +8.76%. Therefore, we can say that they had a good year. Much better than a lot of the others. Ok then, let’s do some comparison then.
- Was the best safe haven currency to go with this year.
- In fact, diverged, big time, against the other 2, cause they both dragged bottom. Which tells me this was leaning more towards risk on than risk off.
- The USD ended higher than all 3 Comm currency’s. Which tells of more risk off, than risk on.
- Therefore, it was a mixed up kind of year (very hard to call a consensus on which risk type dominated). The market doesn’t always make it so nice and neat to call it one way or the other. We had both, in our market, that is.
Moving on.
The USD slipped up this last month. See it there? They joined the JPY on the bottom, when you compare them all.
But then look at what kind of month they just came off of (Nov). Complete domination, along with the JPY, & with the CHF. So basically, Dec was nothing but a retracement to what happened during Nov.
These things we got to keep in mind (I think).
How about we go onto the next currency. The next most important one.
The EUR.

- Still considered trending high.
- Were in a down trend but came out of it and turned high at the end of Nov (6k line).
- For the most part, this year, they’ve been on a long, steady, climb all year. I even couldn’t disagree with someone if they would say that they never actually dove into a bear territory this year. Trading wise, I got to be a little more particular on my calls for bull or bear. Nevertheless, that was a very short lived pull back during Oct & Nov.
- Characteristically speaking, this currency behaves much more consistently than the USD, huh? Just compare these charts to one another. Now, I would have to go back and study to see if this is something that occurs all the time or was it just this year that shows such consistency with the EUR and no-so-much with the USD. Then again, every year is different, just like every day is a new day. So I’m not gonna make any kind of assumptions of how a currency behaves. The closest I would go would be to study these ever since 2020. We are in a new era ever since then.
Let’s look at the GBP.

- Still considered trending high.
- Never was considered trending anything else this entire year.
- Same with the EUR, in comparing to the USD, what consistency they demonstrated. I mean, can we say this is a European thing? Cause they do have that in common. I can’t tell you how many times this year have I recognized how much they’ve both rode together. The CHF was in that camp also. I’m telling you…there’s something to this dynamic. We have got to be aware of what’s going on in our market. I don’t know…call it relational, fundamental, or something, this needs to be remembered.
Given all that, I want to put up the table again.
Let’s see the %'s of these 2 currency’s.
- The GBP was the most bought up currency. +75.50%.
- The EUR was right behind. +57.15%.
Do you see those numbers? I mean, the USD is next in line after the EUR with their measly +8.76%. We’re talking you can’t even compare those. It is complete domination this year. This tells us something. The market participants were in so much consensus in buying these 2 currency’s this year.
Remember last year how there was so much talk about the USD losing their credibility? That was going on mostly when that big devaluation came during the springtime. But that talk kind of went away. Cause the USD made a come back starting in Jun. Well, if you ask me, in light of all this, I would say that just maybe the European currency’s are starting to take over. Like, I’m talking about what the smart money have in mind. I’m just saying. You got to see what’s going on here.
It’s stuff to keep in mind, I guess that’s what I’m trying to say.
One more point I want to make, while I’m here with these 2 currency’s.
Let’s talk about trend following, huh?
Is there any excuse?
Whoever is a trend trader, should have made some coin this year.
Can you even imagine an easier trend to follow?
Nope.
Don’t even get me started with the JPY trend that we seen this year.
There’s no excuse. I’m sorry. But I have to say it. This year was the year of the trend. No one can call it any differently.
I don’t know about you Journal, but I failed.
I mean, I call myself a trend trader.
I’ve even tracked all this every single day of the year. If anyone shouldn’t have an excuse, it’s me.
But…did I trade it all accordingly?
No.
I guess I was preoccupied with trading other currencies. And not these two. I guess I have to question myself about this. Why haven’t I considered trading the EUR and the GBP? For long. Am I biased against them?
Well then. What can I learn about this?
I had a totally different agenda this year. It wasn’t about any particular currency and it’s trend. It was mostly on trading a basket of trades. I guess I can say that I buried these 2 currency’s and didn’t see all this.
Sorry Journal.
Sorry for ranting.
How about we move on.
Let’s look at the CHF (speaking of the Europeans).

- Still trending high. Ever since the end of Nov when it boosted up above the -1000 line.
- Ending the year below the water level (negative).
- Not as smooth and predictable as the other 2. Their safe haven status makes a difference. Plus…don’t forget about what their Central Bank thinks. Boy, they fight against moving higher.
Bottom line here is that it’s harder to trade than the other 2.
But regarding how they trend.
Difficult.
Some short lived trends. Some longer than others.
I guess maybe we can say that it would be best to trade them short (think SNB). Just look at that first major down trend. This was the biggest trend they had this year. But when you consider going north, it can get nasty. You never know when the drops are coming. I don’t know, it seems very risky. That’s why I say they’re a bit more difficult.
But I have to say though. It’s good to know what’s going on with the CHF. I think it’s very instrumental in knowing what the market sentiment is. Who says you have to trade them anyway? Right?
Ok then. We got through the majors.
Well, one more (I guess I have to).
The JPY.

And you might remember, Journal, when I came in here and was really thinking that the Yen probably was going to shoot higher, at that last swing high point. I even told you that it arrived up to the inflection point of -12000 line. Look. I never said it was trending high, I just thought that it would break up and over the line. Of course it never did. In fact, it went straight down from there. Even to the lowest it ever went to this year.
Needless to say, we never even had a fake out. Meaning, that it rose up and over a viable resistance level and then come back down. Not even close.
All I can say and wonder is what’s to be learned from this?
Ride the trend till it’s over.
Cut your losses short, and ride out your profits.
The trend is your friend, till the end.
Yeah, easier said than done, right?
Well, I’ll tell you what I’m learning from all this, Journal.
That this indicator of mine works.
Like, I need to trust it with everything I got.
I should go ahead and put it to the test and prove it.
What am I talking about again?
This indicator that tells me a complete currency’s trend.
It’s that chart!
Can you imagine if I would have set out to prove it this past year?
This is what I should have done.
Longed the GBP.
Longed the EUR.
Shorted the JPY.
Any possible one pair out of those 3 currencies. . GBP/JPY. EUR/JPY. For long.
Again. Hindsight is evil. I’m not gonna beat myself up too terribly much.
The thing of it is, we don’t know what next years gonna entail.
Will it be a trending kind of year?
Maybe not.
But if it is, then we have some perfect examples to follow here.
Actually, this conversations leads me to tell you how I’m going to trade this year.
You might remember me telling you about my most recent back testing results.
Well, I’m going to carry through with because of these results.
That is…when it’s a trending year, this will (should) work. When it’s not a trending year, it won’t work (as was the case in 2020).
So the premise is, I’m going to have a long standing, running trade going throughout the entire year. More specifically, one pair. Open all year long.
What tells me which pair?
What tells me in which direction?
I just told you the when of it.
Well, this year was my model. This is what it looks like.

The top table is me keeping track of the %'s. You know I do that. But this is the yearly running %'s, everyone against one another. These are the standing results.
The bottom table is the same thing, but not %'s. Running pip results, against all.
I wasn’t sure which method would be best, so why not find the results of both?
So, in the middle part, I got the results. Shows which pair to trade. The strongest against the weakest, per side. Got the daily individual results. And then the boxed up number is the yearly running total (moving to the right). Well, since that spread was so strong against the GBP and the JPY that both sides kept with those currency’s. And that was the pair to trade. Every day. On each side.
Ok.
Let’s skip right to the end of the year.
Results.

- % side ended up with +2,666 pips worth of gains.
- running pip’s side ended up with +2,383 pips worth of gains.
Remember, that’s the amount of pips gained per one currency pair traded, having on every day throughout the year.
If you ask me, that spells profits.
But look closely. Look at how the running totals started the month out being. Much lower. Any veteran trader would be guessing, at the months start, that this pair is so due for a correction. It was taking place around that turn of the month. But going into years end, that’s not how it ended up, huh? Boy, it went right back to that very trend. We’re talking, you would have to follow the trend all the way up to the end, to reap all the benefits. And trust me, it doesn’t always end this way. Remember the old saying, monthly end flows…quarterly end flows…even yearly. All that means is there’s going to be profit taking and it goes the other way than what the trend has been. Well, this year ended in the opposite way.
All I’m saying with all this nonsense, is being a true trend follower can very possibly be rewarded greatly. And I want to put it to the test.
Well, what if it doesn’t go that way?
You mean like in 2020?
Here. Take a look.

- % = -291 pips worth
- pip running = -1089 pips worth
Looks like between the two methods, the % counting works out better.
Maybe I should go with that method. Meaning, I go with whatever that table gives as the strongest and the weakest.
And then whenever it changes, well then, that’s when I got to exit and enter accordingly. You can see on that bottom table that the pair traded switches quite a lot. As opposed to the top table. I think that’s proves a good principle. The less the pair to be traded switches, the better. Just like what happened this past year.
Yeah, I’m gonna have to decide to go with the % count method. Cause if it turns out to be a bad year, hopefully the losses will be contained much more.
Ok then.
This tells me which pair to trade. Whoever’s on top against whoever’s on bottom. And of course which tells me in which direction.
I’ve been wondering about this very thing.
Is this the best method of telling me which pair (out of all 28 of them) has the greatest divergence of trends? Meaning, the greatest trending high currency against the greatest trending low currency.
I kind of think so.
Well, I’m gonna set out to prove this. This year.
I just want to look back and say that I’ve followed the trend! To the end!
I don’t want any regrets.
Well, I’ll have my other trade happening this year also.
My anchor trade.
That should be fun. Got much to prove there also.
Alright.
We’re getting long winded here.
Let’s try to hit these other currencies real quick.
The Comms.
AUD.

- Still trending low.
- Ever since the middle of Nov when they dropped below the -2000 line. Before that they had a very quick and shortly lived long bias trend. I guess the market remembered their very long bear trend that’s been theirs this year.
- I would call the -2000 line the line in the sand. Above = bull. Below = bear.
- Lately, got to say, has been quite bullish. Not enough though.
The NZD.

- Still trending low.
- Ever since it dropped below the -1000 line, it’s been over. Since the end of Nov.
- Didn’t you know that a rate hike causes this?
It’s a new day, I guess.
The CAD.

- Still trending low.
- Ever since it broke below the 0 line. How many tests and retests can we get here? Since the end of Nov.
There’s so many questions I have. Fundamentally. But what is, is what is.
I guess all that really matters is about following the trend. Whatever that may be.
Don’t get me wrong, I’m not saying it’s an easy thing to do. I mean, I failed this year. Incredibly so. But.
I think I’m closer though.
I found the best way to find out what the trend is. Per complete currency.
This knowledge is very important.
This coming year I’m gonna trade these facts.
I promise, to myself, that I won’t have a trade on that doesn’t line up with these trend facts, per individual currencies.
Like I presently have on, regarding the NZD/USD. That’s my biggest mistake, this past year. And I won’t ever make that again. Who bets against the trend?
Well, I did.
And that’s the reason why I failed.
I’ll learn.
Journal, I got so much more I want to talk about.
Looks like I’m gonna have to do this tomorrow morning.
Last day off.
Alright Journal, thanks for listening.
Mike
2 Likes
Hi Mike,
Interesting end of year analysis. I know you have derived your charts from excel data, but I think visualisation is a great tool to help you understand the big picture and (as you have done) to take a longer term view. I wondered if the type of graph with 10 years of data like the attached (GBPUSD) would help to confirm your conclusions based on your Excel charts.

3 Likes
Good morning Journal.
Well, here we go. Last day. It’s back to work, back to school tomorrow.
Man…I used to say that to my children, all of their lives when they were little. I knew they didn’t really like it, but I needed to get them prepared for it. And well, I have to say it to myself nowadays. It’s kind of ironic if you ask me (being a school bus driver).
Speaking of being prepared, Journal, that’s exactly what I’ve been doing this entire time on break. Basically, I’ve set up my entire year on my excel. More precisely, what and how I do my end of day data collecting. I will be able to do it more efficiently.
And that’s what I want to do this morning.
Show you. Cause I think it’s important.
Well, nothing is more important to me than to know how they all have related to one another, in percentages. Journal, you’ve seen it a million times. But this is how it’s done. All I do is copy and paste the whole line up of 28 pairs in this format, right here.
This is what an entire month looks like.

It’s real simple. When I completed the copy and paste action, one complete line (column) from top to bottom will be filled in. All 28 pairs (in the white boxes). But then thanks to the power of excel, those colored box’s, in line, will automatically be calculated to give me their complete currency totals (all 8 of their pairs…CNY included). Therefore, what I will have from the top down to the bottom is what every pairs’ result was, in %, for that day. But also I will have each of their 8 pairs % added up and totaled in their respective colored box’s (a.k.a. complete currency total).
Then directly underneath this is where these numbers will go. I organize these daily results, in all of the context’s that I want. Daily. Weekly. Monthly. Quarterly. Yearly.


And look. This is nothing new to me. I’ve been doing this for 4 years now. This way. But what’s new here is that all of these colored box’s will be automatically filled in. See? That one action that I do at the top will all go down here. And correctly added up. Instantly. So all I’m doing is about 5 seconds worth of work to have all this filled up (one daily column). I think this is important. What I got here is nothing but each currency’s complete total. It’s their one value that I compare to each other. But in %.
In every context.
Well, there’s more.
Journal, you know that I think that the % is not the only important metric to be measuring. I believe in measuring their pip movements. It’s the actual unit of their travel. It has to do with our trading. We get paid off of how much they travel, against one another. Right? All measured in pips. This is a different dynamic than %. I want to know how great a move a currency demonstrates (%), but also I want to know exact travel distances these assets move in (pips).
I don’t know which method is better. Honestly. There’s some benefits on both. And that’s why I keep track of both. Plus, when it comes to my trading, I’m gonna need to know pip movements. My broker doesn’t care about what the %'s are. They care about the pip’s traveled. That’s how I get paid…or he does. But when it comes to analysis purposes, (true height, breadth, weight, etc…) you would want to know %'s. Let’s face it, each pair has their own different rates of speed that they move (get traded). And in that respects, the % equals them all out. But I think it’s important to know exactly how far a pair moves, also. Hence, the reason why traders use charts. Cause you can visually see it.
I’m sorry Mondeoman, but I guess you don’t know my sentiment when it comes to charts. I’ve stated this very many times. I don’t like charts. I think they are deceiving. And I think that’s the whole entire reason why new traders, even all the way up the line of traders, fail. Everybody is going by what they see. Fundamentally speaking, I don’t trust my eyes. And I think it’s a trap. Like I said, it’s (can be) deceiving. Plus…what is everyone doing? Looking at only one particular chart (cause that’s all the eye can do anyway…see one thing at a time).
I’ve said this multiple times. One pair means absolutely nothing to me. It is such a fraction of the entirety. In my mind, that’s so far down the line (in the things of what’s important) it’s not even funny. I look at the whole. A whole currency. It’s that, that means everything to me. I’m talking about for analysis purposes. Now when it comes to trading, sure, it’s gonna have to be one pair. This is the beauty of our market. It’s the relational aspect of 2 different currency’s all wrapped up in one asset. You won’t find this in any other financial vehicle. But the bottom line is that you must know what’s happening. And I happen to think that what’s happening is so much more than what one simple pair is showing on a chart.
Probably the main reason why I get turned off by these charts is that it’s what the crowd does. I don’t want to follow the crowd. See. I’ve gotten burned sooooo many times in the past (I’m sure like every single trader that ever was), that I have to step back and wonder why. I’ve told this Journal countless times that for every analysis a trader can show me on a chart, about which direction something might want to go in, that I can show the opposite. I’ve gotten so upset, you have no idea (ok…maybe everyone does know). But because of that, I’m not gonna buy it anymore.
I refuse to look at what everybody is trained to do. I won’t look at one pair (cause it means nothing to me). I won’t look at those charts. Because every time I do I always end up with a reason why it could do the complete opposite. I get so frustrated it’s unbelievable. I’m not buying it anymore. I’m sorry. I’ve resigned to the fact that it’s deceiving, and not constructive, when it comes to trying to make an analysis of something. Now, when I have a trade on, of course I have to see what it’s up to. That’s a no brainer. Analysis is not the same as having a trade on.
That’ll be the only time I go to the charts.
Got to see what’s happening with my trade.
I’m sorry.
I mean no disrespect, Mondeoman. I know you mean well. And you are always willing to help. I feel it, definitely! And thank you! Every time. But in here I want to be honest. I always want to be honest with myself. With my Journal. And with you.
And actually, I think this is the whole entire reason for this post. It’s to show you, Journal, what I think is important. And you won’t find me going to the charts. All of these analysis derive from the raw numbers. Not charts. % movements and pip movements. But I do come up with my own charts. And I realize that I prefer the line charts (surely not the candlesticks). Cause all that’s doing is connecting the raw data. That’s all I want.
That’s nice.
How about some pip movement data.
This is what’s next on down the line in my excel sheet. It looks like this.


So, this is the second thing I do. Copy and paste the daily list of all the pairs’ pip results for that day. When I do that, in those empty box’s, directly underneath is where they are automatically added up. It’s slightly different than what I do with the %'s. The daily complete currency pip movements end up in that middle table, automatically. And then underneath that, is where they all get added up for their running amounts (all done automatically). Basically, day 1 will be added to day 2 (in the black row). And then the total will subsequently be added to the next day. So that black row is the running total. This is where all my data gets compiled for my charts that you see regularly. In fact, all those charts I threw out here yesterday comes from this right here.
Well, those 2 groups of numbers give me most of the information that I need. And again, it’s all for my analysis of the currency’s. I’ll just show all this stuff in chart form. All of this stuff is complete currency stuff. No individual pair stuff.
But.
Speaking of individual pair stuff, this would be my next set of data.
The reason why I have this is for back testing purposes.
Also it could be used for tracking my trading.
Check it out.

This will be the third thing I do. Copy and past the daily results of each of the 28 pairs (no CNY in here). Then automatically, they will drop into the particular days table. And then, automatically again, in the yellow tables is some totals. This might be hard to understand. But all this down here is for trading purposes. And of course back testing analysis. Here, let me show you what some of Dec looked like.

Ok. So. Who wants to know what happened with any particular pair on any particular day? Let’s go with the most volatile day of the last week of Dec (the 29th).
I can answer any question you can possibly give me, regarding any pair. Let’s see.
What was the most moving pair that day? GBP/CAD = 133 pips (middle column).
What was the total amount of pips the market ended up with that day? 1183 pips (in middle column bottom most total).
What was the result of my basket of trades? That’s on the right column. Totaled on the bottom. There’s only 16 pairs in the basket.
I don’t trade that. But it does tell me and show me how much the market went with the trend or against the trend. Cause those 16 pairs are the trending high currencies against the trending low currencies. 4 high against 4 low. Anyway. The results are on the right. And then put into a combined total on those yellow small tables. Consolidating all that data.
Anyway.
My whole entire point with this, is that if I wanted to, and will probably end up doing for back testing purposes, is that I can go back to any day and find out what happened that day, in regards to any particular pair. Their results.
This has to do with any kind of trading purposes.
Like I already mentioned, I don’t look at any one pair for any kind of diagnosis. But if I came up with a scenario of which pair to be traded (some kind of strategy), this way enables me to go back and come up with results. Ok. Like for instance, I would do something like this. How about, going back and checking in on the pairs that are trending. Or more specifically, correlating any trending high currency with any trending low currency. Those pairs only. Or…like I just did yesterday. I went back and found the highest % currency and compared that to the lowest % currency. Remember? The GBP/JPY. Well, this is exactly how I know how many pips that pair ended up with for all those days. Very easily.
I’m sure traders just look at the charts to get all this data. And that’s fine. All I care about is the raw numbers. It’s my way of going about it. That’s all. To each his own.
Let’s see. What else?
Well, nothing is more important to me than what the trend of a currency is.
So therefore, I’m gonna be keeping track of this. Cause guess what? Things change. I need to know when they do. Well, this is what helps me know what this happens.

This is a birds eye view. But this is very important stuff to me. Very.
In blue is the calendar view of each currency’s trend. Green is for trending high. Red is for trending low. For the month of Dec you can see that the USD, EUR, GBP, CHF, are all trending high. JPY, AUD, NZD, CAD are all trending low. And their respective pip count running charts is there on the left. Here’s a closer look at them.

I don’t want to get into the particulars. But simply speaking, each day has 3 lines in them. Journal, do you remember be always saying to you about where the line in the sand is? Regarding whether a currency is trending high or low? Well, this is where it’s noted. So, I have the line in the sand, the point where they started their trend, and it’s EOD point (that’s in white). Well, when I see this, if it’s green (trending high) then if the EOD line is on the top, then that’s the best it can be. Meaning, where their aggregate price level is currently at is higher than where it started the trend and also higher than the line in the sand.
Anyway. Trust me. This shows me, very quickly, on a daily basis, whether their trend is continuing on the way it’s trending, or whether it’s gonna change over to the other way (trend).
Moving on.

This just shows me the daily results, in %'s. This shows me how much the market, as a whole, trended that day. Tallied underneath those results. I’m looking at all their aggregates. And simply combining them. Shows depth of going with the trend (green % results) or against the trend (red % results).
Well, I’m seriously running out of time here. Better start finishing up.
I keep track of volume. That’s every pair. Also each currency’s aggregate (of course).


Basically, that bottom chart is the total amount of volume of every currency pair (dark color). Then compared to it’s average (light colored). This shows me the aggregate market. I can answer some questions like, how much did the market move on a particular day? A lot? Very little? Compared to it’s average.
The average I go by is per day of the week. So therefore I will have Monday’s average volume amount, and Tuesday’s average amount, etc…Counted ever since 2020. That’s all the Monday’s since then. That average changes (ever so slightly) on a daily basis, cause it’s dynamic. You might not be able to see it, but if you look closely, the lighter bars, over the course of this year is been getting smaller (very slightly, but surely). Remember what happened back in Mar of 2020. Very, very, high volume. Like triple the amount it ever has gotten to. But over time this comes down. Well anyway, that’s what I consider what the average should be.
Alright Journal.
Got to go.
Sorry.
I guess that about hits the major stuff that I think is important. There’s others, but just in slightly different contexts. Like 30 day running pip movements…Etc…
Thanks for listening Journal.
We’ll be in touch.
Mike
2 Likes
Good morning Journal.
Let’s see.
What’s going on with me…
Yeah, I feel like talking. There’s stuff I got to get out. And well, that’s where you come in. Cause sometimes I just got to talk someone’s ear off. So thank you Journal. I’ll just sit back here on your couch and let it all out.
Alright. Here we go.
Well, we had the first week of the year come and go now.
How’d it go?
I mean, it went. No real problems. I was both excited and curious to see how my new data collecting techniques was gonna turn out. I do have to say. It went well. Maybe a couple snags along the way, but all things considered, it went good. I had to go back and fix some issues. I think I got it all now. I mean, it’s definitely gonna save me some time. I think it was only yesterday morning that I had the time to completely wrap up exactly all of what I want to see. Like on a daily basis.
For instance. I want context. I have all this data readily available. And it needs to be used properly. Like the charts that I was always used to seeing, on a daily basis. So that’s what I did. I got back my 30 day chart. I think that’s important. It’s one of the things I want to see in a moments notice. That’s all.
And also I got back some of my other charts. Probably the most important one is the chart that goes back to the beginning of 2020, and up to the present time. Know why? Because I happen to think this is the new era that we live in now. I’ve said it many times before. We live in a new time period. And it’s awesome. It’s like we have a new beginning now. I want to see what’s going on with my currencies ever since this time has started. Like with the new volatility that was shed then.
I guess you can say that this helps lay the foundation of my narrative that I have in mind with all of them. You know…what each of the currency’s have been up to ever since that bomb went off. And I think this stuff is so very interesting. I truly believe you can go back and see all the footprints that have been laid, in which will tell me where the (important) trader’s put their money. Actually, it’s what trends were being established. I mean, you have to admit, hindsight can be very instrumental in knowing what was going on at the time. Viewed after the fact.
Alright!
I’ll do it.
I’ll show you what I’m exactly talking about (cause this is fresh stuff in my head).
I just hope not to forget about some other stuff that I want to throw down.
Take a look at the EUR.

Now follow me, ok? We’re going from left to right, on that time line.
We had a nice drop before that huge appreciation (when Nagasaki went off). It goes all the way up to 6000 pips, in such a short period of time.
And then so, the most natural thing that’s gonna happen is a retracement. Right? It comes back down around three quarters of the way. And finds a happy medium. It goes sideways for a good period of time. Now, I know this is obvious stuff. But all this means something.
It didn’t retrace the whole amount. Which tells me that this currency is more in demand than not. The consensus is that it’s being supported. I’m talking, the EUR is being held and is not being sold off anymore. That’s information I can rightly assume here at the 2000 level. And then from this area what happens? It goes back up the way from where it came from, earlier. And on my chart here, where’s it at? Now up to the 4000 level. Now remember what’s going on in the world, at this time.
The world is trying to get back to some kind of normal. The medical community is doing their job, in coming up with vaccinations and such. Everyone is coming out of their houses and trying to get back to some kind of normal. Basically, mankind is dealing with the new situation and the new normal. Change. That’s what everyone’s doing. Coping. But what about the EUR? Well, their holding their own. It’s elevated.
But then you remember during the end of the year we had another round of cases. We had to go back and deal with that again. At the time, I think it was worse than initially. So basically, the battle continued. Maybe that’s what explained why the EUR took a bit of a dip during this time. Not sure. Possible. In any case, it dropped down a little. But… not back down as low as it was previously. It’s higher than that sideways action time period.
So then, the new year comes in. It’s under a bit of pressure, respectively speaking, and then proceeds to move higher. You should be able to see that all during this time that the EUR was winding up. That is something the market likes to do. Sure. We might not know this during the time, but in hindsight it is actually happening. It’s not depreciating. It’s being supported. And this has been going on for a good long time. And then we have lift off.
Right around the beginning of April. Spring time, 2021. The start of the 2nd quarter. Lift off from the 4000 area. Wow. It goes higher than the high it boosted up to when the bomb went off, right? Which is at the 6000 area. What a climb. It goes all the way up and touches the 10000 area. Now. Whoever says that a chart is supposed to adhere to certain rules? Like. I’m talking about resistance levels. What should have happened is that it should of hit that level and come back down to it. The old test and retest action that everyone thinks should happen. Uh…no. Not this time.
It’s on a mission. Up. Appreciation. In demand. Whatever you want to call it. And it has nothing to do with any kind of chart rules. Those are thrown out (good). I think it’s probably all about fundamentals at this point. All the way up to about October. So then for 2 months gravity takes place. Got to have some kind of correction. And we’re not even talking about a whole lot here. Comparatively speaking. There probably was a lot of profit taking. And afterwards, not demonstrating a whole lot of selling pressure. That was probably noticed. The buyers were tired of buying the EUR and needed a break. but then seen that it’s still in demand. So then, how about some more?
Sure. Why not? All things considered, it gets bought even more. And proceeds to continue on with the previously laid trend. Which is appreciation. So…on which note did it end the year on?
Well, if you ask me, what would make more sense is to see that it had a great year. And what normally happens is a lot of profit taking to ensue. I’m sure there were a lot of intelligent minds (a.k.a. the market) was aware of this, in fact, all year long. There should have been a much bigger retracement. But no. Maybe what took place in those 2 months previously was enough selling it was gonna get. Cause now it’s back on the rise. The year ends on such a buying note, it’s not even funny.
So. We presently have one week underway on this new year. And there’s no sign of this letting up, that’s for sure. But, me personally, I don’t follow the fundamentals all that closely on them. Like, what their central bank is up to. Only the big stuff that everyone’s aware of. But I can see of the evidence of something good. Resulting in appreciation.
I’m sorry Journal. That’s a lot of nonsense for one chart. But it’s how my mind goes through it. And I seriously don’t think I’m wrong about it. I mean, sometimes narratives can go any which way. All it is, is talking. Anyone can make a story and make it fit in any way they want it to. I don’t know…maybe this currency was nothing but better than mostly any others. After all, it is all about comparisons anyway. Right?
Well, for that matter, maybe we should look at some others.
Fine then.
The GBP.

Keeping with the Europeans, the GBP is closely related. In a way.
Well, what I see is that during the bomb, this goes in the opposite way that the EUR went. Down. From the 0 line down to -5000 area. But then, quickly retraces the whole entire move. I guess there wasn’t such a consensus about it all. But then, slowly but surely takes the road lower. We’re talking, it’s not the favorite. The consensus ends up being a sell. It goes right back on down to where it dropped to.
I guess there’s all kinds of reasons why this could be. I don’t know, maybe the Brexit things was still an issue. I’m just not aware. I guess it really doesn’t matter. In hindsight, what we can see is that the GBP was under pressure the entire year. I mean, it even resembles a bouncing ball. Look. The ball dropped down and hit the floor. Bounces back up just about the entire way, then goes right back down and bounces off the floor again. It comes back up a lot of the way, but not all of it. And then drops (quite hard looks like) back to the floor. And then, again, bounces up only a little bit. All that tells me that it’s under pressure. The consensus is not for a buy. It’s for a sell. The sellers are having their way. Not the buyers.
But then (and I remember it so well) the year was coming to a close. And the GBP started to take off. This was before it actually ended. In Dec. Well, that was the beginning of such an appreciation. What a climb. I mean, this was on purpose. All the way up to April it was steep. But then, at that time, it consolidated. Only for a month.
Well, do you remember what I said about the EUR at this time? Read back some paragraphs. This is when they lifted off. It was in April. So the EUR had all the buying they could get during this time. They were the favorite, between these 2. The Pound consolidated here for a month. I mean, they can’t go straight up forever, right?
Well, it didn’t take long in which the GBP got back on track and continued this long bull trend. Looks like they both were being bought up during the summer months. Oh, I remember it well. I can’t tell you how many times I thought this was something. Both of these currencies had the same consensus. Even the CHF was in on it. I know…cause when I see my EOD numbers, that tells me everything.
Anyway. The rest of the year takes on more buying. Sure, had some sideways action along the way. But there was no doubt of an appreciating Pound. See? When we look back on it, there’s no other way to cut it. The GBP and the EUR was a buy. That’s what was going through a lot of minds. And like I said many times already, you don’t get any more clearer of a trend. It’s the no brainer of no brainers.
So. I got to keep this stuff in the proper context. In this new era that we’re in, it’s these 2 currency’s that have been more of the favorite. And the way it looks, I don’t see any change to that narrative. I mean, we’re only a week into the new year, and the way they’ve moved already, it’s a continuation of the same. This is a good thing.
We would be correct in order to be able to say things like this…The big money is still favoring these 2 currency’s. The consensus hasn’t changed. Not yet it hasn’t. Therefore, the best thing we can do is follow this. When the time comes for a change, we definitely should be able to see it. I kind of have a feeling the smart minds will continue on with their trading plans this year, regarding these 2. Comparatively speaking, I’m talking. I don’t know how much risk on or risk off will ensue this year. I have no idea. See. That’s the problem with the equity markets. They have to know that stuff. Cause it’s only one way for them. Up. And if it doesn’t go that way, then it’s a bad situation. I don’t know…option buying stuff. Short covering stuff. Things like that.
But in our market, it’s not the same. It’s always a comparison issue. Who’s the stronger and who’s the weaker. Which side will the seesaw tilt. See? This is always the issue for us. It’s so much harder. I guess that’s why I prefer this market than any other. It’s a challenge. And only the smart traders will survive in it. Look. Anyone who has money can simply put it in a market that wants (and get’s) what it wants. Up only. Wow. You really need a lot of brains to figure that one out, huh.
Sorry Journal.
I just don’t like the equity markets. I think it’s all about money. And that’s something that I’m just not after, fundamentally speaking. But, I do need something interesting. Nothing is more interesting than figuring out which way the seesaw is tilting.
Anyway.
I’m done with that nonsense now.
Sorry.
Let’s see. I need to climb back some of my initial thoughts.
Alright. I’ll just throw it out here. This is where I was at yesterday.
I was staring at my data. It was something in particular. But this is what came at me. I think I need a momentum indicator.
So I started to research this. I didn’t get too terribly far on this yet. So I guess I’ll have to use you a little. If I talk about this, maybe I can get a little farther on it.
You should know me by now Journal, how I’m not gonna go with the crowd. I need (want) my own indicator. And I want something to tell me what kind of momentum a trend is taking. See. I think this is the most logical next step to be taken. Man…I’ve been all over this trend business lately. I mean, I believe I’ve found the way to follow it. That’s how to follow the correctly determined trend.
Well, I need a little bit more. And I think it’s encapsulated in momentum.
In my research I found that momentum is defined as the product of mass and velocity. This is in the field of physics. The mass of an object is a big factor. How much something weighs makes a difference. Like, the example I seen. If you have 2 objects of different weights, and they both fell from the same height, you’ll have the heavier object have more momentum than the lighter object. I think it’s interesting stuff.
But in my field, the object doesn’t have any weight. Well, maybe it does in some sense. But simply speaking, it’s not an object to begin with. It’s a currency. Currency’s don’t have weight. This is abstract stuff.
So then, what do I want to know, exactly? I want to know the momentum of a currency’s trend. And of course you have those who’ve been there and made up their own momentum indicators. You got the RSI indicator, MACD indicator, etc…
Great. That’s all I want to do. Follow the crowd. Just put up an RSI on your screen and follow accordingly.
Sorry. I’m turned off already.
Not gonna happen.
What do I want?
I want to monitor a currency’s trend.
- I have a beginning of a trend.
- I have an ending of a trend.
- Some trends are longer than others.
- Trends change all the time.
I just want to see how they change.
The rate of change that takes place all during it’s trend.
You know, when it’s at it’s strongest. When it’s at it’s weakest. The oscillating strength and weakness that occurs during that time that it trends. And the reason why is because of trading purposes. Well, more precisely, for analysis purposes.
Here. Let me show you something. I made this up this past week.
This let’s me monitor every currency’s trend.

This is a sample of the top 5 currency’s. Can only get so much for a pic.
Basically, if the currency is in green, it’s in a bull trend. USD,EUR,GBP,CHF.
If in red, then bear market. JPY.
I’ve only been doing this since May of '21. And I can’t go back any further, cause I don’t have any indicator which tells me what trend it’s in. Remember how I do this. I pull up their chart (running pip count chart) and it’s all determined discretionary. Yes. I said it. This is all subjective. It’s actually chart reading. Line chart reading anyway. I guess I can show the equivalent of where those numbers came from. Let’s take the USD for example.

So. Let’s compare that table above to this chart. It’s correlated. The USD is the top most currency. The row just below the USD, in white, is where the line ends that day. The latest is at 2046 (Jan 7th). Then underneath that is the row that tells me where this bull trend started at. Which is 1670. That was back in Nov sometime. See it? That’s where I deemed, called, this trending high. I probably called that 1500 line the line in the sand then. But remember that I play the week at a time. So whenever a Friday ends is the time when I will make analysis decisions. I’m sure that on an EOD Friday that this line was sitting on 1670. And I changed their low trend to a high trend. And so, underneath that row is my line in the sand. I was calling the 1000 line the dividing line between being in a bear market or a bull market. You can see that last line was nothing but 1000 the whole month.
But. I just changed that line, yesterday. Now I put it at the 1500 line (a bit higher). My analysis has changed. And that’s the way it works. The more information you get, things have to change. Surely I’m not gonna wait, if it happens, that the line goes all the way down to the 1000 point. I mean, of course, the trend will have changed back to a down trend by then. But I happen to think, and will determine, if this line (b.t.w…which is it’s aggregate pip count against every other currency) drops below the 1500 area, then it’ll be trending low. I’ll change it’s determined trend.
Look. Lots of factors went into my decision on this. I look at a number of things. Context after context. Cause look at what’s happening to the USD lately. It’s been on a decline. Right? I just had to determine how far down it’ll go in which I think the trend has changed. So, as it stands, it’ll have to drop another 500 pips from where it’s presently at now. Check this out. This is one of the reasons why I chose this. Look.

Remember. Context is everything. And so. When I consider what’s happening this year, alone, this is what I got. The USD is elevated. You can’t argue with that. Both in the pip count, and the % count (as you can see there). And what did I say? I needed to see the USD drop another 500 pips before I will consider changing their stated trend.
So. On the one hand, as in their longer context, their dropping. Yes.
But on the other hand, so far this year, they busted out buying the USD so far. See what happened on the first day of the year? They ended up over 400 pips in the positive. That’s telling, if you ask me. And then retraced a lot of that in the rest of the week. But…they are still up. Who knows? The Dollar bulls just might have some money reserved for buying it up. We don’t know.
We just had NFP Friday, also. That spelled bad news for them. Maybe, in fact, that was the reason why it jumped out of the gate early on. Cause it was supposed to be a good report (maybe). But nope. It’s doom and gloom. And this shows those results. Who knows? Maybe all that doesn’t matter one single bit! Cause if money wants to continue on buying the USD, then just give it a few days, and it’ll come back. We just don’t know. But, therein lies the secret. We need a little more time. We are able to see the footprints of what the money wants to do.
Alright. There’s a little analysis for ya, no charge. But you can’t argue with the fact that their aggregate pip count level not only has to go lower than the most previous swing low (1877) but also go below the 1500 line also. That’s what I say.
Anyway. I’m off track.
My point is that I’m tracking the trend. Each currency’s trend. This is my secret weapon. It works. I’m confident of this. This is tried and true, to me, ever since May of last year. But I need more. It’s the momentum I want to see that occurs throughout it all. It should be a tell about when things change. Not that that’s always the case, but it should be an indication anyway.
Getting back to what momentum is, well, what it isn’t. It’s not an object. Duh.
But I would like to see the rate of change that it takes in the direction of it’s trend.
And so, what do I got? Well, I got two things. Only. I got either positive or negative. Positive moving direction will be in whichever it’s going in. Negative direction will be in the opposite direction. I know. Mr. Obvious here. But that’s the only thing I’m dealing with. I’m not dealing with any other variable.
So. How can I count it’s metric? What metric?
Well, I will be counting it’s pip movements. I could go with it’s %. I have both. But I won’t. I believe in the amount of travel all counted up. Cause we trade in pips. Not %'s.
I believe in daily ending pip results. That’s like the most fundamental important piece of information that I deem…important. Everybody had their turn. It’s the consensus. Hey…some sessions are stronger than others, but that’s the way it goes. Everyone put their money on the line and had their chance. Where it ends, I believe, is most telling.
Look. All that nonsense is simply to say that I believe in EOD results as the most important piece of knowledge of where a currency is headed.
There has to be a way to frame this as momentum. Like…is it moving more stronger in the way of it’s trend? Or away from it? Is this retracement (gravity) driven? Or is it moving with a purpose? Or is there a change happening?
I think knowing what kind of momentum is occurring should be able to answer some of these questions. And also to learn of how it occurred in the past. It’s just the clues I think could be important.
When I learned a little about the RSI indicator, I couldn’t understand it. I don’t have the literature in front of me now, but I’m pretty sure that was looking at the last 100 days (or time periods). Who looks at that? What happened 100 days ago, in my mind, means nothing.
Now. What happened yesterday, and all the way up to a weeks worth, means something to me. Surely not 100 days ago. That’s nonsense.
This is what I think is important.
- A daily result.
- What happens in one complete week.
- How a week unfolds.
- In a context of the prevailing trend.
Now. Whatever kind of momentum I can come up with will have to have those important aspects somehow intertwined into it.
Journal.
I don’t have an answer now. This is as far as I have gotten.
I’m just using you to sound off at.
And this is what I’m working on.
I think this is very important.
Thanks for listening, Journal.
Mike
P.S. — I did want to talk about trading. I don’t have the time now. But regarding that, the only thing I have going is my NZD/USD trade, that’s a marathon trade. It’s got to be over 50 days running by now. I’m still in the red (of course). I do think the USD is gonna be depreciating now. I think that was the result of NFP Friday. And the numbers (USD pip count) seem to be going down. I have no idea what’s gonna happen. But I think there’s hope for this trade. That’s why I’m still holding onto it. And also not trading any other trade. And concerning my long running trade, it’s not running yet. I haven’t placed anything yet. I need a little more time to play out before I jump in. I’ll clue you in when that happens. But when I do get in on one, it’ll be running for the rest of the year (not necessarily being the same currency pair either).
2 Likes
Good morning Journal.
I got some things on my mind I need to get out.
That’s what you’re for, Journal! Thank you.
So. Here we go.
Well, you might remember the latest thing that I was working on.
I was calling it momentum, right? A momentum indicator.
Well, I ended up with something. And it’s what I want to show you. I think it’s interesting. This is not exactly what I wanted on the onset. But it’s information that might be useful. We’ll have to see where this leads.
This is where I last left off though.
And this is what I came up with.
Ok.
What am I talking about, again?
The trend. So. Let’s take something easy.
The EUR.
This is their trend.

That chart right there shows me everything I need to know about their trend.
Well, all that follows will be coming from that chart.
Let’s zoom in on the EUR since the year started.

I’ll explain.
All of what’s in the box’s on the bottom is nothing but what’s up in their chart.
From the bottom, up:
- The line in the sand in which separates bullish from bearish (6000)
- Point where this latest trend started (6378)
- End of day, latest (white box)
Now. All that is stuff that I already had. Ever since May '21. And again, all it is, is what’s in their chart. I just want to see the raw numbers. Cause if at any EOD I see that white box start coming down and drop below the line in the sand, well then, that’s when I will change their stated trend. A real no brainer here with these guys.
Now what I developed this week is just above this raw data. Above the date.
Still working from low to high.
- This row is their EOD aggregate pip counts (net amount of pips of all their 7 EUR pairs added up)
- Next row up is the weekly running pip count (shows me how the week is unraveling)
- Third row up is nothing but the weekly net pip count amount (equals the box directly underneath that one)
- Then the top row is: what trend they are in (will be either red or green in color). And the total pip count ever since this trend has started.
So. You should be able to see how I got all of what I think is important.
And basically, all I’m doing is looking at how a week unfolded and added it up to the established total.
All I’m really doing is looking at their trend. On a daily basis, and on a weekly basis.
So, do I really have some kind of momentum indicator here?
Uhhh…kind of…I think.
Actually, what’s the difference between this and what’s on it’s chart?
Ah. Good point.
Therein, lies my point.
What the eye see’s on a chart doesn’t give you what is important.
What do I think is important?
A TIME STAMP
More specifically…
A WEEK
You don’t see that on the chart.
I happen to think what happens in a week is VERY IMPORTANT. Because, we have a start and an end. We have analysis going on in between. It’s the lull in the action. Profit taking times directly opposing it’s trending times. I can go on and on about why I think that. But it doesn’t matter.
What I care about is :
- What trend is taking place
- For how long it’s been going on
- See how the changes take place (when it changes trend)
- Comparing each currency’s trend to the others (since we trade pairs)
- Being able to view this dynamic
- Know what was produced in a week, regarding their trend
Ok. So. All of what I got up there is a bunch of numbers. Yeah, it does look cluttered. So I needed to consolidate these numbers, for multiple reasons.
I’ll stay with the EUR. Check this out.
Each box is the running total (pip count) since the trend started. It gives depth. And it doesn’t take long for the mind to be able to see what’s been happening when you look at the totals. Just look at the EUR here recently. You don’t need to be a genius to see that their trend has been getting stronger every week. I don’t need a chart to show me this. The numbers tell the tale.
But, we’re getting a longer view out of what their trend has been doing. You can easily see when they went through that short (relatively speaking) bear trend. That coincides with when the chart was showing the line moving downward.
Ok. That’s nice. I know.
Well, we trade pairs. And that’s another reason why I do all of this stuff. Cause sooner or later I am going to be picking a pair to trade. At the right time, that is. Well, this will aid in that decision making (should anyway).
Timing is everything.
Try to remember that Journal.
I am.
Alright.
Ready for this?

Let’s see. Got much information here. How can I spell it out?
- Very quickly can I see who’s trending what. USD,EUR,GBP,CHF trending high (in green). JPY,AUD,NZD,CAD trending low (in red).
- Very quickly can I see how long they’ve been trending. Every since their trend changed last.
- The numbers inside tell how strongly the trend is. Remember, the number is how many net aggregate amount of pips it went in, ever since it started trending that. Therefore, positive amount will be bullish. Negative amount will be bearish.
Let’s work our way from the bottom and go up.
Take the CAD. What can we say about them?
- Been bearish ever since week ending Nov 26th.
- The latest is - 1348 pips deep into this bearish trend.
- No real sign of coming out of this.
- Is matching the other two Comms.
Next is the NZD.
- Been bearish ever since week ending Dec 3rd.
- At - 1169 pips deep into it, presently.
- Went net positive this past week. (from -1361 to -1169) That’s counter trend.
Then the AUD.
- Been bearish ever since week ending Nov 19th.
- At - 1298 pips deep into it.
- Also went net positive this past week.
- A quick look back at this trend shows they really dove down at week ending Dec 3rd ( -2737 pips deep then). Then climbed a lot by the end of Dec. (up to - 672). But then fell since then, this year so far.
The JPY.
- Been bearish for a long time.
- It’s sitting at - 7689 pips deep into it.
- The numbers are pretty steep. No sign of climbing out, anytime soon.
I need to show the table again.
We’ll start looking at the trending high ones.
The CHF.
- Trending high ever since week ending Nov 26th.
- Sitting on 581 positive pip count. That’s not too terribly convincing.
- Actually, they’ve been slipping ever since week ending Dec 31st.
- I wonder who’s been working hard on that…(cough SNB cough)
The GBP.
- Been bullish for a long time.
- Sitting on + 6939 net pip count. Has really taken off since mid Dec.
I already did the EUR.
But let’s look at the USD now (there’s a reason why I kept them last).
- Been in a bull trend ever since week ending Nov 19th.
- Sitting on - 175 net running pip count since this started.
- They’ve been declining ever since week ending Dec 17th.
- Back the bus up…This is the only currency who has a trend that is resulting in the negative. Meaning, they’ve retraced 100% of the pips since that trend started. If you look around, you’ll see that a trend will change whenever that number goes below 0. It makes sense…whenever something retraces more than 100% it’s not technically trending anymore (lower low made).
Well, since all this data is nothing but what’s on their chart, let’s go ahead and look at it. For confirmation purposes.

For a chart watcher, yeah, it’s evident. I called that 1500 line, the line in the sand. Below that is bearish territory. I mean, look from where it came from. Duh.
This is what I like to look at.
So much more data here than what the chart shows.

Well, let’s start with what happened this past week.
- Net pip count = - 551 against their trend.
- Monday starts off on the right foot (trend). + 135 pip count
- Tue, Wed, Thurs all counter trended (-302, -503, -112). That running count got all the way up to - 782 pips just when Friday started (EOD Thurs).
- Friday goes back to it’s positive trend ( + 231 pips). Making the total running count a - 551 pips.
- Now. Their entire bull trend was sitting on + 376 positive pips when the week started. But this - 551 pip result brought the running total down below zero, to - 175 pips.
- On Wed you can see (bottom part in green/white squares) that the EOD figure went below the line in the sand. + 1376 . Above it was the line in the sand + 1500. And then above that is where the trend started from + 1670.
- Now. When I see, for a trending high state, the EOD (white box) go down below the other 2, that tells me it’s time for a change in trend. During a high trend that white box should be above all the others. During a low trend that white box should be on the bottom.
Look. All that nonsense tells me it’s time to change the USD trend.
I count them, now, as trending low. So. Let me go back and change this. You’ll see how I will start the week off.

- The line in the sand will be the 1500 line. Top box.
- My starting point will be the 1495 line (cause that’s the EOD figure for Fri).
- And the last box will be the EOD figure.
Look. For all I know the USD can easily ride higher from here. Sure it could. Anything is possible. Of course. Duh.
But, I play it all a week at a time.
Sure. By EOD Mon it could rid higher. Even Tue or Wed.
But I bet you there’s a better chance that by the end of the week that I’ll get the truth, more than in any other day of the week.
What I’m saying is, what happens on any day of the week is not as important as how the week ends. Now that’s what’s important.
But this is how I got to start the week out. Cause it went below the line. And this is the time that I make these decisions of what trend it’s in.
I could be all together wrong. No doubt. It can be a real fake out.
I know.
I know how the market can be.
If that’s the case, then I’ll see higher numbers. Then I’ll change it back…next weekend. And we’ll call all of this downward movement, of late, nothing but a fake out. Hey…if the market wants to continue moving this big ship back and forth like this, then so be it. They are the ones who have to absorb the costs that come with that. Cause it can’t be easy moving millions and millions of dollars on a dime. It’s got to be costly.
Then again, I don’t need to trade the USD.
You have to admit, this has to be one of the worst currency’s to trade. More precisely, the USD trend isn’t always consistent. Well, comparatively speaking. Just look around. The other currency’s show much easier, longer, trends. Ok. Maybe the CHF is similarly difficult. But, it’s all relative to one another. That’s the beauty of the game. We got much more possibilities of what we can trade, than other markets. No comparison.
Well, before I move on. I want to mention one more thing, regarding this USD trend. Journal, you should know by now, that when the USD changes trends, surely, it has ripple affects in the market. I think they call it knock off effects. In any case, other currency’s tend to take a turn as well. The most well known directly opposing affect usually goes to the commodity currency’s movements. We’ll have to see if this takes place.
And well, that’s why I do what I do. Cause I want to see it. I need to see change happening. On this aggregate level first. Then this should tell me about what I should be trading. Let’s face it, some pairs are better to be traded than others. Everything I do here is for the bottom line of trying to pick the best pair to trade. I would also like to figure out whether it’s best to pick an already trending currency, or one that has recently changed.
Yeah, there’s always questions I would like answered. Even if it’s to find better chances than others. Like, the length of being in a trade. And how about finding which currency’s are better to ride out their trend than others? Things like that.
This is one thing I’m constantly trying to keep in mind.
See. Each currency demonstrates different characteristics. Therefore they all shouldn’t be treated equally. Right? I mean…who can’t see the huge differences between the EUR and the USD, as shown above? You can’t argue with me than the USD pairs are easier than the EUR pairs. As a whole. And I don’t even need to go and look at every single pair on the charts. It just can’t be, cause I’m taking all of those into account, to begin with. It’s the aggregate. The sum of all it’s parts.
So. To be able to narrow down the characteristics of a currency is very helpful. It should give me better chances. But then you got 7 choices within that. I just would like to find the best one, that’s all.
Speaking of trading, Journal, this has been on my mind this week.
Ok. So.
I got my one anchor trade running. It’s been running, as you should very well know. The NZD/USD long. It’s quite the marathon trade alright. Probably at around 50 some days and counting. The good thing of it is, that it’s not closed yet. Therefore, I haven’t lost anything yet. But at least it’s starting to head in the right direction. Look.

Here’s the proof.
But you can see that triangle of exactly where I bought this pair. Back on Nov 3rd.
And the details are all there to see. The account balance and everything.
But…I have to say it (again). It’s still open. And no one can tell me that I’ve lost anything. Not even my broker. Cause guess what? It’s not closed yet.
I will prove this point. One way or the other.
Anyway. This is my Anchor Trade. I believe this is on it’s way up.
And why?
Because of what this chart shows?
Nope.
One chart means nothing to me. I despise what one chart says.
I made my peace about this previously. So I won’t go there again.
Journal, I just got done showing you how the trend of the USD is changed to trending low now. Haven’t I? I’ve been watching it go lower. And now all the way to a changing trend. No one can argue this. It’s all facts. Now. If the market proves me wrong…then so be it. It’ll have to show me first, though. But it is heading lower now.
Now, the NZD hasn’t shown me any change in trend, yet. Their still trending low.
All I can say about this is that the NZD has been on such a long bear trend that we can only go up from here. It only makes sense that this pair can grow legs.
Oh, did I forget about the fundamental fact of the interest rate differentials between these two currency’s? Or did we throw that stuff away?
I’m not buying it. In fact, I’ll always stand on the reason why this was a good trade to get into in the first place. The NZD raised their interest rates. The USD didn’t. And in this world of finance, that’s a factor. I don’t care who you are. Sometime it’ll come into play. In the meantime, you’ll just be calling me the Marathon Man, that’s all.
Ok.
So.
That’s what’s going on with that trade.
My Anchor Trade.
I do have another trade.
This is called my long term trade. It’ll be running all year long.
But I haven’t set it up yet. I’m gonna wait a little longer.
The gist of it is, that I want to be in on the pair that has the biggest spread. Journal, I’m sure you remember my explanation on this strategy. But the purpose is that I want to ride the longest trend of the year. That will come to me by picking the strongest currency against the weakest currency.

The top table is the % yearly running, the bottom is the pip count running.
And on both, you can see that we don’t have a problem seeing which currency is the strongest. The GBP. But for the weakest, we do have a problem.
I thought we might have had a winner, with the CHF, at one point. Boy…there was one day that they dropped off the map. Look there. It was on Monday (10th). Man, I don’t know what happened that day with them, but it was something. They dropped 7.13% that day. So, I started thinking I would be going with the GBP/CHF long trade. But as the week progressed, as you can see, it didn’t stay that way.
What I think might happen is that I will wait this month out. We’re half way through now. And boy…if I see that the CHF comes back down to being the last currency, I’m definitely jumping in on that pair. I kind of think that might happen. Because, like I said, that drop on that one day is meaningful. Too meaningful if you ask me. I’m thinking that is like a foreshadowing of things to come. We’ll just have to wait and see.
So. That’s what I’m waiting for, for this long term trade I want to get in on. Actually, it’ll be the start of it. Cause, over some time I can’t expect the top currency and the bottom currency to stay that way. Right? That can always be changed up. Switched up. So then, in that case, I’ll switch the pair that I will be in to whatever that comes out to be. Know what I mean?
Anyway.
That’s the 2 primary ways I’ll be trading, this year.
But, I’ve been thinking about something else.
This is what I’ve been wanting to tell you about.
Here we go.
Journal, I want to build.
I want to start building a capital base. But this is in what context I am talking about.
Try to understand me here. I’m not talking about trying to come up with enough money to start trading my full time trading business. That would be impossible. My minimum amount that I think is possible is 100k. That absolutely cannot (will not) happen.
What I am talking about is proving to myself whether I can build a monetary base, period. I’m talking, where it doesn’t even matter about the amount. I think that’s when I get into trouble, when I start thinking about the how much part. But simply, can I build an account? Well, if it’s that simple, then of course I can. I want to prove it. I’m pretty sure, if the amount doesn’t matter, that I can build.
I’ve had a live account (and yes, with real money) for quite some time now (3 or 4 years long now). I only had around $100 in it. I didn’t trade it too much. I would take stabs with it from time to time. Win some. Lose some. But always kept it above water. I’ve been concentrating on my demo accounts way too much recently. See. I play seriously whether demo or live. It’s all the same. In any case, I decided to start with this. Since this won’t cost me anything and it’s already established, it would be perfect.
Now’s the time to get serious with this. It’s all gonna be about whether I can build. Over a lengthy period of time. Simple as that. Ok. We’ll say over the course of this year. Therefore, all I’m saying is that, at the end of this year, can I answer the question of can I build an account balance?
I don’t care about the amount.
I don’t care about the % of increase.
I don’t even have a purpose for it. Cause it’s been sitting there probably getting moldy or something. It’s long lost money.
It won’t be used for anything other than being a number in which to answer my question.
Can I do this?
I’m gonna be concentrating on the word build.
If I can be faithful with little, I will be faithful with much.
Well, it’s time to see whether I can be faithful, period.
I started already. Here. Let me prove it.

Looks like my account balance was $82.29 when this trade began. Also, this looks like I got in on it last Friday (I can’t really remember exactly when). But the triangle tells you when I got in, and where.
This leads me to tell you how I will be trading with this.
I will be using my established trading strategies. Basically…nothing different.
I hopped on the NZD/USD pair. Cause that is what I’m doing with my Anchor Trade trade. You know this already.
Well, the only other way I would have a trade running in this account will be if I get my long term trade going (whenever that comes about). Other than that, I won’t be trading any other way. Since I am very confident in my 2 trading strategies, nothing else makes any sense.
But I guess there’s more to the building aspect, that I have in mind.
Why can’t I use outside money to build the account? Right?
Who says I have to generate it from the market, only?
Building…is building.
Whenever I get the chance I want to throw in from wherever I can.
This is all I’m after.
Build from the ground up. And this is definitely from the ground floor.
Boy, Journal. I hate it when people get inherited a business from, say, a father or a relative. Then they carry on the family business. Sure. Now, they are the owners. Ok. They think their somebody. But I’m sure no one really thinks about whether they actually built the enterprise themselves. Know what I mean? But they are the recipients of it now and it looks like their smart enough to continue it. I guess some very well might do it some justice. But surely not everyone will.
Because unless you build it yourself, what are the chances you will care about it like the actual builder? There will be no comparison. The builder, the creator, will take care of it like no one else.
I want to be a builder.
So I’m setting out to prove it.
Trust me, I won’t be inheriting any part of it. This is all original stuff.
Well, I’m sorry Journal that this post is an all day marathon post. I just got pulled this way and that throughout the day today. But I think I finally hit all the things I really wanted to.
Thank you for hearing me out Journal.
I always feel better when I’m done.
Thank you!
Mike
1 Like