Good morning Journal.
Wow.
Man Journal, I just finished up a big project. It only took me almost 4 days.
Well, let’s just say that I took full advantage of this 4 day weekend I just had.
Thurs and Fri were snow days. So, no school. Therefore, no buses.
But, I have to tell ya. I spent hours on this Journal. I can’t believe it.
I’ve been known to do some heavy number crunching before. And well, I guess this is just another one of those times.
Well, you’re gonna get it all in full. Cause I need to tell someone. And I’m not doing this stuff for nothing. I know I can count on you Journal to sound off on.
And also. I did learn some more things going through this.
I think this stuff is important.
Very.
Ok then. Let’s go through this.
As I do, I’m gonna be able to assess what’s going on in the market, all at the same time. So I’m going to hit two birds with one stone here.
In fact, this is the whole entire point of why I do this in the first place.
I need the correct picture.
I want to know what’s really going on.
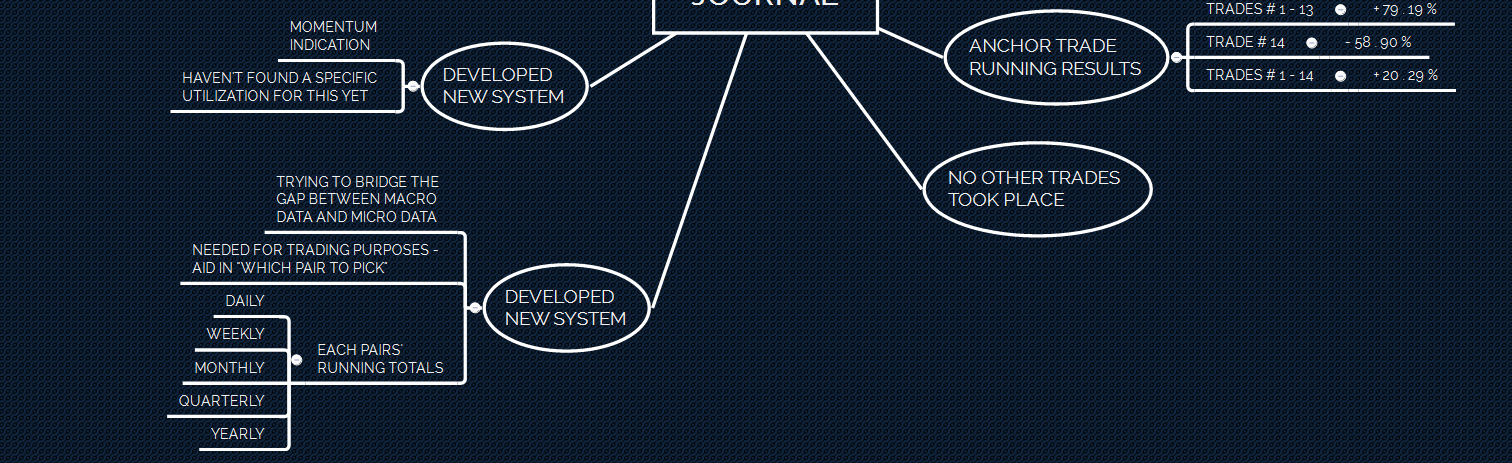
Well, this is the system I already developed. You seen what I was doing Journal. I showed you a lot of this. Well, I just redid it. Went through it with a fine-tooth comb.
Let’s see.
Where do I begin?
How about from the top. I’m gonna go through this currency by currency.
We’ll be looking at the macro picture.
And we’ll also learn what a trend is (cause this is mostly what I’ve been learning).
The USD.
How are they trending?
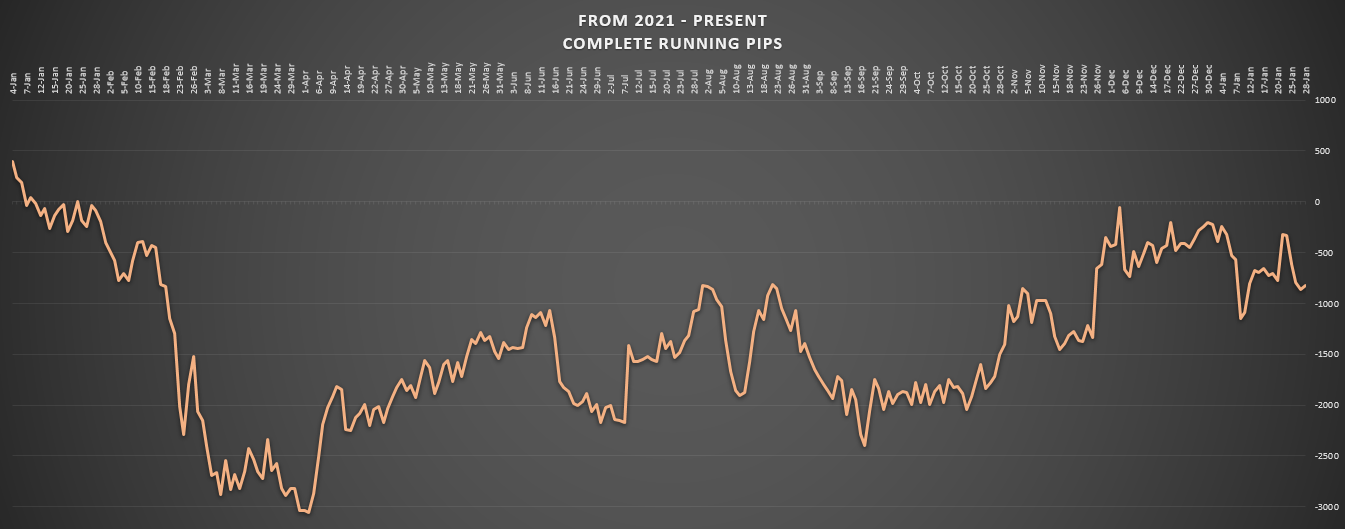
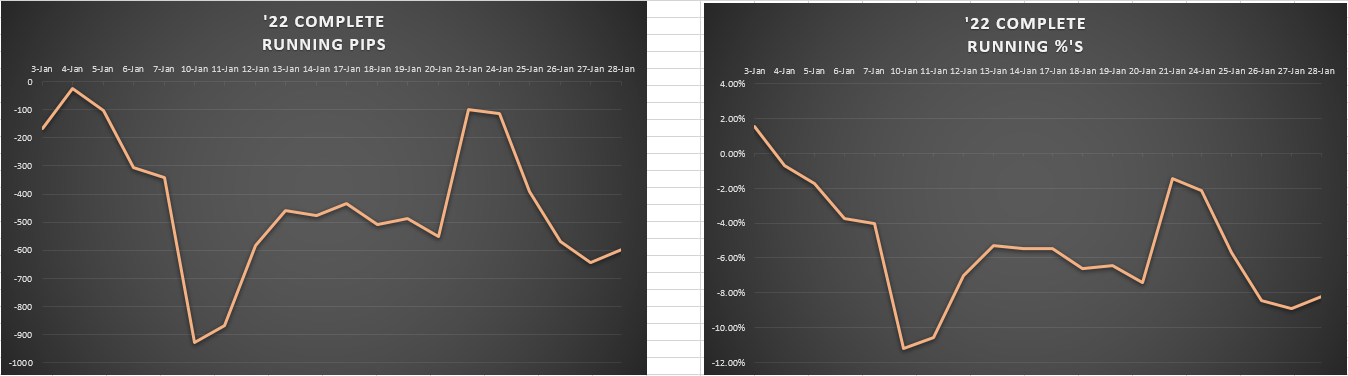
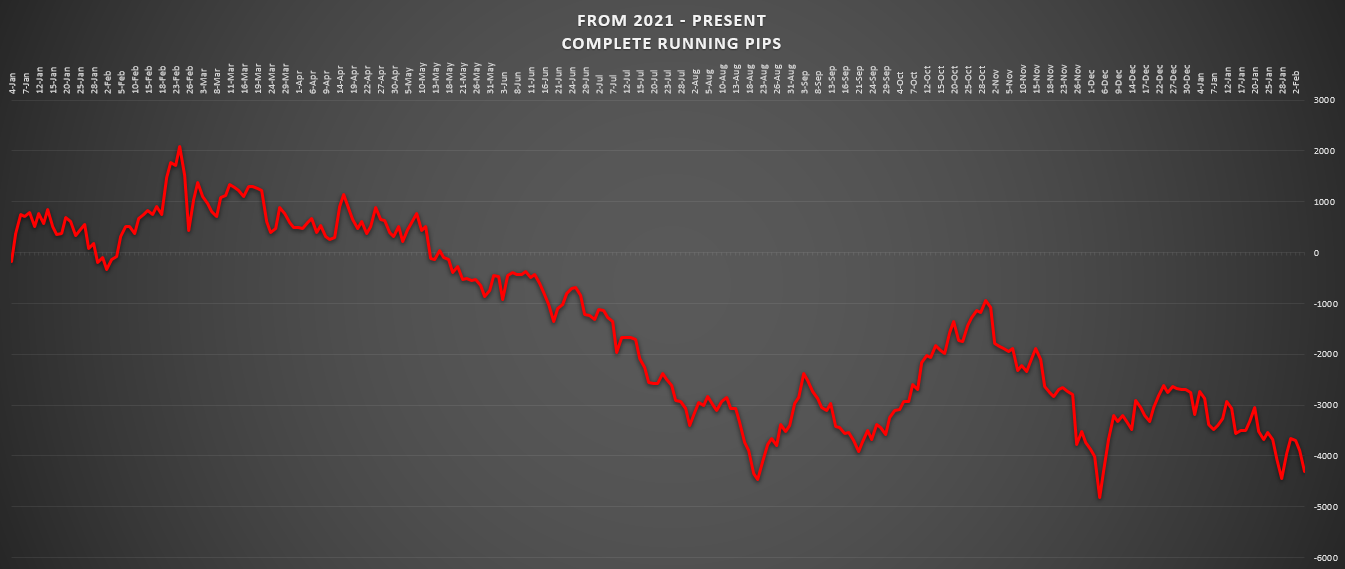
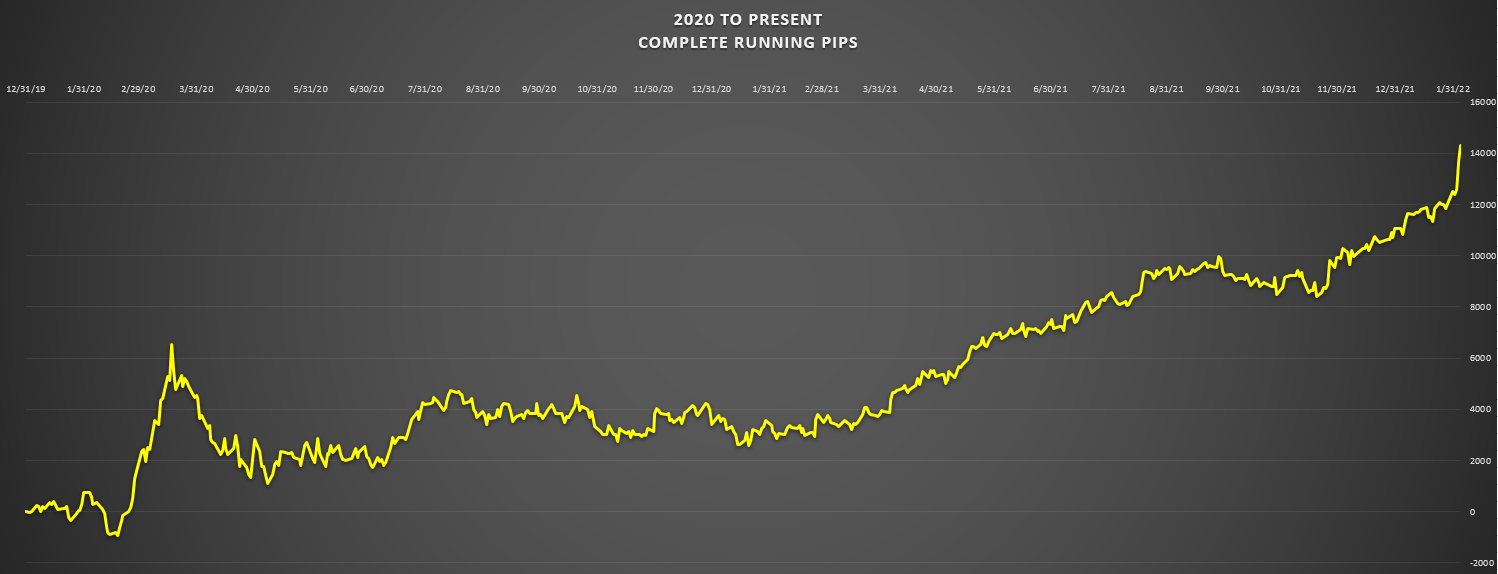
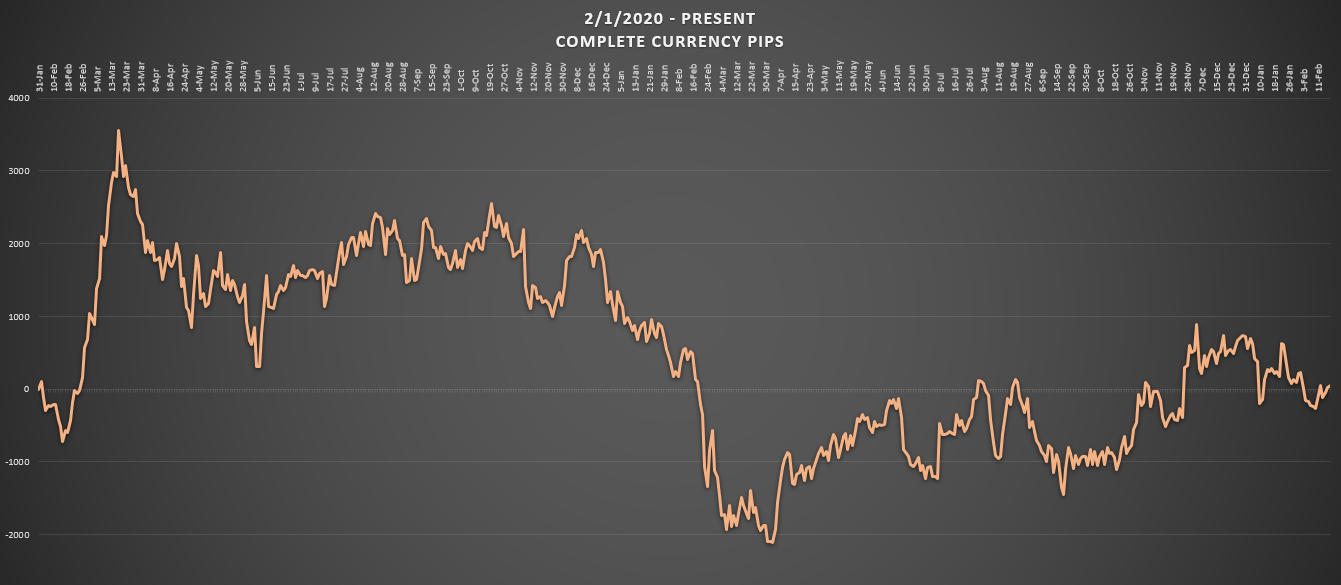
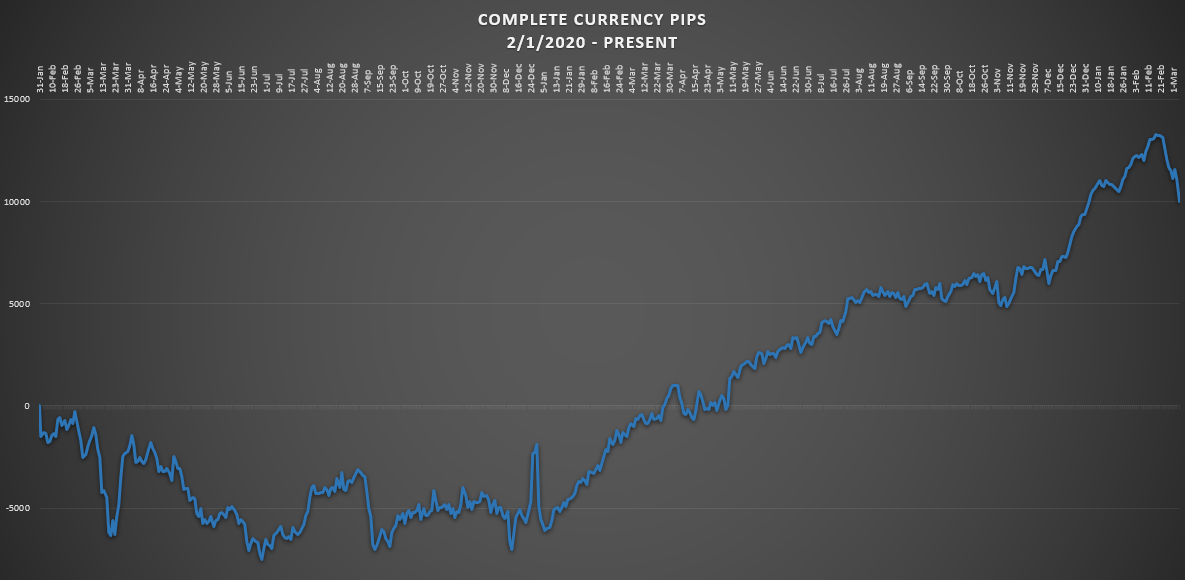
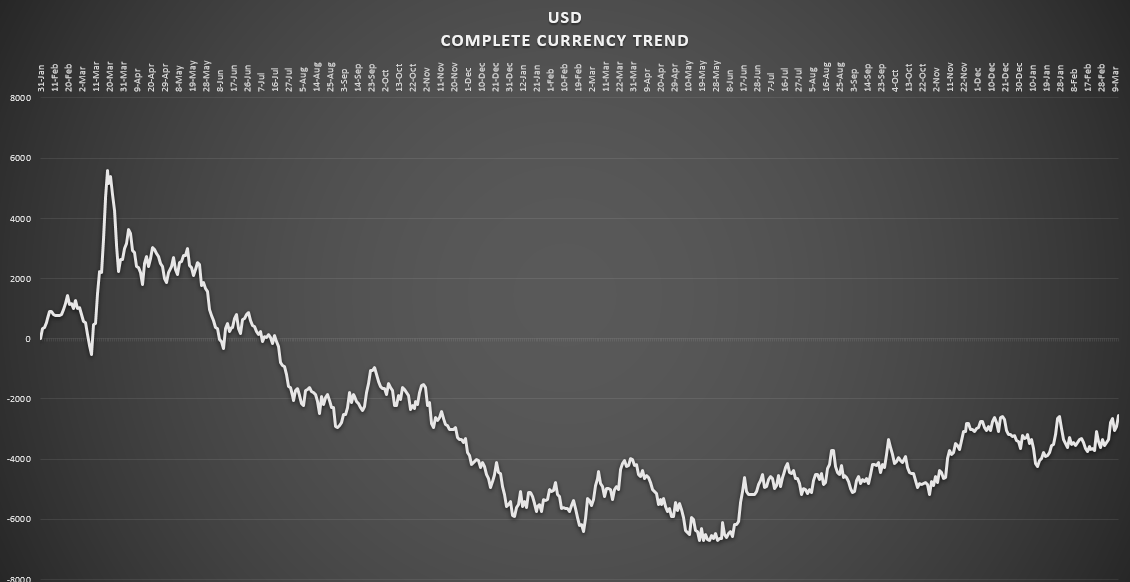
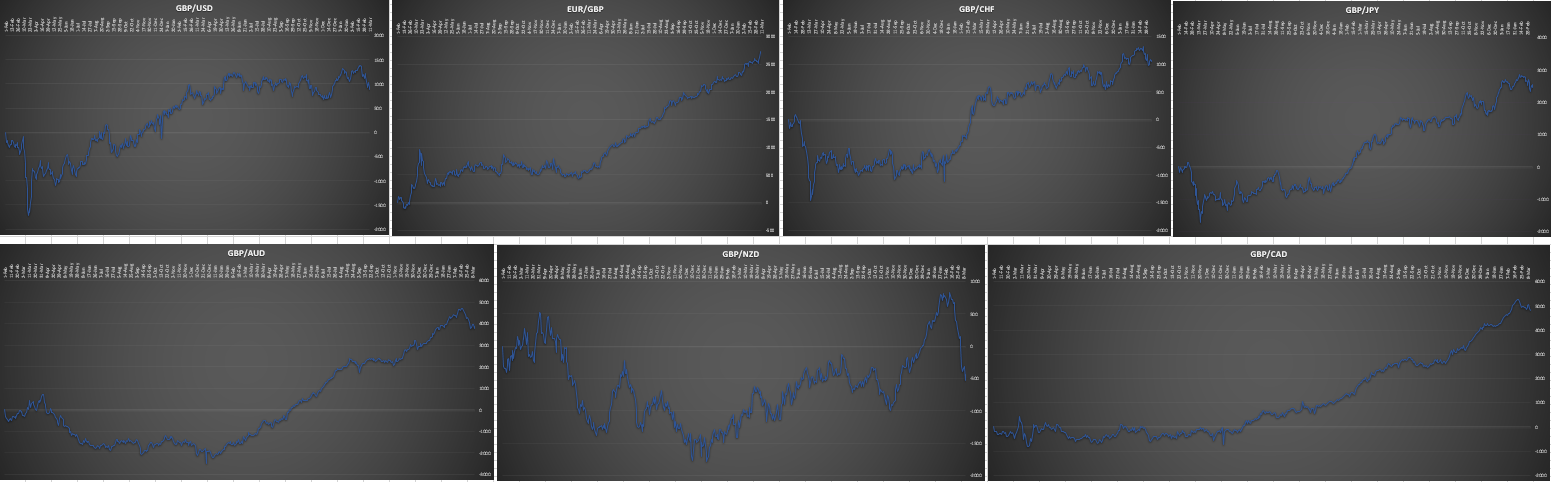
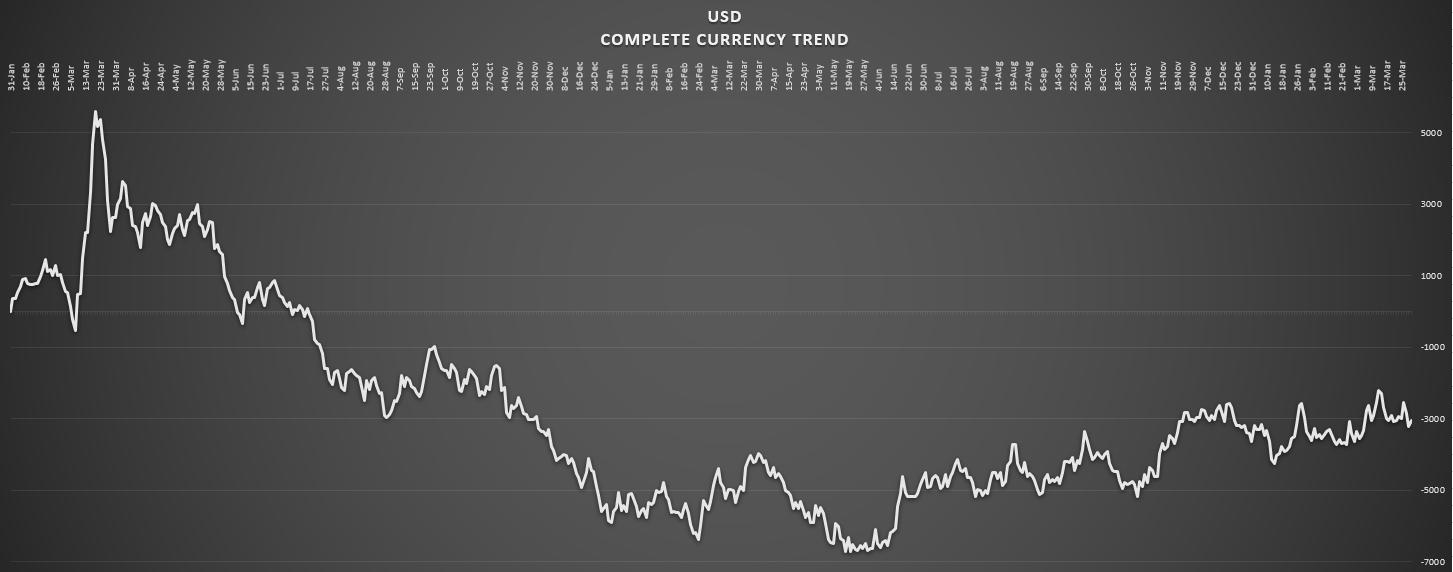
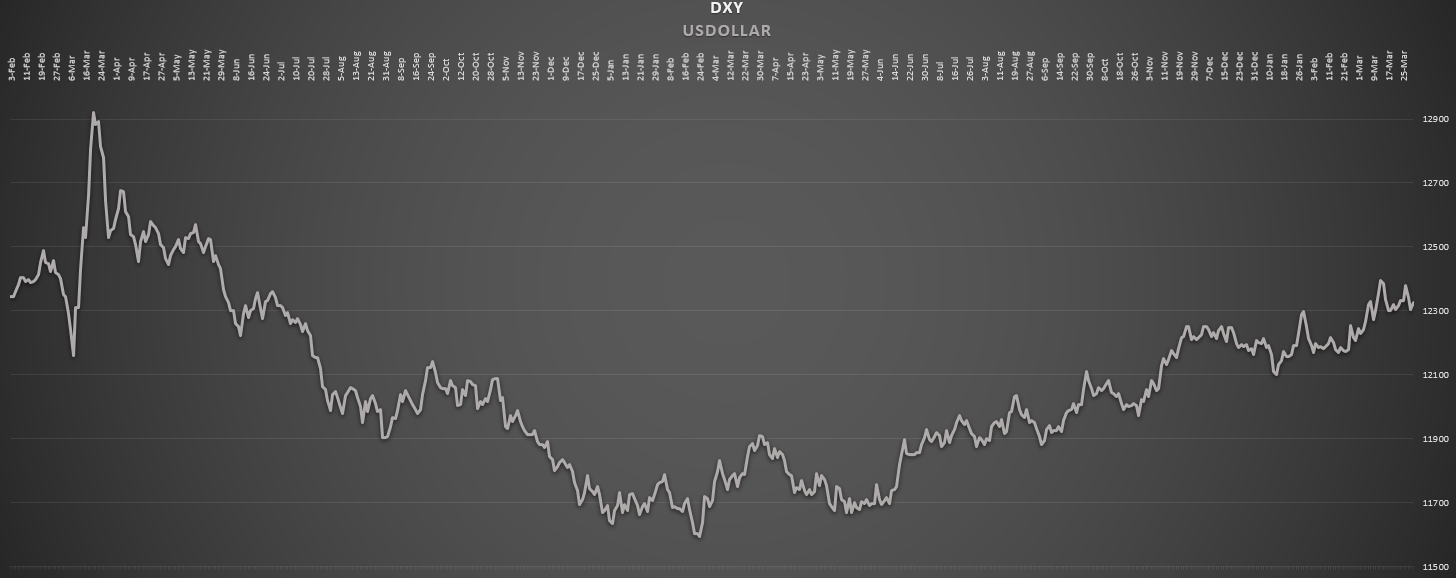
We have to look at the macro picture. I call it the sum of all their parts. All 7 of their USD pairs. More specifically, I keep track of the pip count. This is what tells me how they are trending. Let’s take a look.
All it is, is the daily total pip count. In reality, all this is, is what the consensus has been, coming out of the market. Every currency gets counted this way and is compared equally. That line on the chart is nothing but a number. It’s a number that’s compared to the number before it. Drawn out. On a daily time frame.
So then, what’s been the trend concerning the USD?
Context is everything. In this picture it looks like they’ve been on an uptrend ever since May of last year ('21). See it there? See that bottom they carved out. It looks like a floor. Pretty cool. Ok. That’s nice. Well, ever since then they’ve moved higher.
See. And this is what I’ve been learning. Ready?
We only learn in hindsight.
You’ll see this theme throughout this entire post. But for me, this is deep stuff.
Anyway. The USD has been making higher highs every since that time. Not lower lows. Right? Therefore, they are on an uptrend. Has this every been changed? Along the way? Well. In what way would it change in the first place?
— Not higher swing highs.
— Lower swing lows.
— Sideways.
It’s pretty evident that the USD is supported.
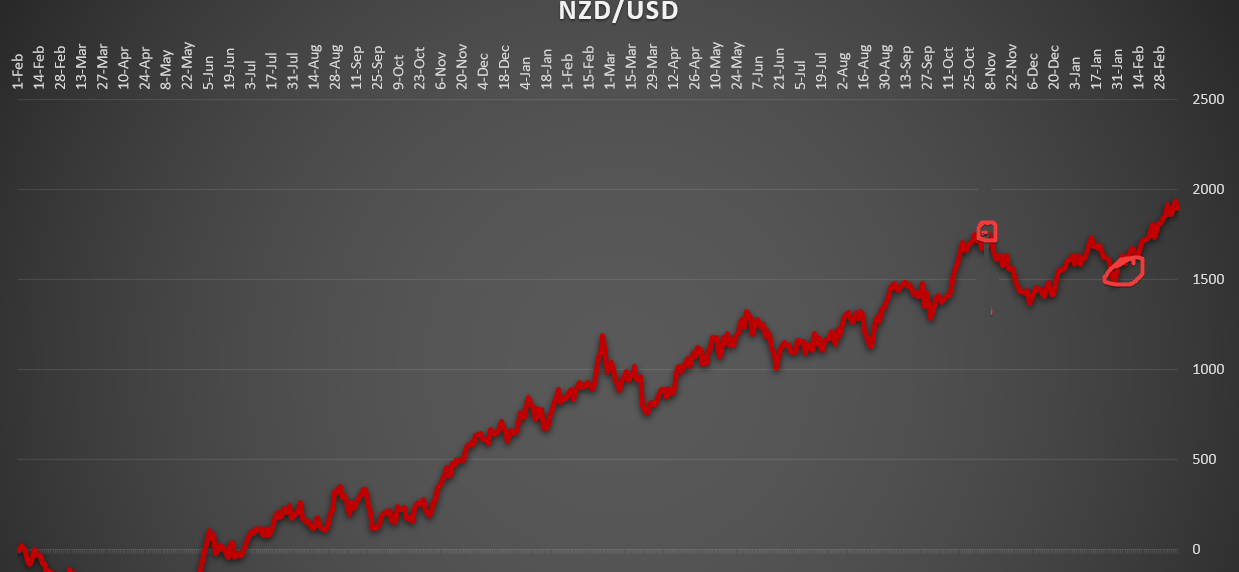
But, I got to tell ya Journal. You might remember me telling you that I think the USD was changing from an uptrend to a downtrend recently. Remember? Look at the dates. From mid Dec to mid Jan. That drop there got me thinking, alright. I definitely thought we were gonna be seeing a change in trend. You have to admit, during the time that it was happening, it sure did seem like it. Feel like it. I even thought that the 1500 line should be the line in the sand (point where it’ll change from trending high to trending low). I mean, gosh, that was a real fall up to that point. But after more time elapses, it only shows us that that’s not the case. Plus I can see now that that’s probably only a 50% retracement from the most recent swing high to the most recent swing low (end of Oct - mid of Dec). Right?
Well, I was wrong. Big time. This USD grew more legs since that nasty drop. But, did it make a higher high yet? Nope. But it did go back up to the top though. And just look at what Friday’s NFP result showed. A climb back up (the very last line going up). So. What does this tell me? In hindsight now.
That, to be correct this whole entire time, I should have been keeping this uptrend in place. And moving forward, also, that they are still in an uptrend.
Ok. That’s nice.
That’s what trend they are in. Macro speaking.
Let’s look inside their trend.
This is what I’ve been working on.
Isn’t this beautiful?
Journal, there’s so much information there it ain’t even funny.
It’s the USD from the beginning of the year (but all my data goes back to May).
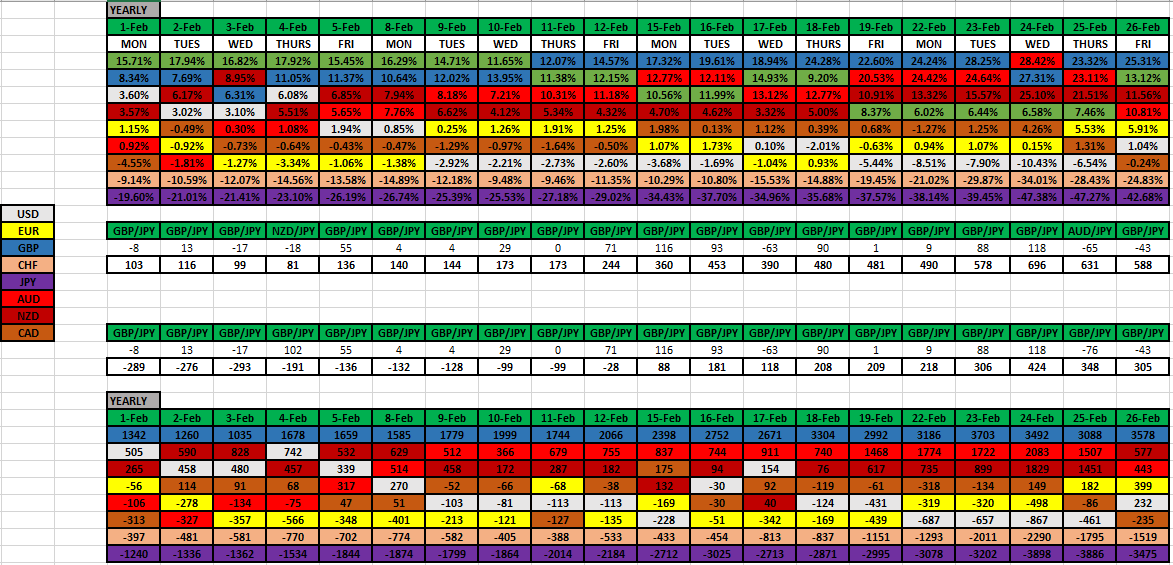
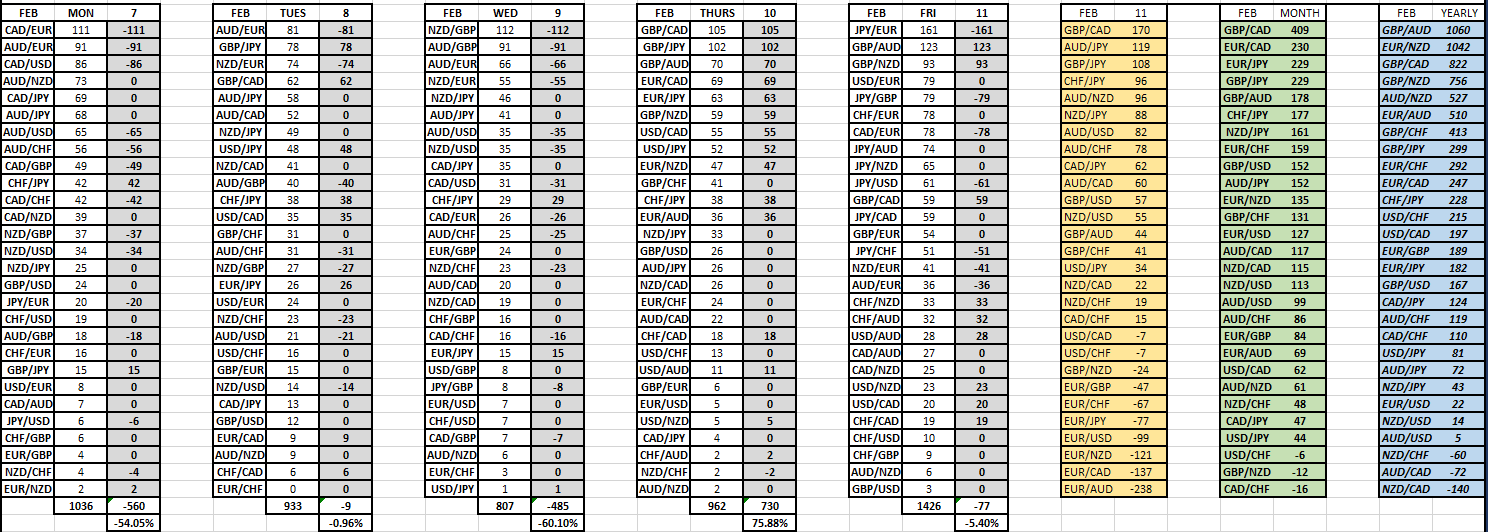
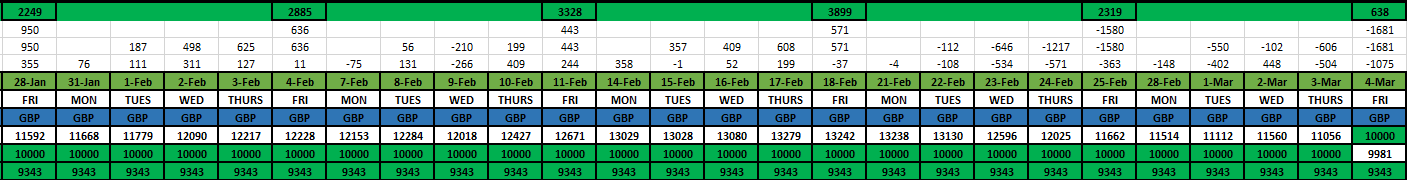
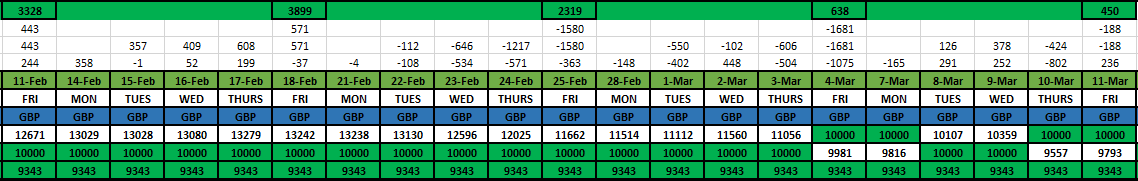
For the sake of simplicity. Top line is colored green (in a bull trend). The boxed up numbers are their weekly pip results. Aggregate.
Everything above the data is simply the daily totals. Then above that is the week cumulative added up. Then the weekly result, above that. But then above that (top) is how their trend has unraveling. Those numbers are nothing but pips (aggregate). What’s interesting?
Let’s look at this past week.
- -711 pips was their weekly result.
- Mon thru Thurs all had negative resulting days (-395, -374, -140, -128)
- NFP resulted in +326 pips (was a good report).
- The latest running result for this trend drops down to 567 pips (from 1278).
All we’re doing here is looking at another way of what the previous chart shows.
I prefer numbers, then charts.
But all of those boxed up numbers are nothing but what’s on the chart. Specifically speaking, the white boxed up number is the line. The 2 green numbers are:
— Where the trend started
— The line in the sand
And when the white boxed up number drops below the green numbers, means the latest must have dropped below where it started from and possibly dropped below the line in the sand. See there in the middle of the month? It happened. But then came back up. Basically, I prefer to see it this way than coming from the line chart.
Journal, have I ever told you that I do not like charts?
Sorry.
Won’t go there again. I promise.
Well, not for a while anyway.
Ok. So. What do we got?
We have a USD that is trending high. Simple as that. Nothing has changed yet.
Although I can see that they dropped down a good bit recently.
Ok. That’s nice. Now. If I want to check in on this trend and get a feel for their dynamics, I can go to this table.
Another thing I learned is that within a trend you have to stop and move the lines along the way. Kind of like football. You know how they have to move the chains every 10 yards? Cause when you’re moving more and more down the field the lines got to get redrawn. In this case, for a trend, it’ll be called something like legs. For the USD here, this latest leg has been ever since end of week Nov 19th. If you look on that table you can see how I distinguish the legs by making it either
italicized or not. The previous leg went from week ending Aug 13th up to end of week Nov 12th. I got my reasons for that…ok…the reason is that I want to know how close they are coming to the point from where they started this leg of the trend. Cause when they come on back to 0, then go negative, then I know very well that a change in trend can be coming soon. Just look recently at the USD. On the week ending Jan 14th they dropped in negative territory ( - 175 ) pips. Well, if you look at the line chart, that’s precisely when it dropped below that line. And that’s when (I’m sure you remember) I thought it was gonna continue on down. Nope. Bouncy bounce it goes. Back up.
Ok. Looks like I got to move on, cause I want to go through them all.
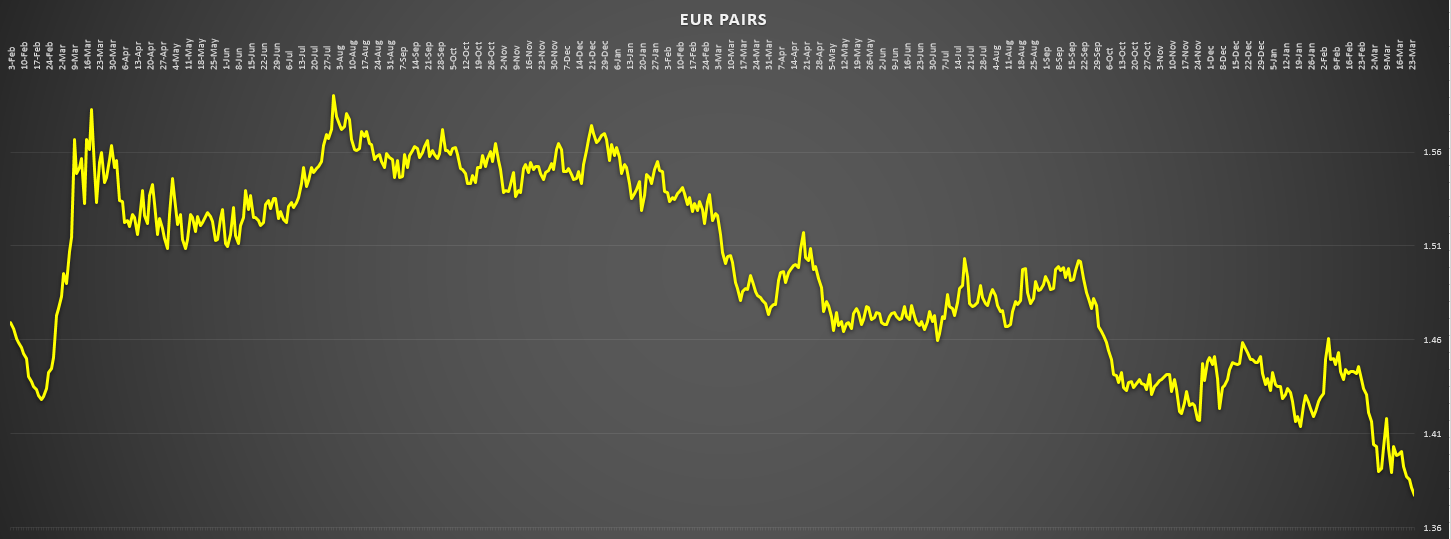
How about the EUR.
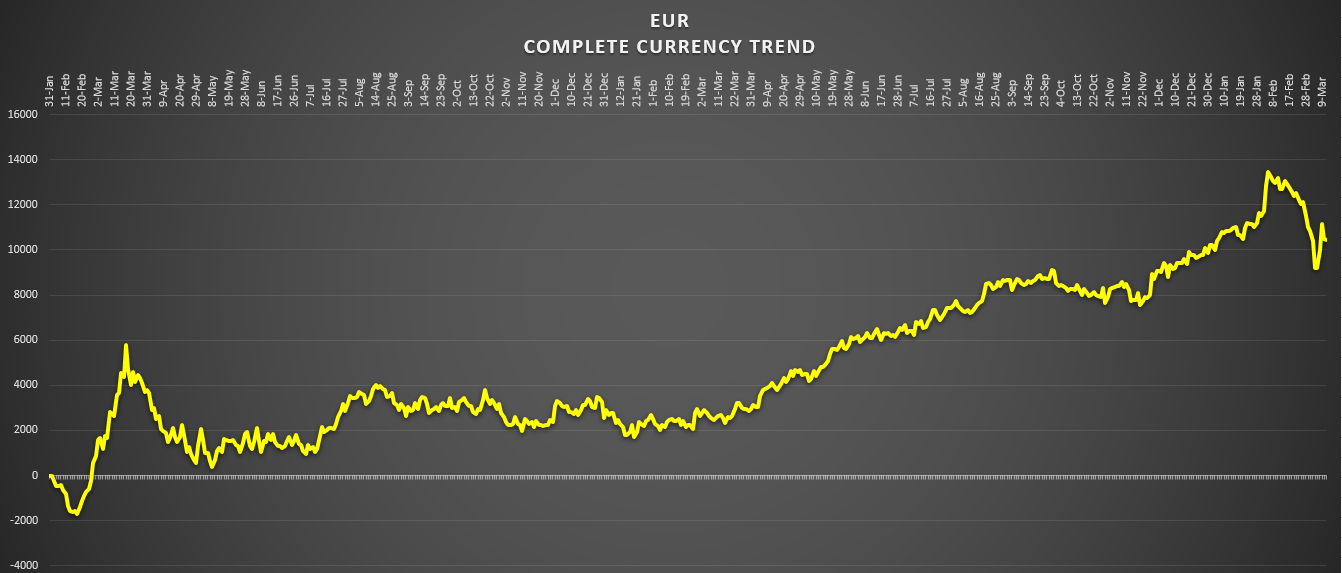
Ok. Well, remember when I said that I learn from hindsight? This is another example. You might remember when I thought that they went through a little down trend Oct through Nov. I spent a lot of time thinking about this, Journal. It’s not true.
Hindsight has shown me that they’ve been on an uptrend this entire time. There’s no way I’m gonna call this a downtrend. All things considered, no way. It didn’t even retrace anything measurable. Only when I look back on it do I see that this was still on an uptrend. Especially in the context of where it came from. The EUR is a buy. It has been a buy for quite a long time now.
It never ceases to amaze me how I’m not hearing this in any kind of analysis out there. All I’m doing is adding up all their parts. In the context of swing trading, I just cannot see any trades that should have been going south. No way.
Well, maybe against the GBP. But that’s another point to be made. This is only one currency we’re looking at. We trade 2 of them, at the same time, go figure.
That reminds me. This past week was a doozy for the EUR. Yeah sure, the line chart shows it there, but not like my other table.
They busted out of the gate with 443 pips this week. Then turn around Tues gave some back, -129 aggregate pips of a daily result. Wed came in with a positive 215 pips. Then with their interest rate decision day they killed it with + 1112 pips! That’s truly a remarkable number. I haven’t seen this result from the EUR in a long time.
Not only that, but Fri came in very strong also (+621 pips). That gave them a weekly total of 2,262 pips. I don’t know if that has ever happened before! Look. All I know is that the EUR has a monster week. And yet they didn’t even raise interest rates. How does that happen? Well, don’t ask New Zealand. They raised rates higher than anyone and yet go down more than everyone. It doesn’t make sense at all to me.
Anyway. I got the EUR on a leg ever since the beginning of the year. That’s when this latest leg began. In fact, you can see up there on the 7th that their total trend was started (+604). It only went up from there. Very impressive. I’m just wondering if anyone else knows this. Am I the only one? Surely not from the FX analysts. Cause I’m not hearing it from them.
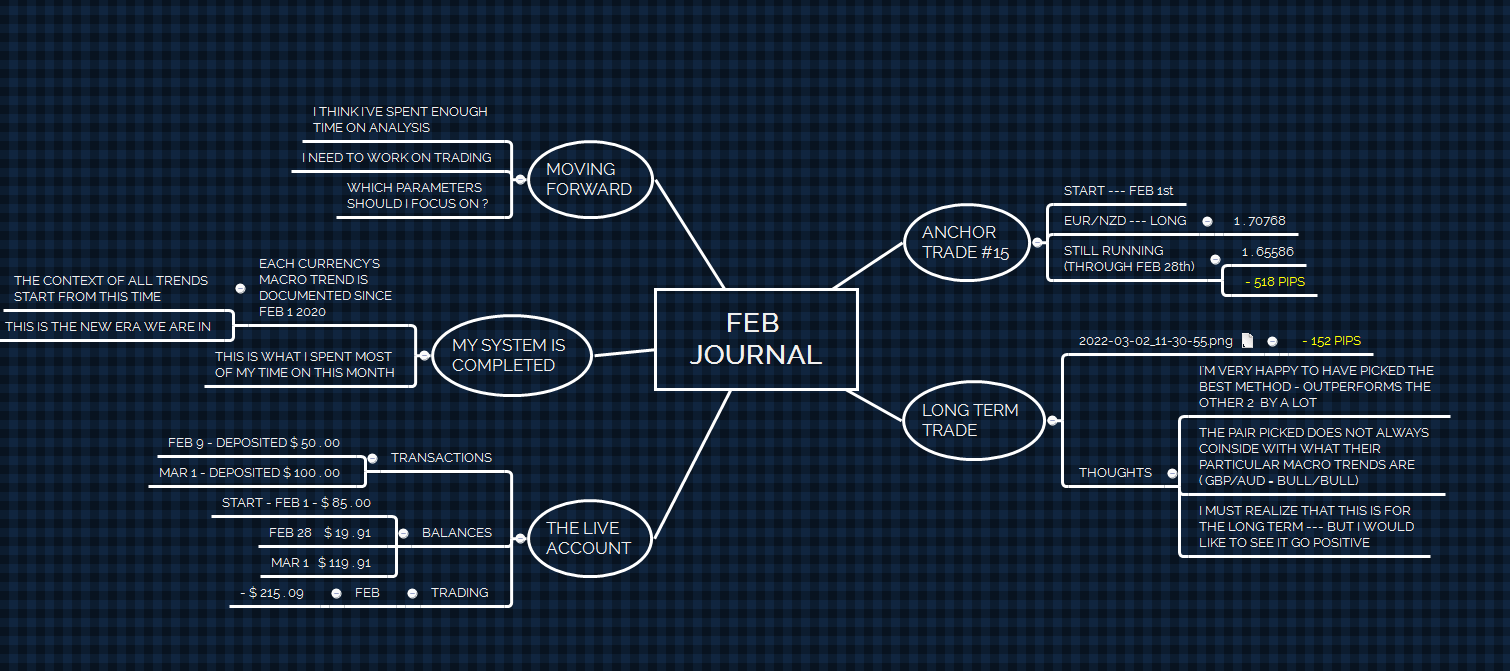
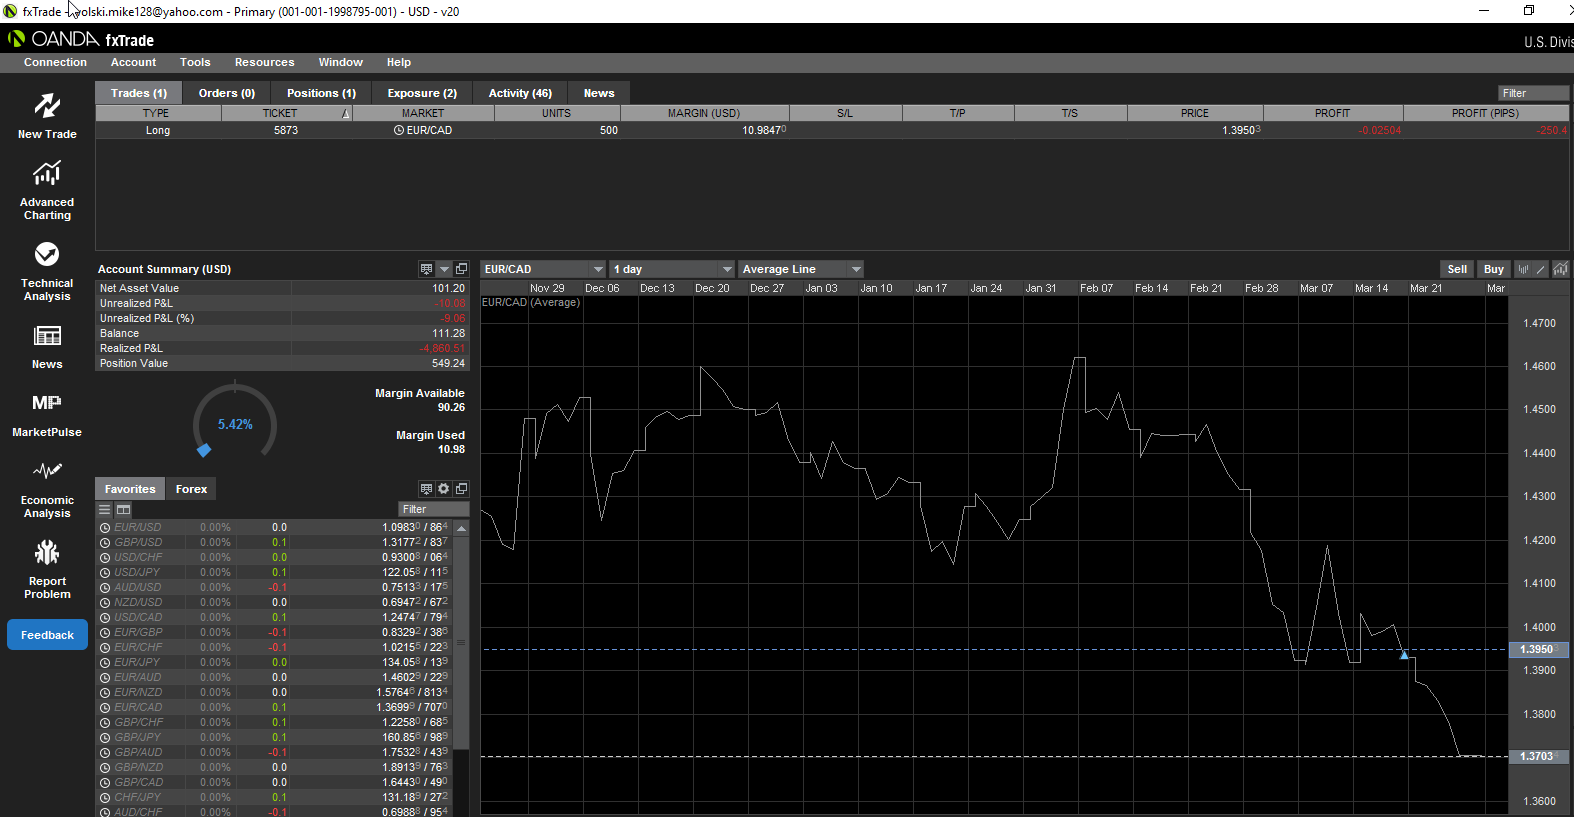
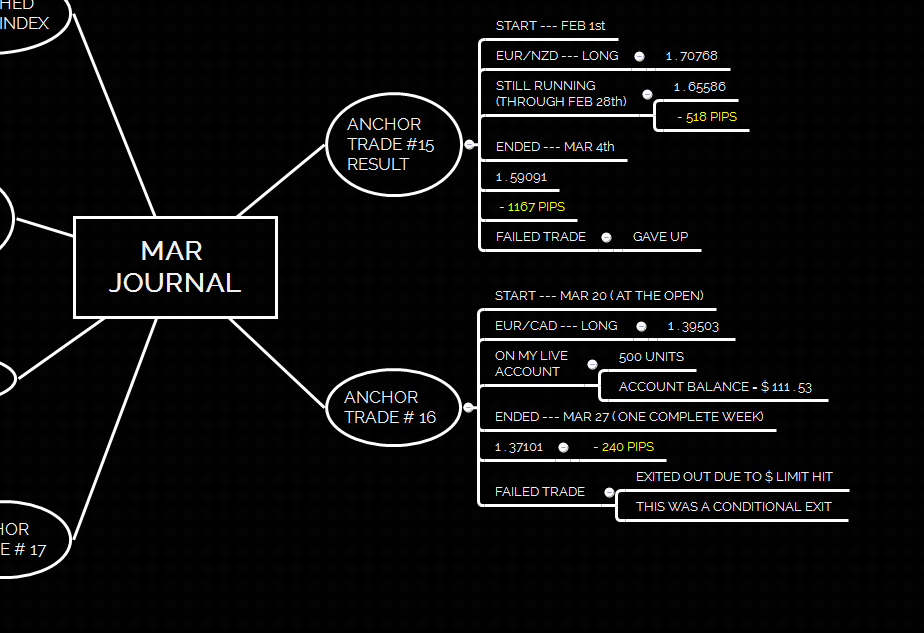
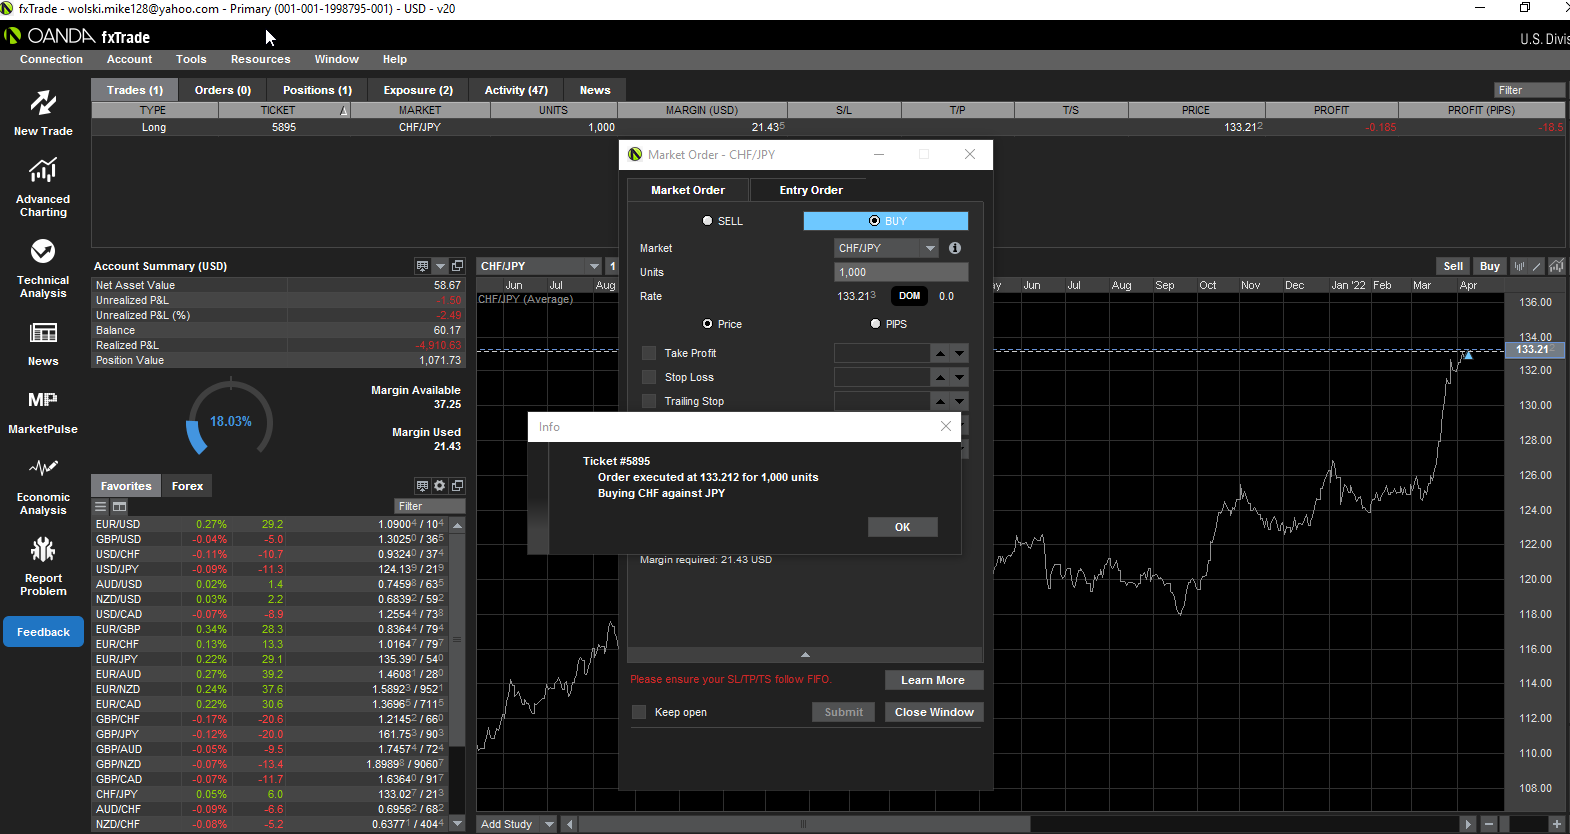
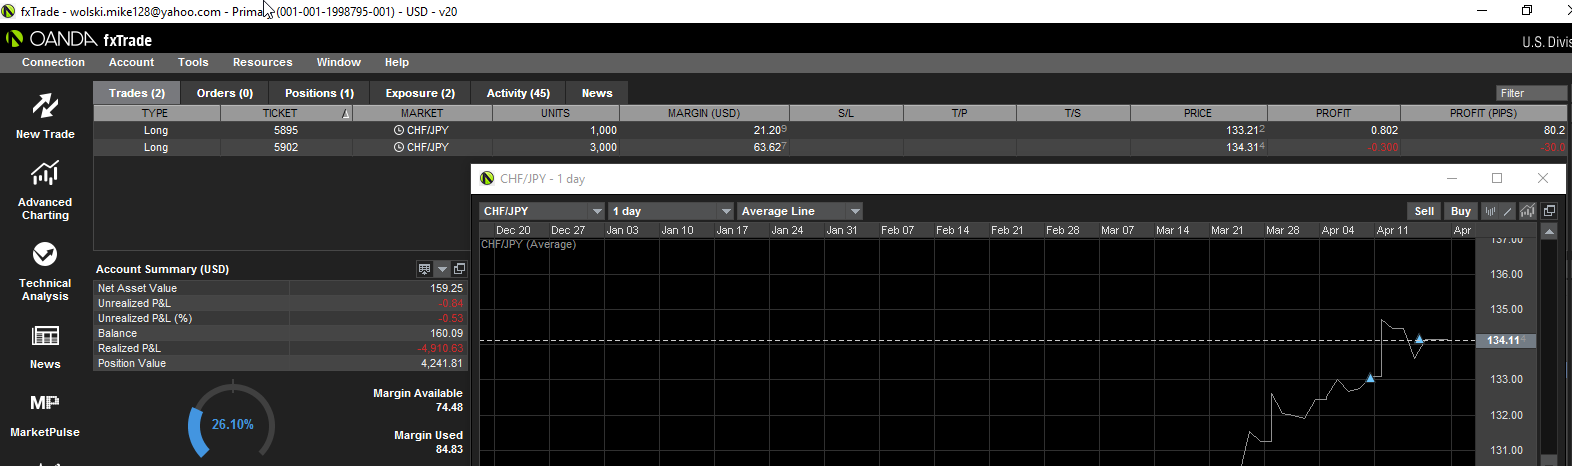
Well, I finally smartened up. I placed a EUR trade (at weeks start). It’s my longterm trade. And, if you haven’t guessed by now, it was a good week for it. I’ll talk about this a little later.
But, we do have other currencies to talk about.
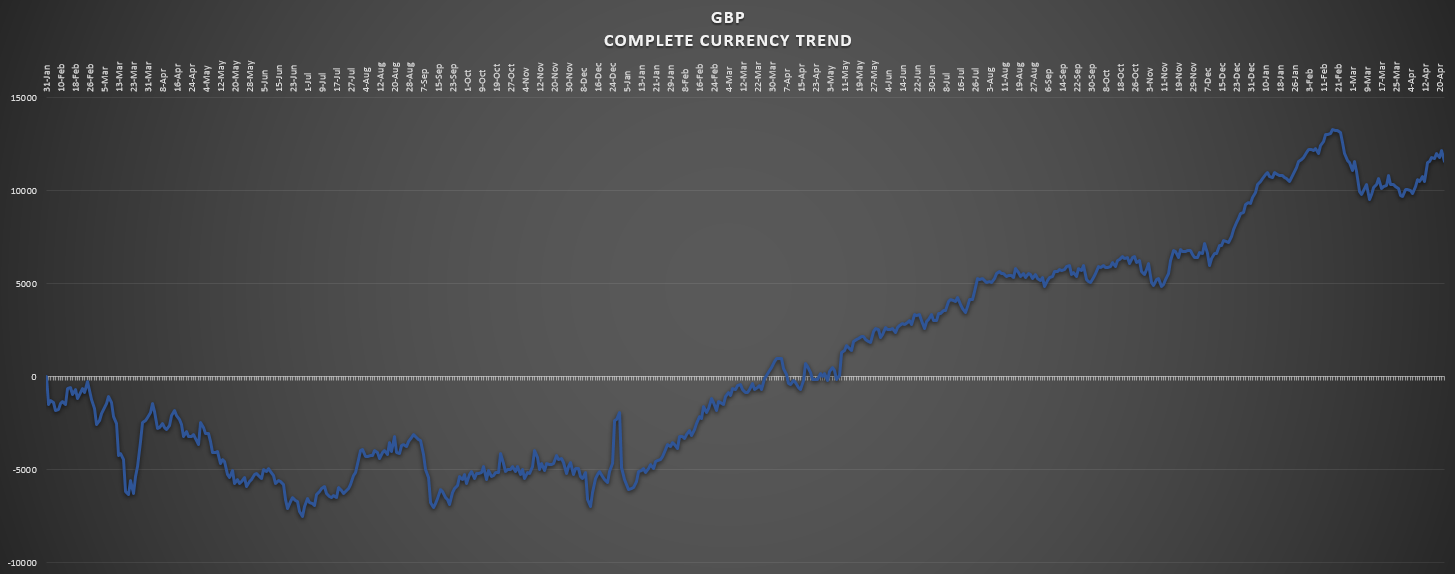
The GBP.
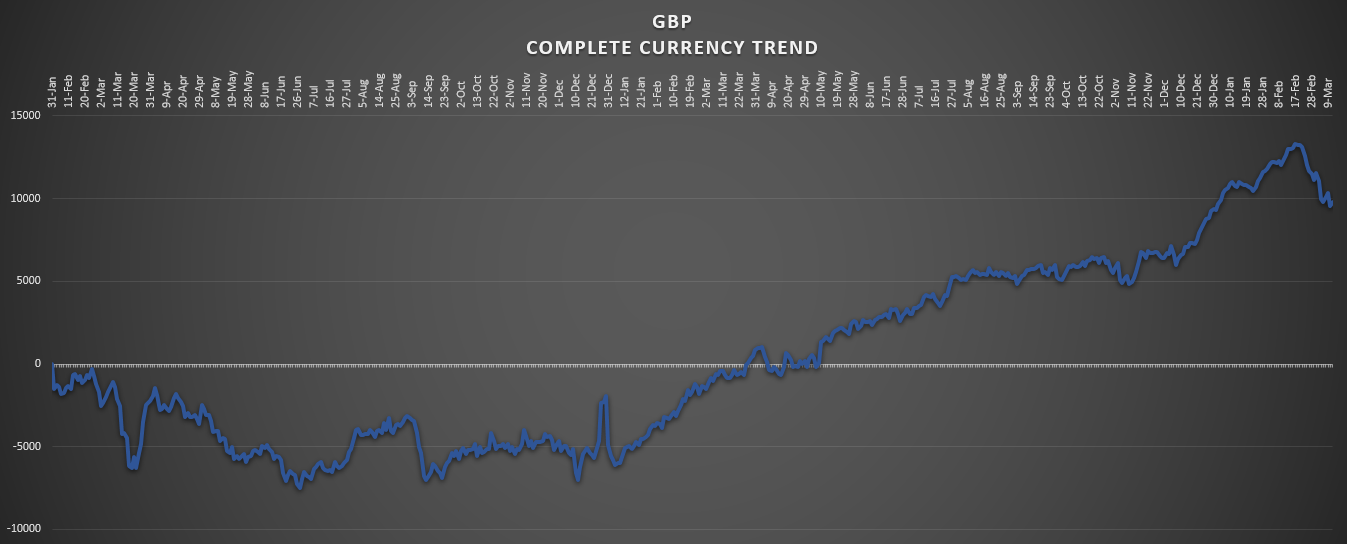
Uptrend. Just like the EUR. One very long trend.
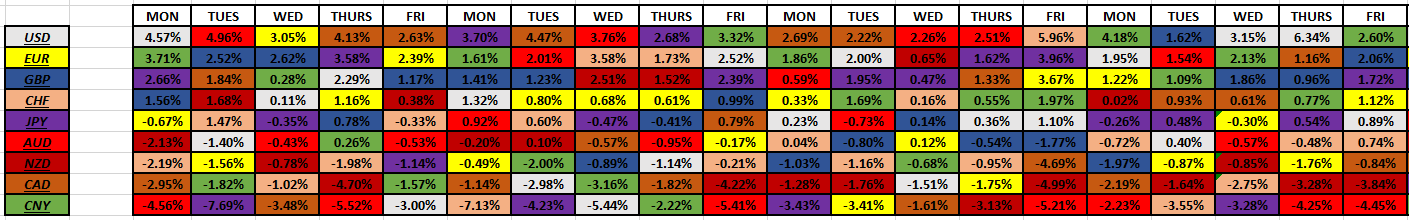
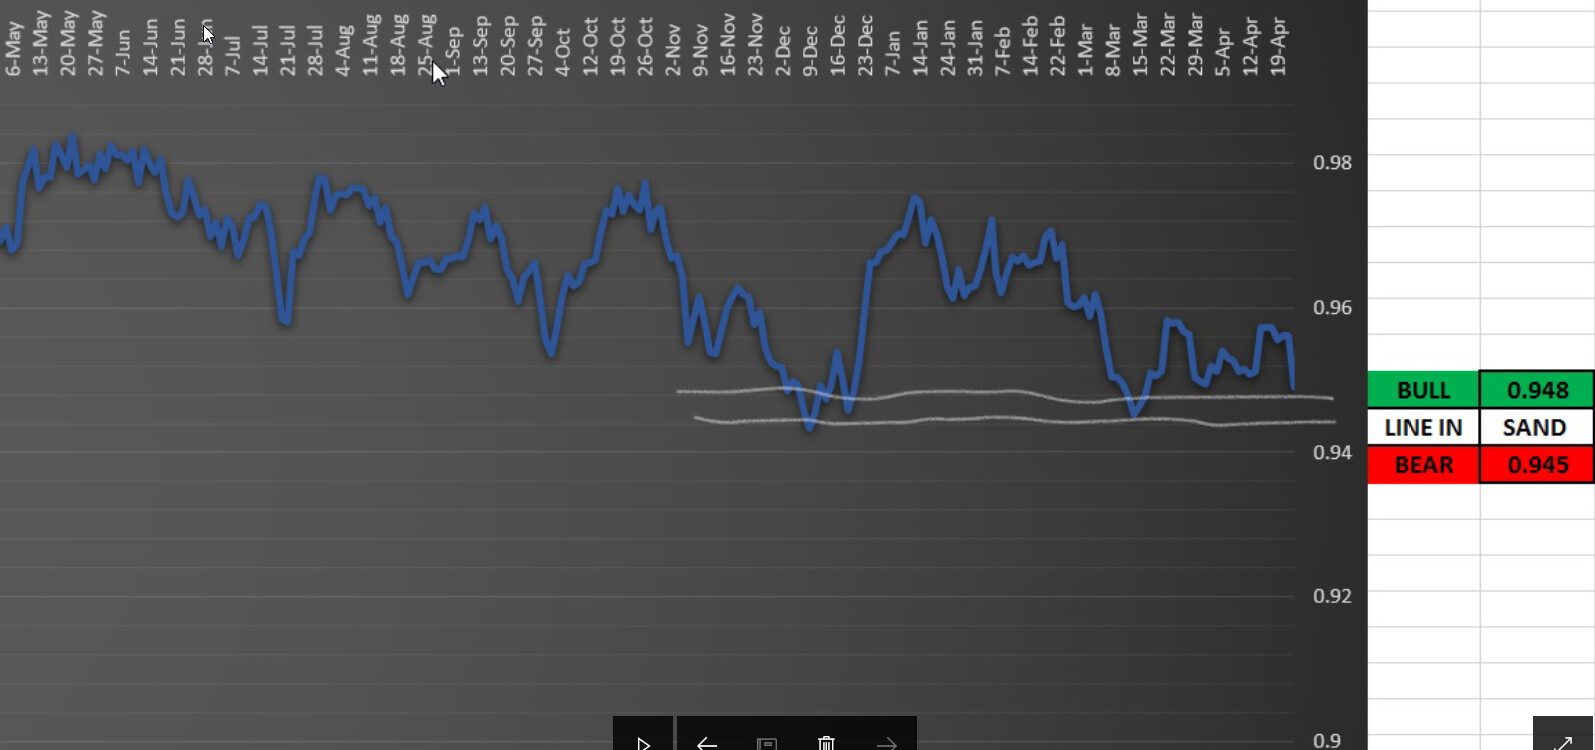
And I just seen on Trading Economics that they had their interest rate meeting on Thurs also. Even raised their rates! Now up to .50%. But they surely didn’t have the reaction the EUR had. Look.
What’s that? Looks like a normal, run-of-the-mill, week to me. Nothing special. Sure, they ended the week positive with +636 pips. Was less than last week (+950).
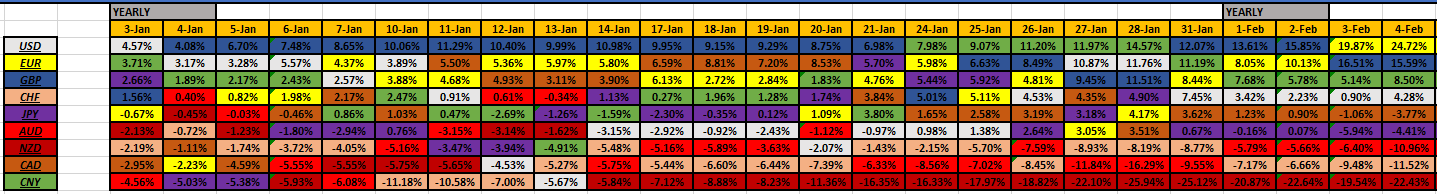
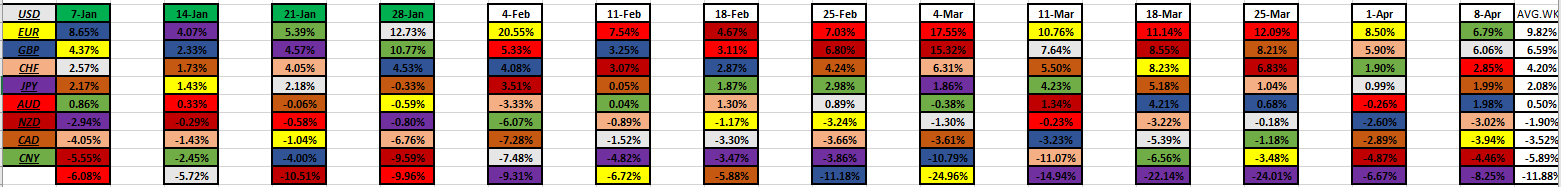
Well, looks like I have to change my numbers on my one table.


In black we have Jan and then Feb now.
So. Who has the highest key interest rate? Not counting the CNY.
The NZD. And then now the GBP. And then comes the USD & CAD.
I guess these rates don’t mean much anymore nowadays. It used to.
But it should get interesting now, I think. Cause when rates are going up, money will be getting a little more expensive. For some things it’s good (savings). But some things it’s bad (debt).
Alright. I don’t have time for the fundamental discussion now. Although I would love to get into some deep discussion on this stuff. But I guess that would be on another post. Somewhere.
Anyway.
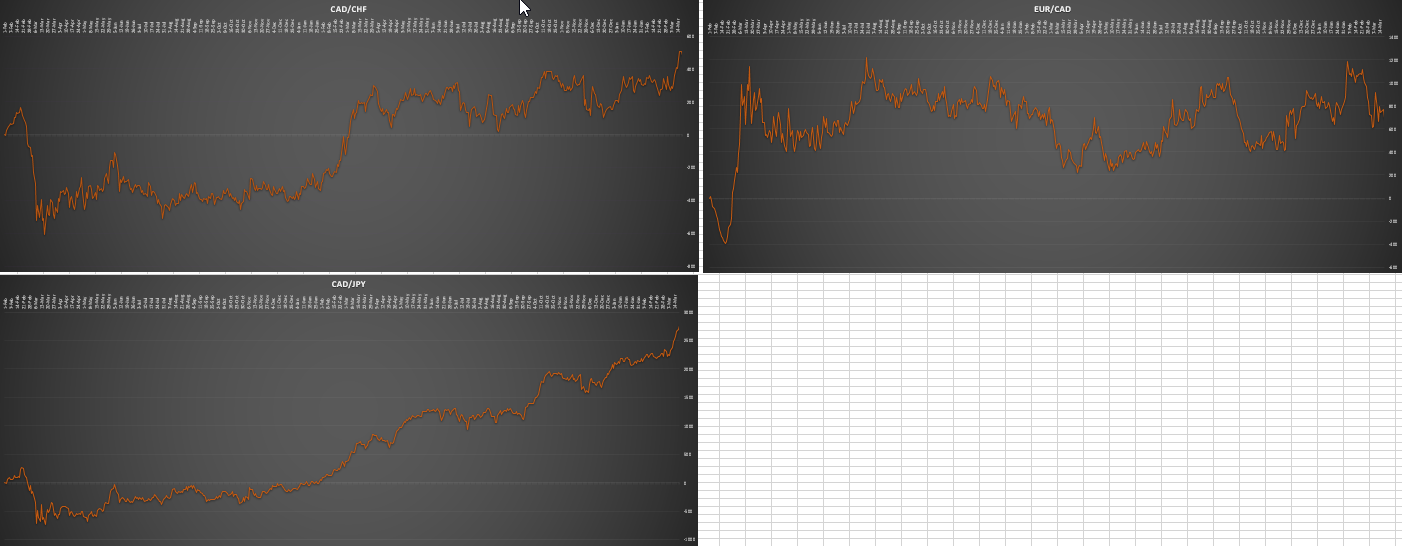
How about some CHF. What’s their condition look like?
Boy I remember how much I struggled with this one. This is tough. Cause all along the way (in real time that is) last year, I called for a few trending low’s. You can see the dips along the way, around the middle of the year. But, again, I have decided that it’s only in hindsight, and in this case, after the entire year has come and gone, that I see now that the CHF has been in a really long and choppy uptrend. This is truth.
That’s what I want. Regardless of how long it takes (and in this case a really long time) I want to know what was (is) the truth. See. This is how I learn. This is how I am learning. This way, moving forward, maybe I can see the potential of what can happen. But here we have a real fight on our hands. It’s a fight for the upward moving trend. That’s really what’s going on here.
But do you see in the beginning of last year? That massive downtrend? Well, it bottomed on out. And ever since then, the truth of the matter is, it’s been on an uptrend. Albeit not so pretty. This is another lesson I’m trying to remember. That with every currency there belongs a particular dynamic, that belongs to them only. I do believe every currency has their own characteristics. There was a time that I wanted to do a huge study and note down what each currency’s particular characteristics are. Like, how they behave. What to watch out for. What their known to do and not to do. Things like that. And then to make these notes available so that I would know better how to trade them. See? That’s the whole purpose of doing what I do. When it comes down to trading them, you got to see the differences between them. Actually, it’ll come down the individual pairs that might do different things, than one another.
But…I’ll always believe…that the macro analysis is most important. After that comes the micro (specific pairs). And for now, we’re keeping with the macro. It’s how a complete currency behaves.
So, for the CHF here, forget it. Their impossible. What do I know for sure?
They are on an uptrend.
They might be coming down and trying to change that.
But until their macro numbers come down under that most recent swing low will I think about changing their trend.
You should be able to see that the line in the sand is -1150. In the line chart, that’ll be the most recent swing low point. But look. That’s the first signal that I’ll start considering them on a changing trend. I’m learning. I need time to play out. Not only do I need that to happen, the next thing that will need to happen will be another move lower, like below -1500 line. Why? Cause that’s the swing low before that one. Right? Just need some lower lows. Although it does look like we’re getting there.
We just need more time. In the meantime, what’s factual is that they’ve been moving higher and higher over time. It’s true. That’s what I got to stick with at the present time. I think it’s the correct bias to have with them. It’s truth. And not subjective either. You’d be crazy Journal if you think I’m gonna trade them short.
This is how I need to think.
Moving on.
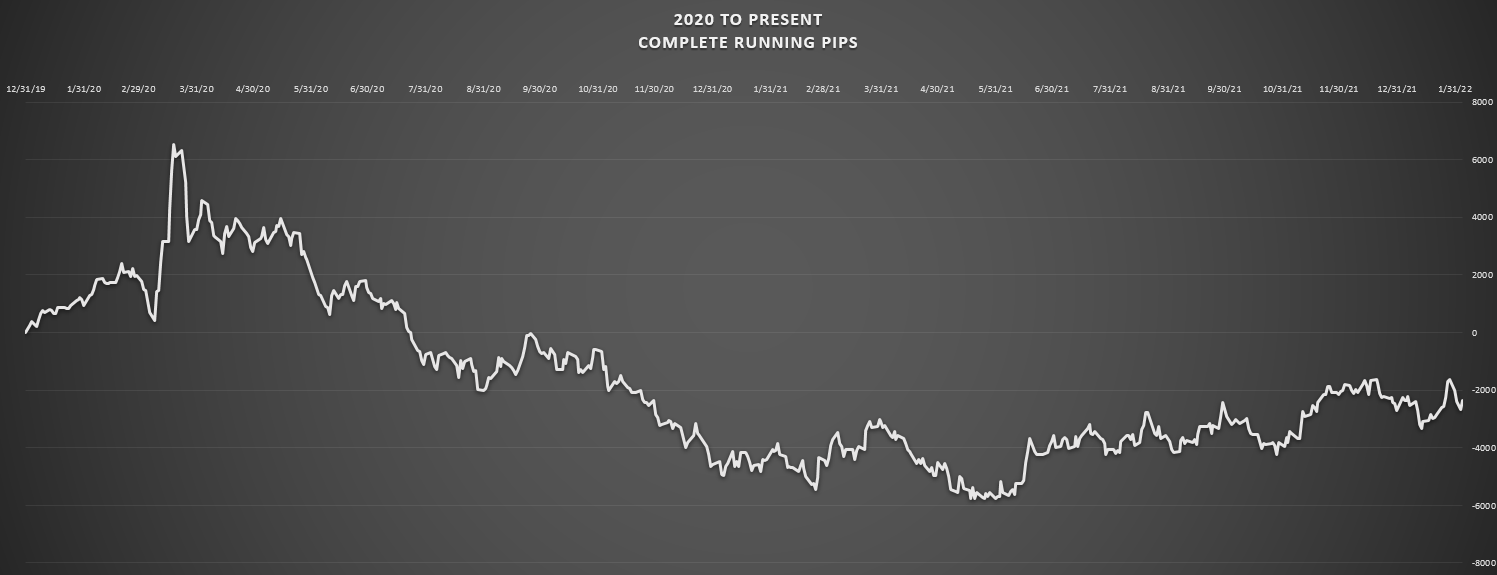
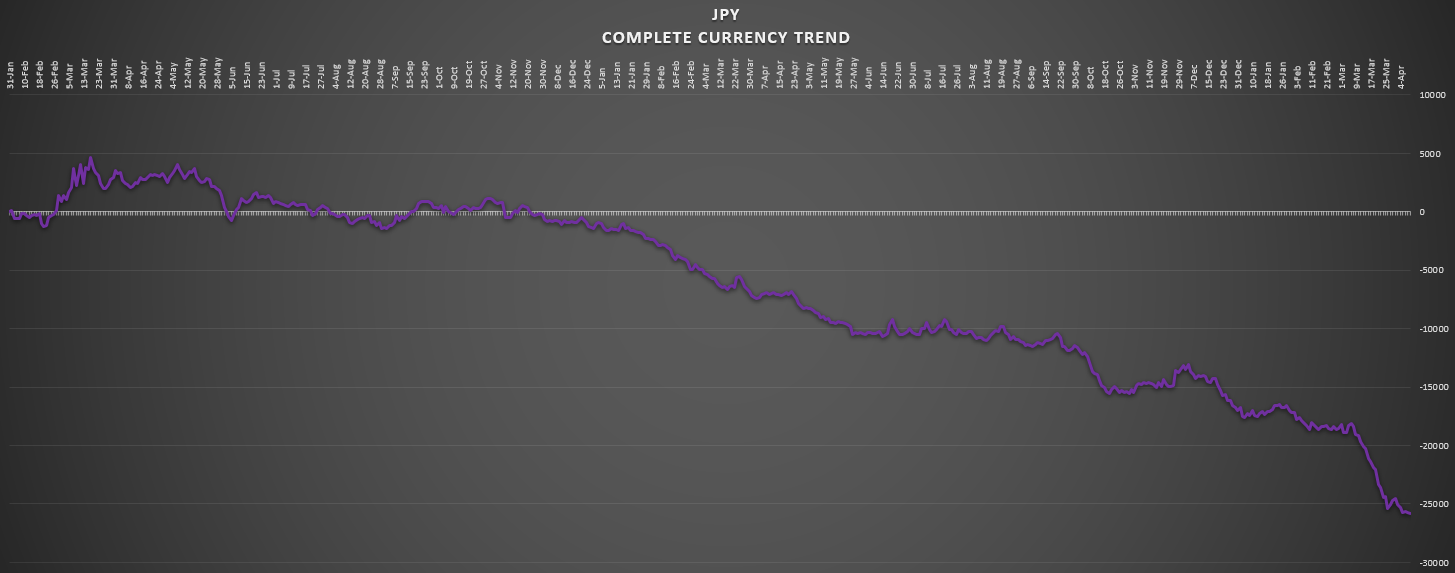
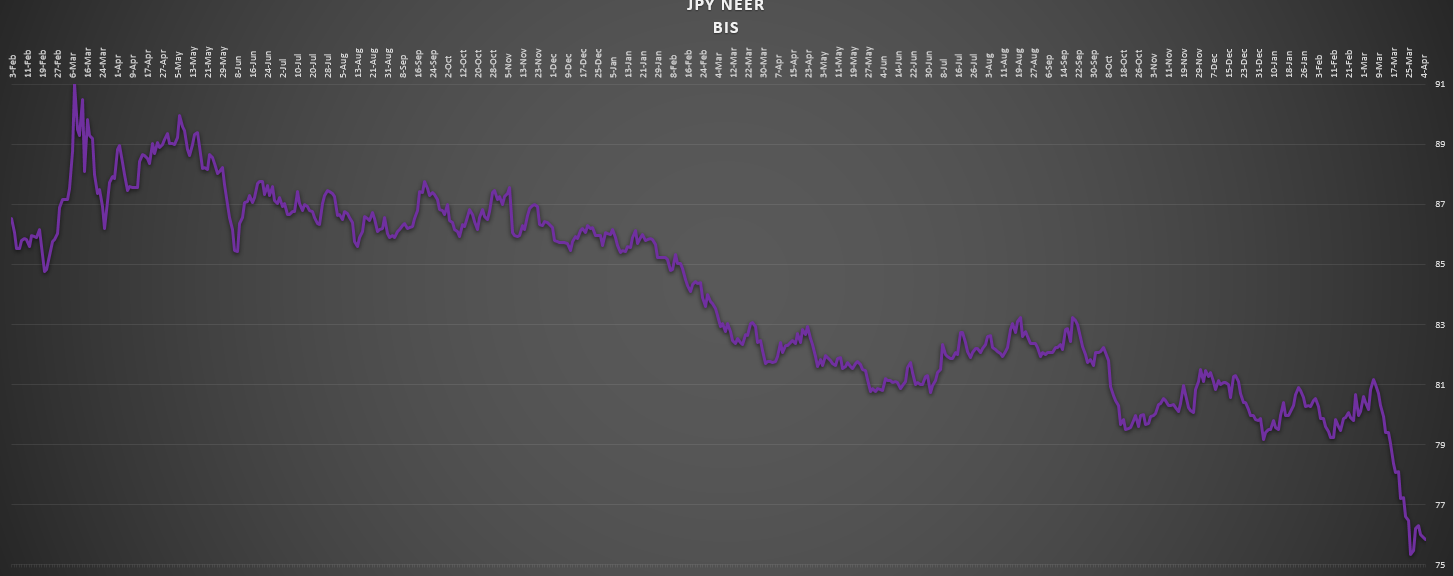
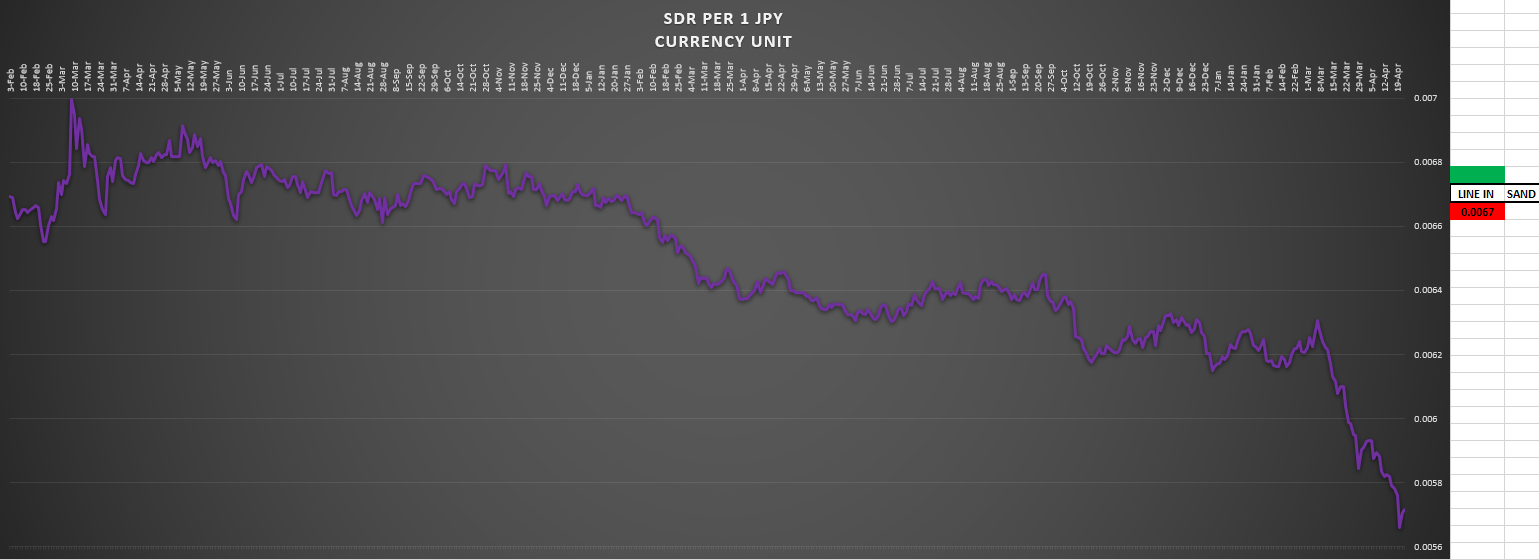
The JPY.
No surprise here. Downtrend it is. But you should be able to see when I redrawn the lines. Last year during June and July when it traded sideways. Sure. The trend takes a break. Right? Spikes higher. Not dropping lower anymore. Things like that. And at the end of that period is when I want to start monitoring whatever will come. Like…I’m not gonna care how many pips of a trend that all took place back at the beginning of the year. It happened. It leveled. And now we’re gonna go on another leg. See? That’s what I call a leg. I think I used that -10000 line at the line in the sand then. So therefore, I’ll want to know how many pips strong the next leg goes to. But then it happens again. Another time where it stops dropping. You can call it consolidating. Or ranging. Whatever. All I know is that it should be a time where you start counting again. Right? And well, it happens again! The most recent time here.
But this time it’s the beginning of the year. A bit of sideways moving. So therefore, I think this is a good time to begin again. We’ll start the year out fresh, like I did with the EUR and the GBP.
So. Let’s look at the year for them so far. Weekly numbers only. Top line.
First week = +368 pips trend positive. Which means the Yen is going the way of their trend. Positive means JPY going lower. Right? I look at all these numbers from the perspective of their trend. Cause that’s all I care about. Whether they trended or not. So then week # 2 goes counter trending. So basically, they just about retraced all of their trend from the week before. In real terms, they got strong the second week. That’s counter trending. Ok. So. We’re all back to square one.
The third week goes which way? Well, the actual weekly result is +497 pips. Which then gets translated into the opposite (-497). Cause their trending low. So that’ll mean a weekly result of -497 pips against their trend. Counter trending. See? When I look at these numbers I want to see whether they went with or against their trend. A negative number is against it’s trend. So then their sitting on a -479 run so far on their trend to date. Meaning their running strong. A bullish JPY. But that’s counter trending. Right? Then their 4th week comes. And goes. They end a tad positive trending (+32 pips). Not all that much. Making their running trend tally at a -447 pips of a total. So their running bullish since the beginning of the year. Or since their newest leg of a trend.
So then we have last week. It’s the turn of the month week. Always the most interesting time of the month. Things like to happen here. Between profit taking. Or whatever. Things always seem to adjust somehow. Well, what happened?
Went back to their trending ways. Wow! 1046 pips trend positive. Well, that settled things. Who was thinking that they might change their trend anyway?
Ok. Maybe I was. Sorry Journal.
I guess I got a whole lot more learning to do.
But man…1046 is a lot. The first 4 days went pretty heavy with their trend. Look. Going into Friday they were sitting at 1208 pips trend positive. That’s what they know. JPY negative. Then Fri goes counter trending by 162 pips to bring the total down a little. So. This tells and shows me that their trend is still intact. By a lot. See. The market made us all remember what’s really going on. Up to this point they are still trending low. Simple as that. But I can see this really quickly Journal. All I have to look at their is what their latest trend number is. What is it? It’s + 599 pips. That means their 599 pips deep into their established trend, which is negative. Low. On their most recent leg. Remember that I’m going with what’s going on since the year started.
Man.
Who thought they were gonna turn strong?
Better think again.
I know.
Sorry.
How about some AUD.
This was another currency I experienced some deep learning from.
Or I guess I should say how they behave. Man… all of these trends behave differently. Well, with these guys we can have some real boost, but that doesn’t necessarily mean their trend has changed. Cause the fact of the matter is, since the end of Feb of last year they’ve been on a very long and deep low trend. Even though from Sep 21st up to Nov 1st it looked like their trend was gonna change. Especially after a good start a couple weeks prior. Higher swing high (off the bottom floor) followed by a higher swing low, followed by a very high swing high. All that right there was nothing but a fake out. Look where they go after that. Even made a lower low for the year.
In real terms, the consensus is that this is a sell. Don’t forget it. That’s precisely what the market was telling us this whole time. But boy, I remember thinking differently. I even told you Journal that this last quarter of the year (4th quarter) could be theirs. But man did that change. If this ain’t learning, then I don’t know what is. Man… you got to be a sceptic and remember what the bigger picture is telling you. Right Journal?
How about more recently. What are they up to?
Well, I redrew the lines at the second week into the new year.
Why?
Well, I wanted to find the best place when I seen them coming back down after that most recent swing high. That (swing high) occurred at the end of Dec. So then the new year starts and confirms that it’s coming down. Those are my reasons Journal. But if it goes back up to that point, well then, the pip count should go back to 0, and tell me it retraced 100% of the trend. Pretty close anyway. But what do we have at the present time now?
+830 pips deep into their low trend. Who in their right mind would trade the AUD long? Surely won’t be me. I mean, in my mind, to see a change in trend would take monster upon monster of moves. Like, above that -1000 line which is only 3k pips away. That won’t happen any time soon.
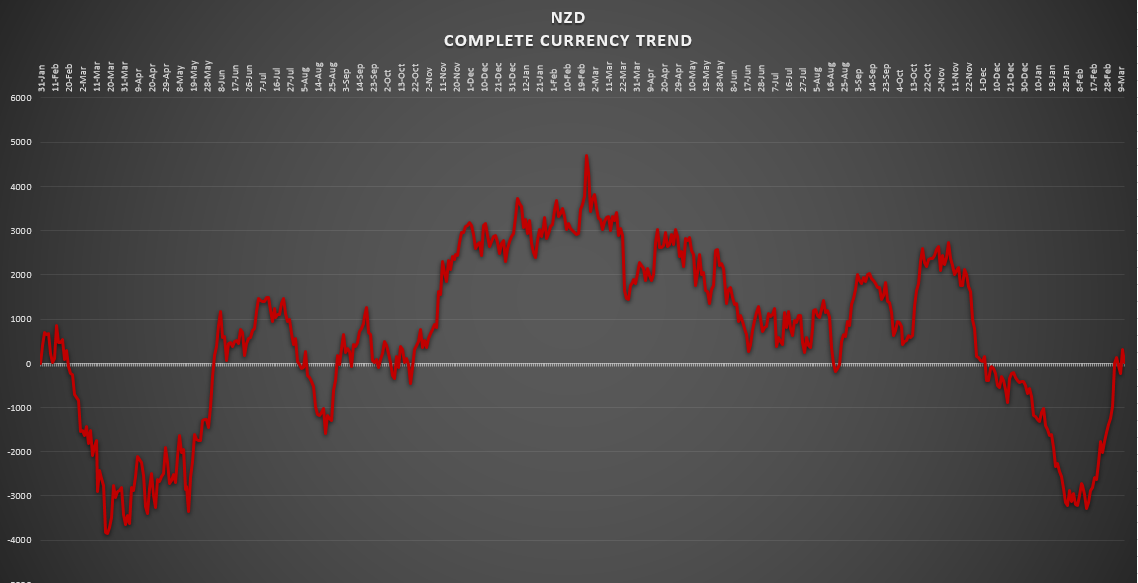
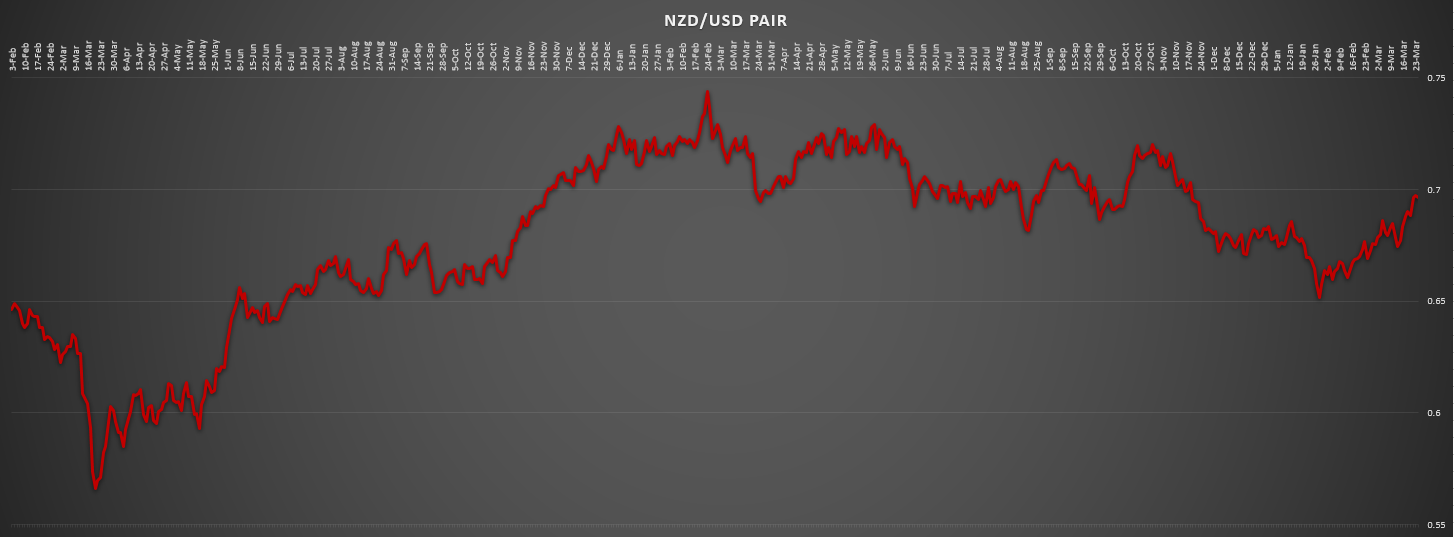
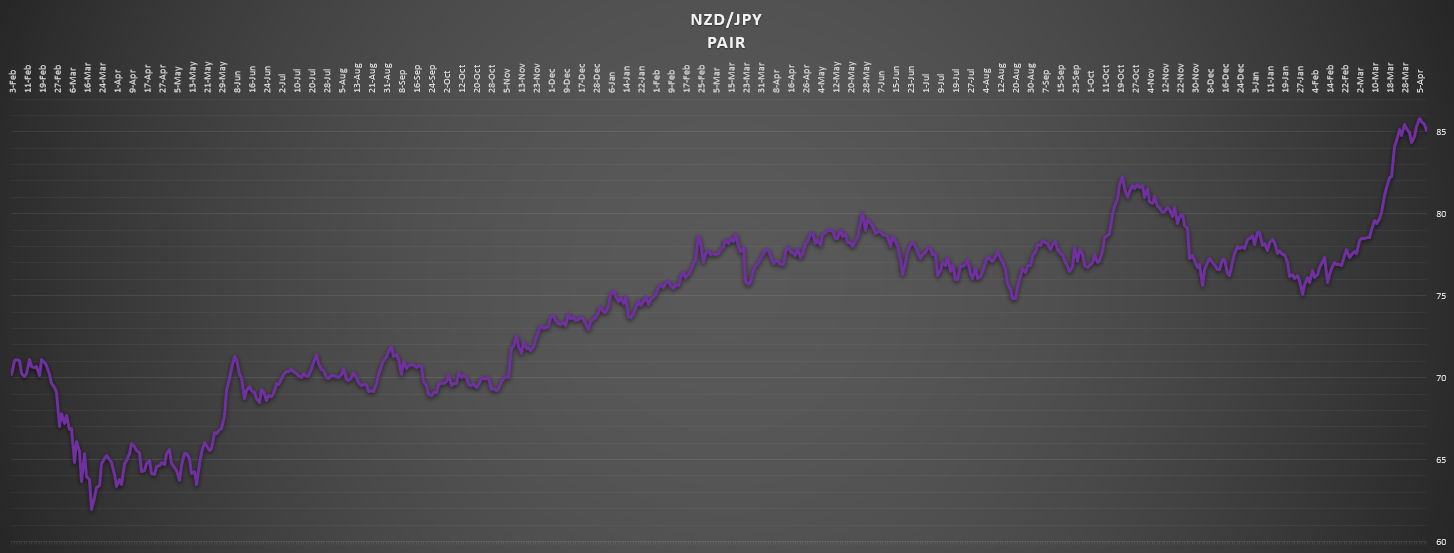
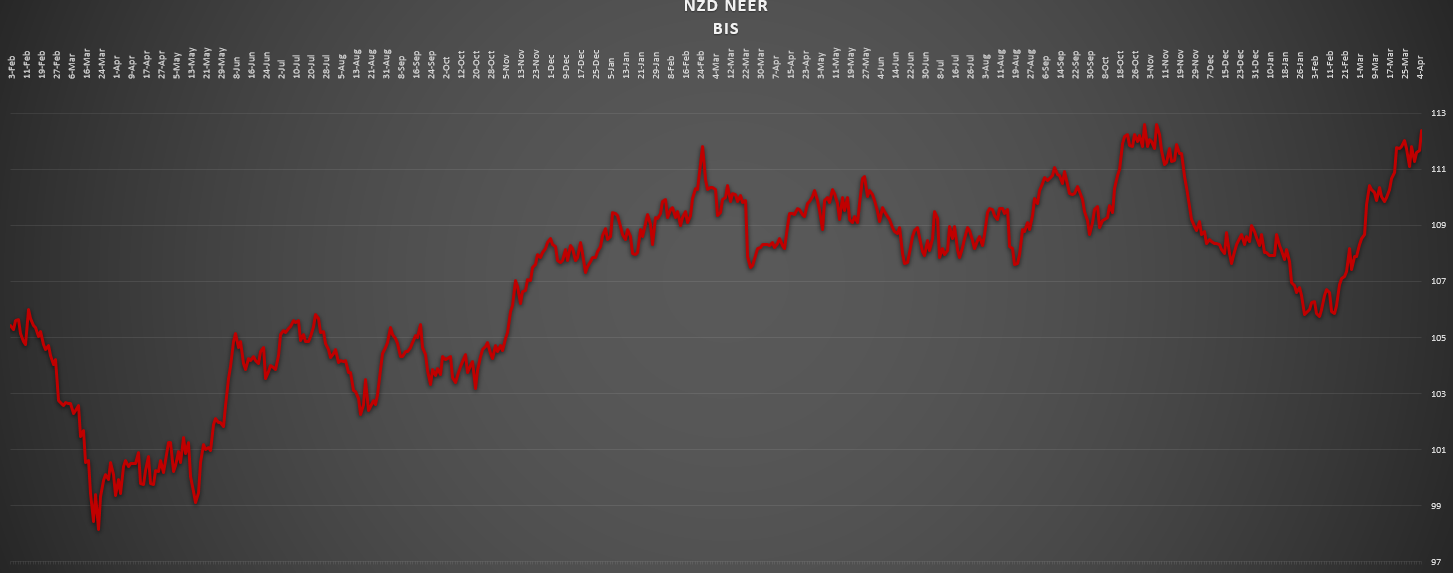
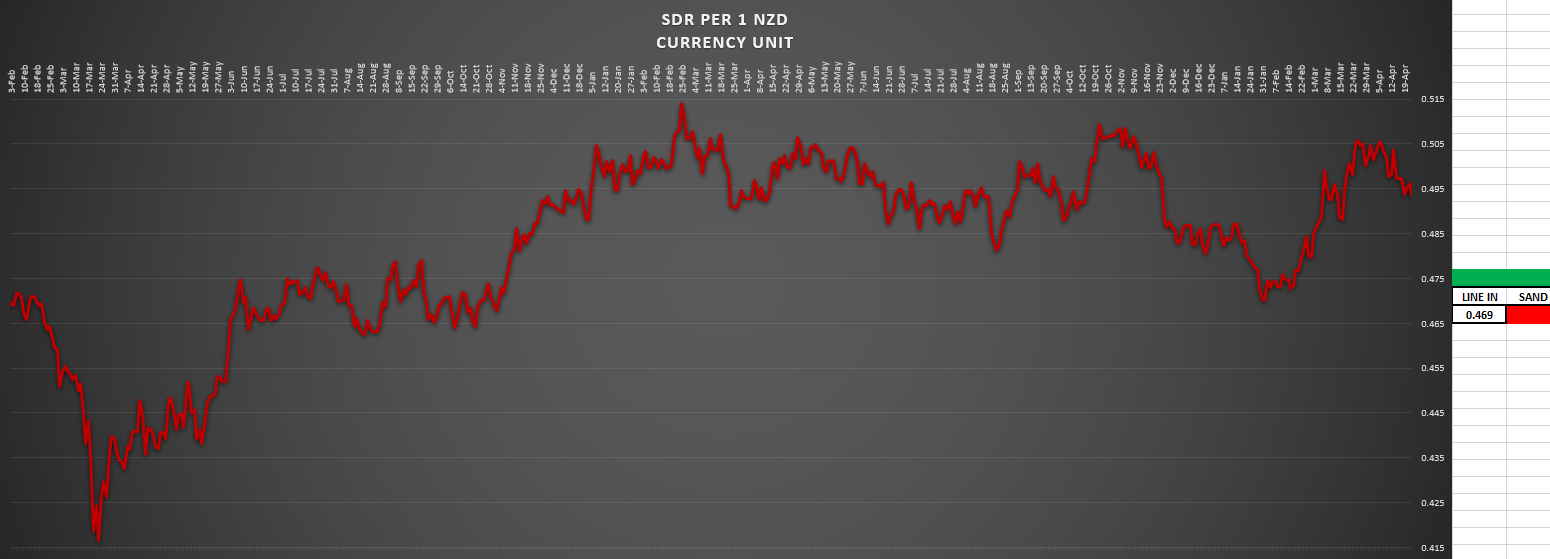
Well, is the NZD in the same boat?
Well yeah. I had to go back and rethink all of this. I mean, come on…The truth of the matter is, there’s no bull trend here. Honestly. Those 2 moves higher, even though they both went up for higher swing highs, cannot be cause for a change in trend. See Journal? It’s only after the fact, and in this case very much so, that we see what the real truth is.
Another bit of truth, through all of this, is finding out that these trends can be very long lasting. Much more than I have always thought. Look. I know this is all subjective. And I guess it depends on how far you want to zoom out on a chart. Ok then. I’ll do that. I will only go back as far as when this new era started. I told you about what I think about this. The new day starts at this time.
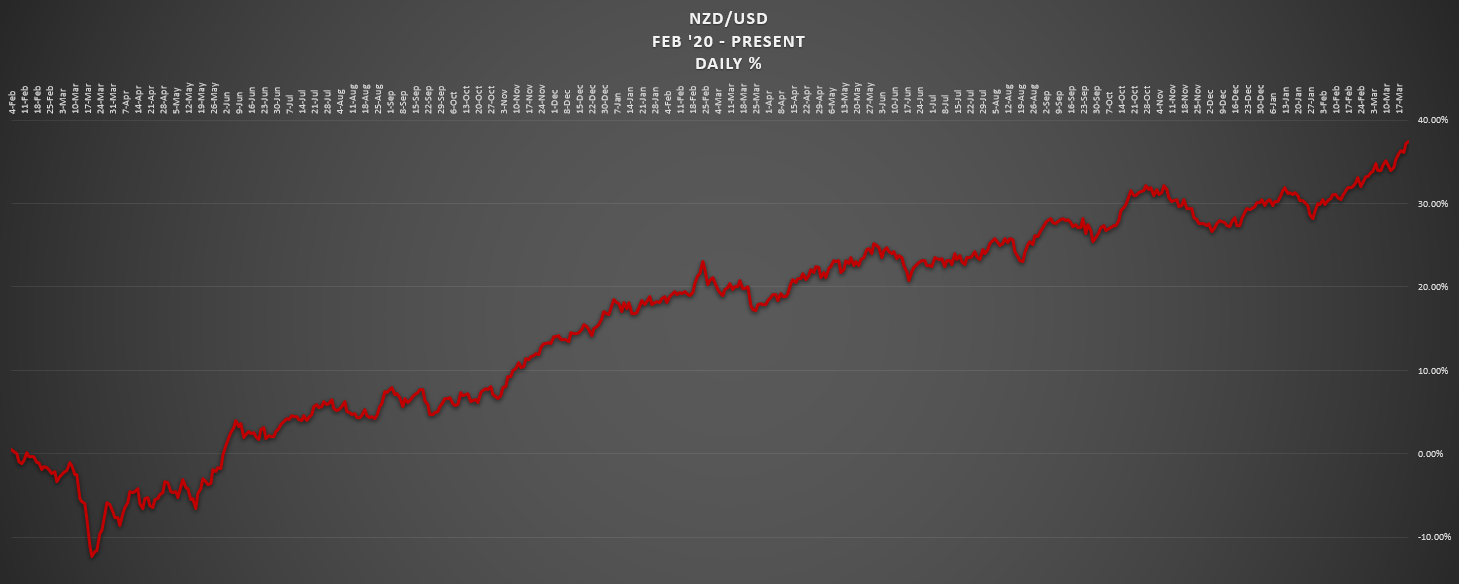
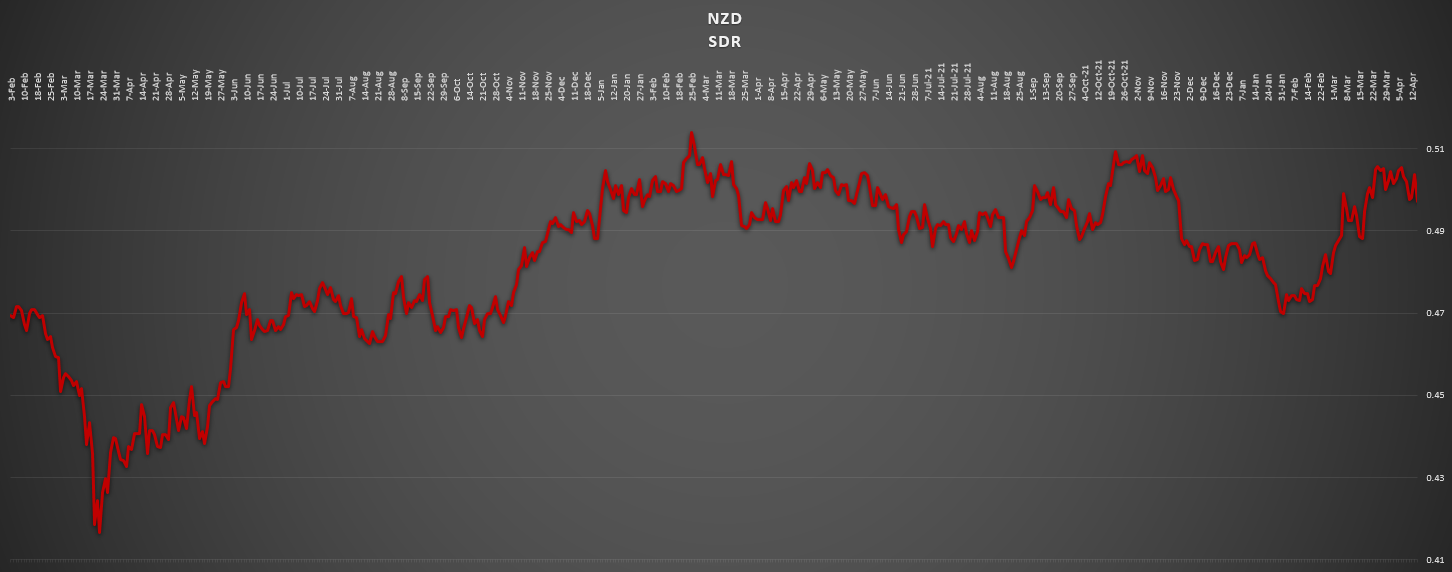
Since we’re with the NZD, let’s start with them.
Well, this is nothing but truth. We had the bomb go off. The start of a new era. Back at the beginning of 2020. See it Journal? Well, it went straight down and formed a bottom for the NZD. It came back. It retraced about 3/4th’s of the way up. Then eventually found it’s way up to the top. And that top is precisely the 24th of Feb 2021. All of that tells me that it was on a bull trend during that whole entire time. That’s truth. There is no other truth. The bias was for long that entire time. Even when it dipped. Those would be considered retracements on the bull run, that’s all.
And now we have a top. It’s all downhill from there. The only places where I got derailed was when it made higher highs. Those 2 occurrences. I mean, the first one was taking place after a long period of consolidation. Now that only makes sense to me. The sellers were slowly but surely giving up control. It takes that kind of time. And then we get the old shooting down one more time and up it goes. That’s such the typical move the market always likes to do. So it goes higher and makes a higher high. Then retraces around 3 quarters the way down and proceeds back up to another high. Sure does look like a change in trend to me. Right Journal?
Well, when it was actually happening, it felt like it. But now, in hindsight, I know the truth. That’s not the truth. The truth is that it was still on its longterm downtrend. Am I wrong? No way. This is what I’m talking about. It’s what I am learning from hindsight. Time is such the factor. Huh?
Well, real quickly. Can I be proven wrong with these other currencies, by zooming out this far and seeing something different? Let’s do this quickly.
The AUD.
Nope. I see nothing different of an analysis with these guys. It’s on the down ever since that top (which btw is the same with the NZD).
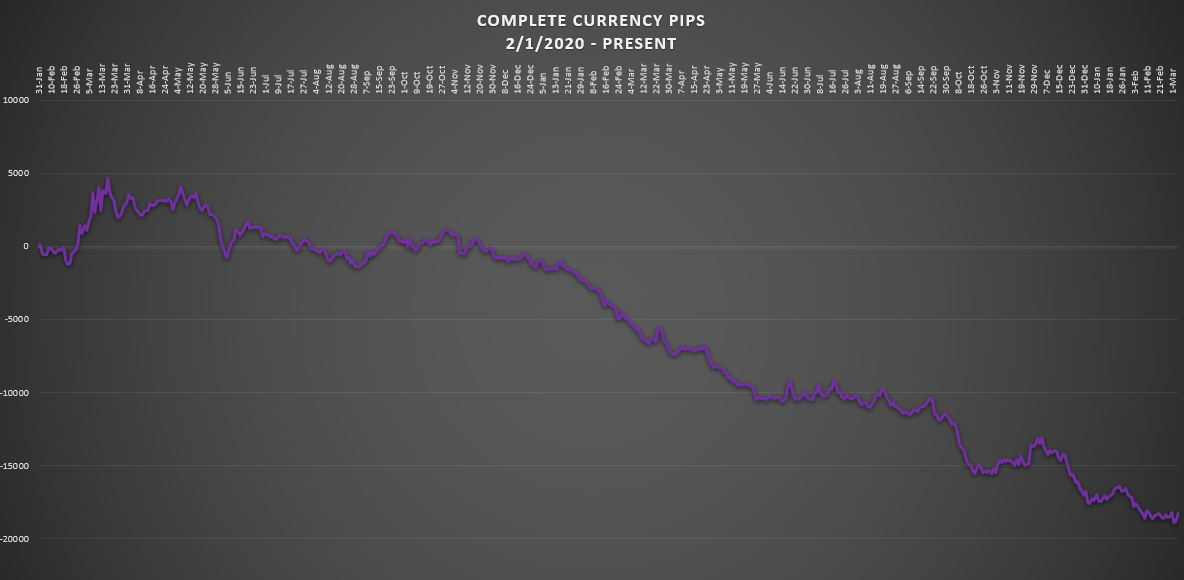
The JPY.
Nope. This is the era of a weak JPY. It’s that simple. We’ve never, along the way, seen anything different.
The CHF.
Ok. So. We had a top form. No surprise here. Then it retraces a lot of that. Bounces back on up a good bit, but it can’t go up to where it reached up to. Lots of sideways action. Then it drops. Let’s see. Where would the downtrend start?
Ok. This is what I think. The top was formed (top left), and it was on a downtrend ever since then. And then it hits a bottom. Which was April 2nd, 2021. It hit -981 pips. It’s been on a bull trend ever since that point.
Ok. Then someone could come along and say that it’s been on a downtrend ever since the top was formed. Would they be correct? Uhh…I guess so.
Well then, what do we have? An uptrend (like I thought at the beginning) or a downtrend (in the entirety of this context)?
This is so subjective. Here I am trying to find the truth of the matter and they sure know how to make things complicated. Well, I think the bias is for higher. Not lower. Maybe we need MORE time for this to play out. Cause what if this goes lower. Then it would follow the very longterm downtrend that’s in place. But if it makes higher swing highs, then I’ll just keep with its bias higher.
I could go either way. I can give arguments for both (in which I just did). See why I hate charts Journal? This is one of the big reasons why I don’t like 'em. It could go any number of ways. Good thing we’re only dealing with 2 things, high and low. If there was another option, I’m sure the CHF would find it. So that’s where I’ll keep it. Tentatively, it’s on an uptrend until the next swing level. Need more time. What more can I say?
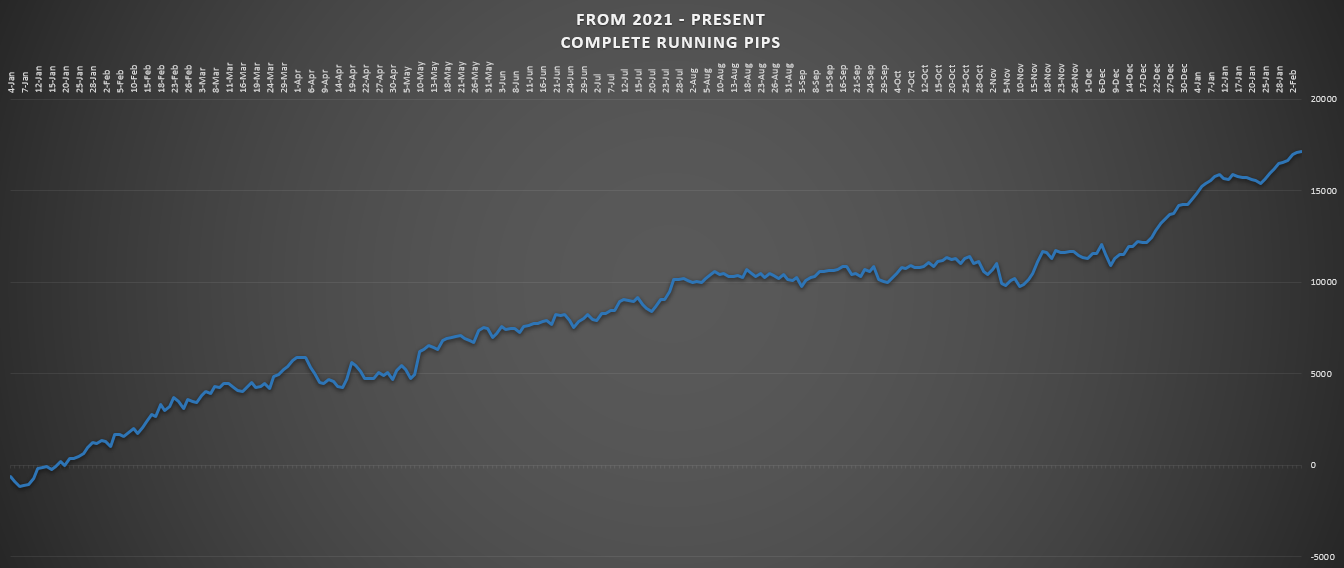
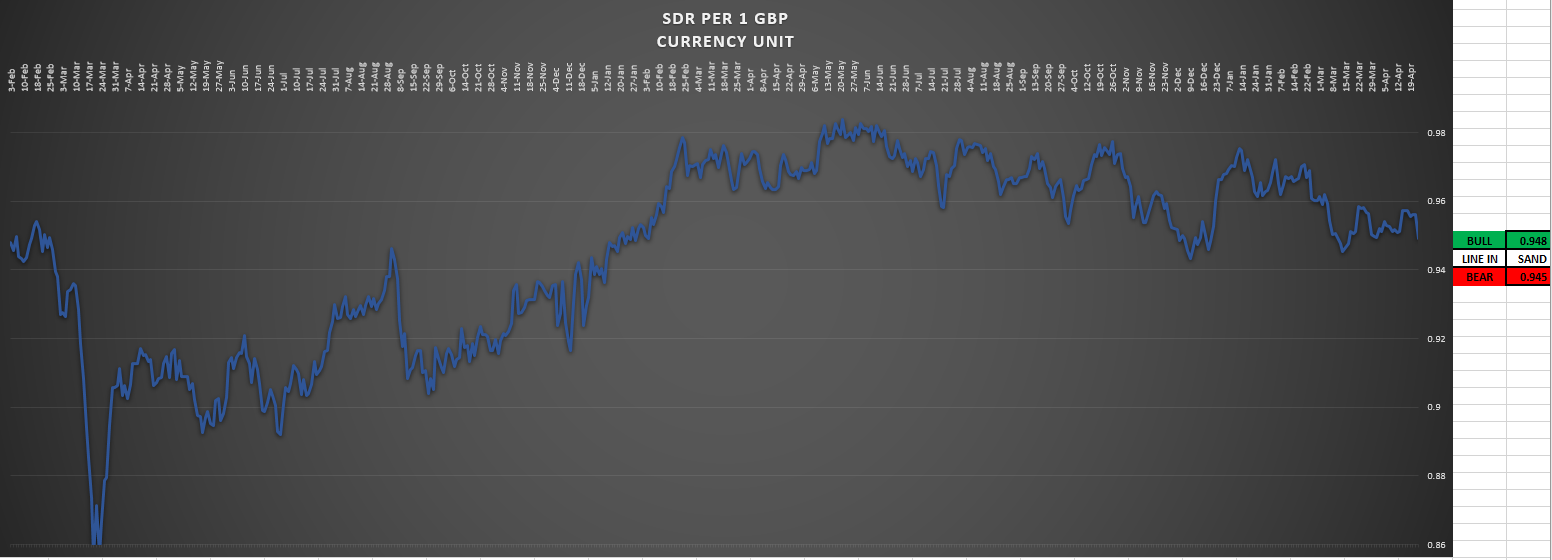
The GBP.
This is much easier. Thanks Pound.
2020 was characterized by a bouncy ball hitting the floor. Look. It hit the floor 4 times. And after each time it bounced back up some. But not by much.
Then 2021 comes and off to the races it goes. No doubt about this one. Actually, that spike (trend) started in Dec '20. They got a good head start for the year, alright. And there’s no indication of any kind of change to this monster bull run.
Speaking of monster bull runs…
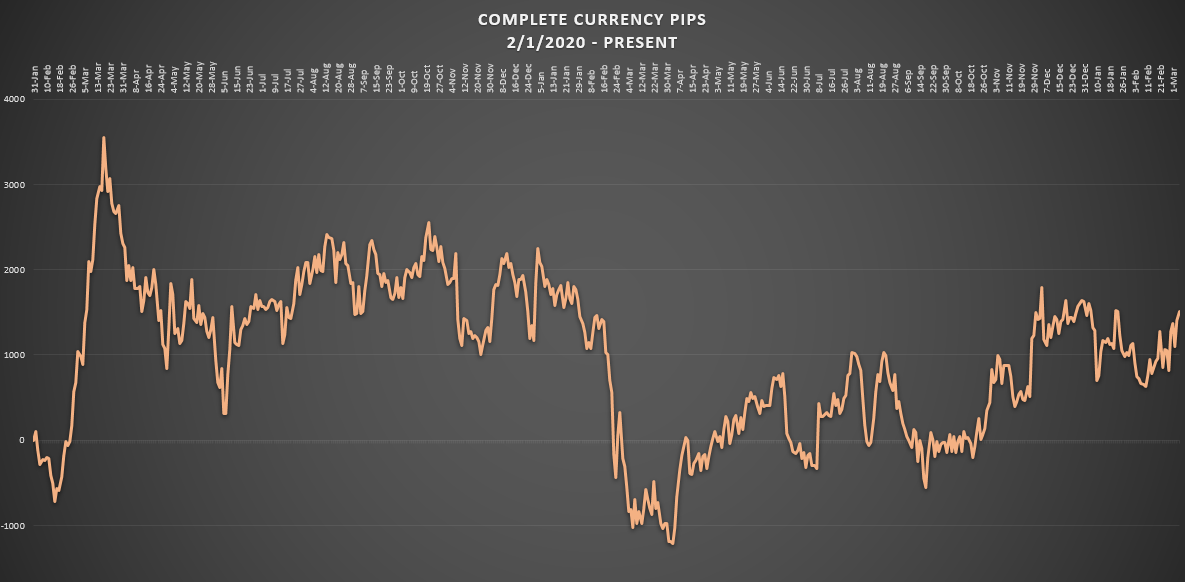
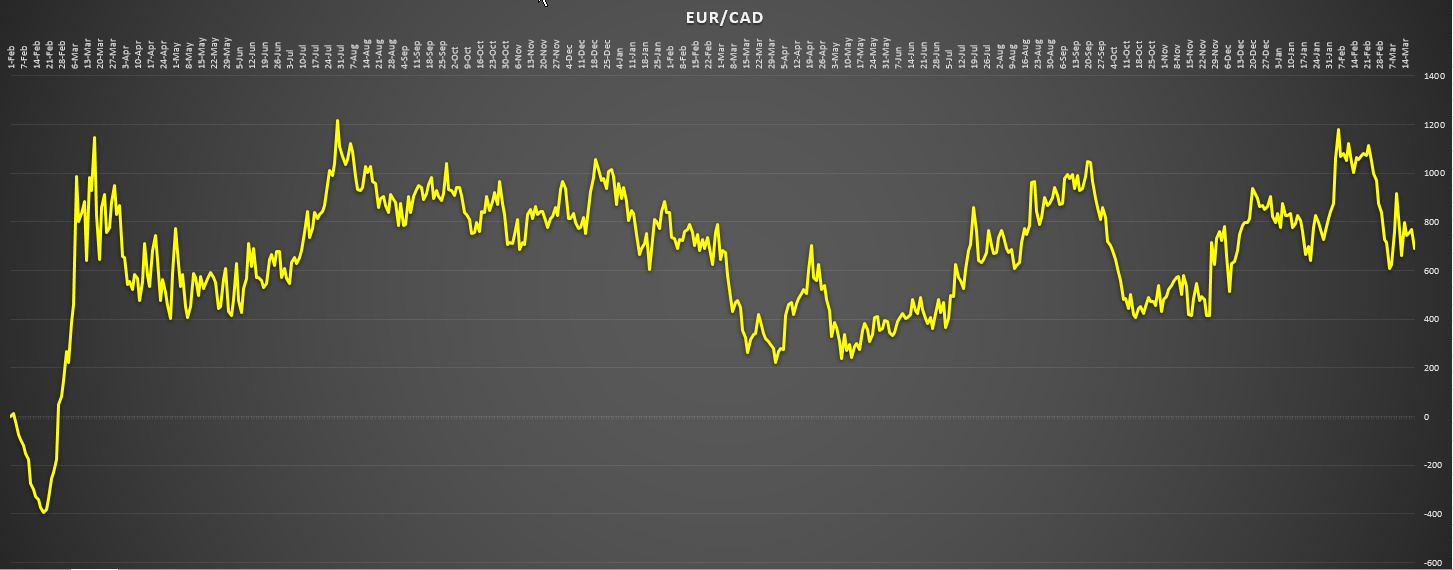
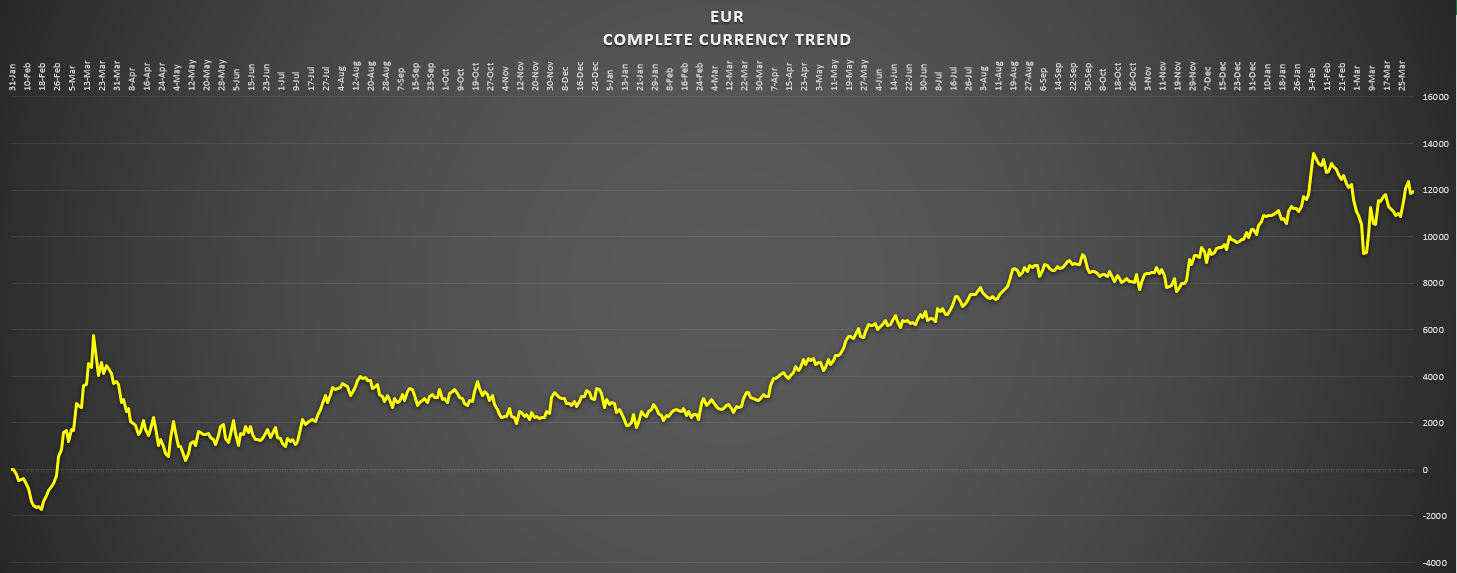
The EUR.
What’s interesting with this one is that the EUR appreciated greatly when the bomb went off. Look there. It went straight up. That tells me a whole lot. This is a favored currency. Just like the CHF. But this wasn’t the case with the GBP. When the bomb went off, then took a dive. Cause the Pound is considered a risk currency. And all risky type assets went down during that time. But not these guys. The EUR goes up like there’s no tomorrow.
Then it retraces back about halfway. Lots of consolidation going on. But not dropping. It’s being supported. It is definitely in demand. Not being sold. So then, when did this appreciation take off?
The actual bottom was a double bottom. Between Jan 15th & 20th 2021. If you look closely, it’s in the shape of a W. The 15th was the left V (of the W) and the 20th was the right V (of the W). Anyway, ever since that point, it was nothing but higher highs. Bias for high.
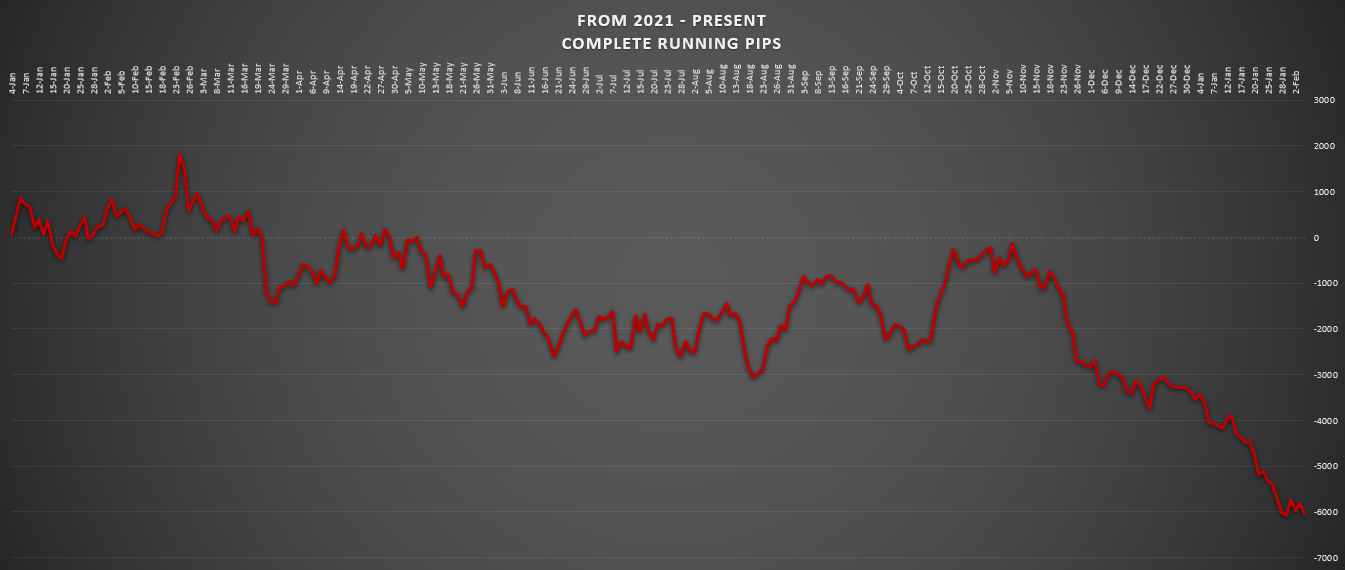
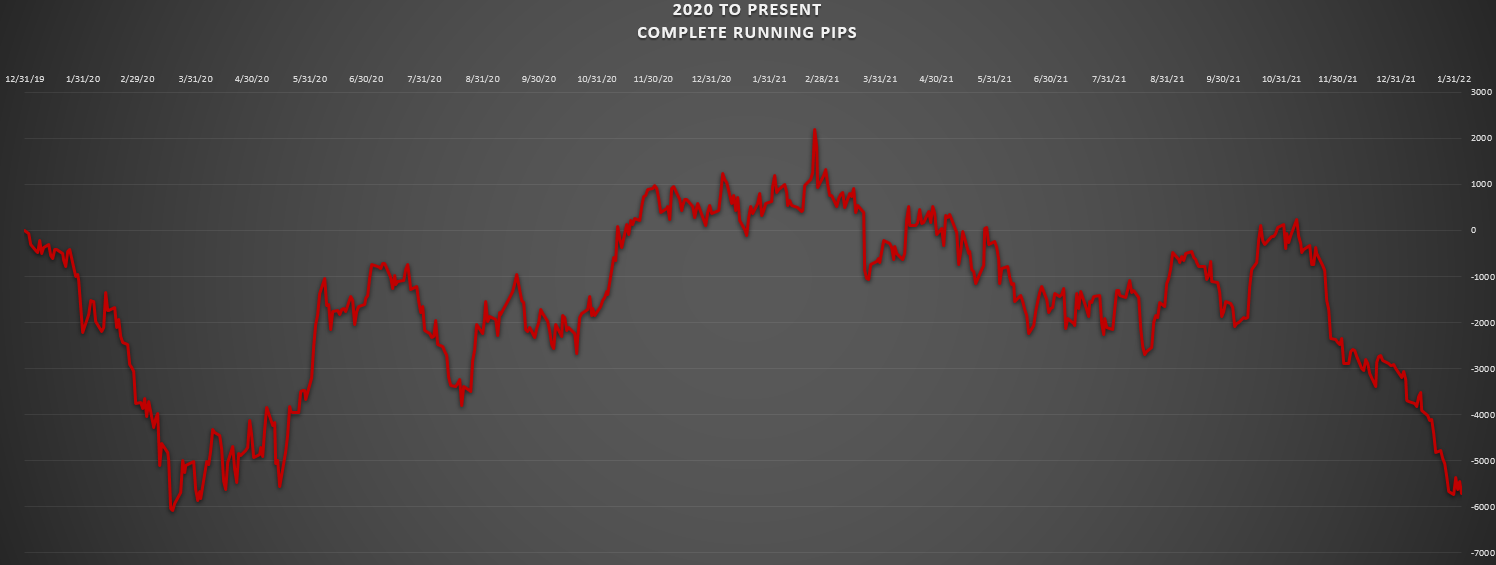
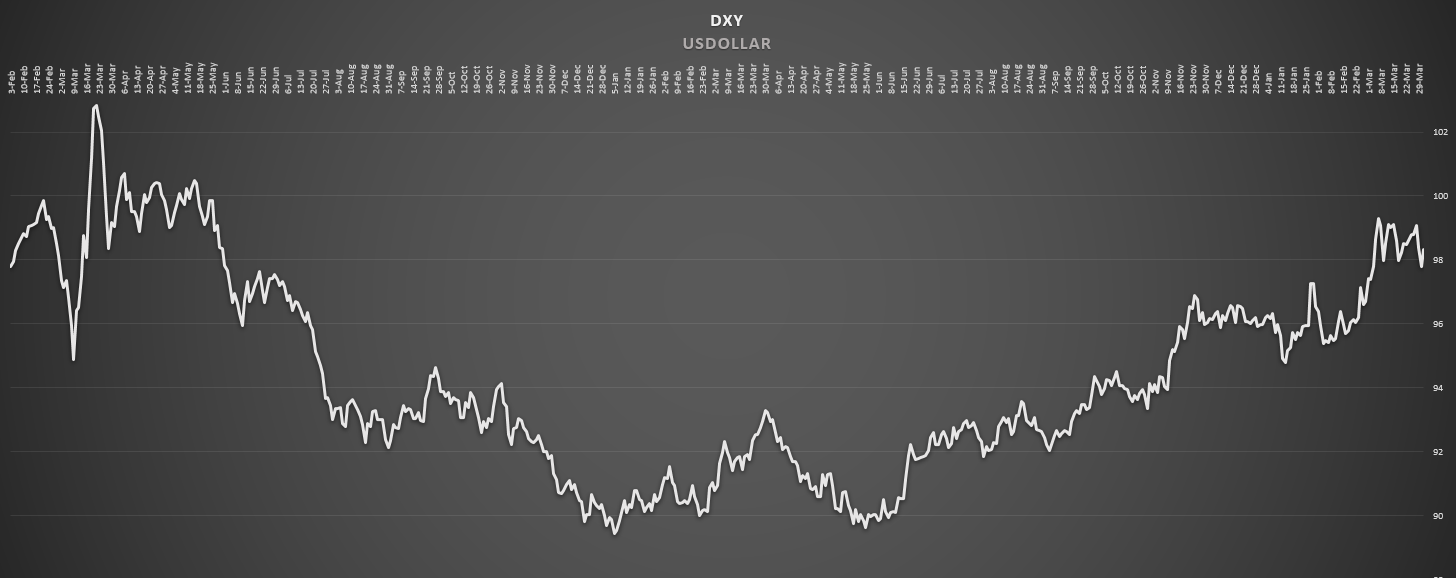
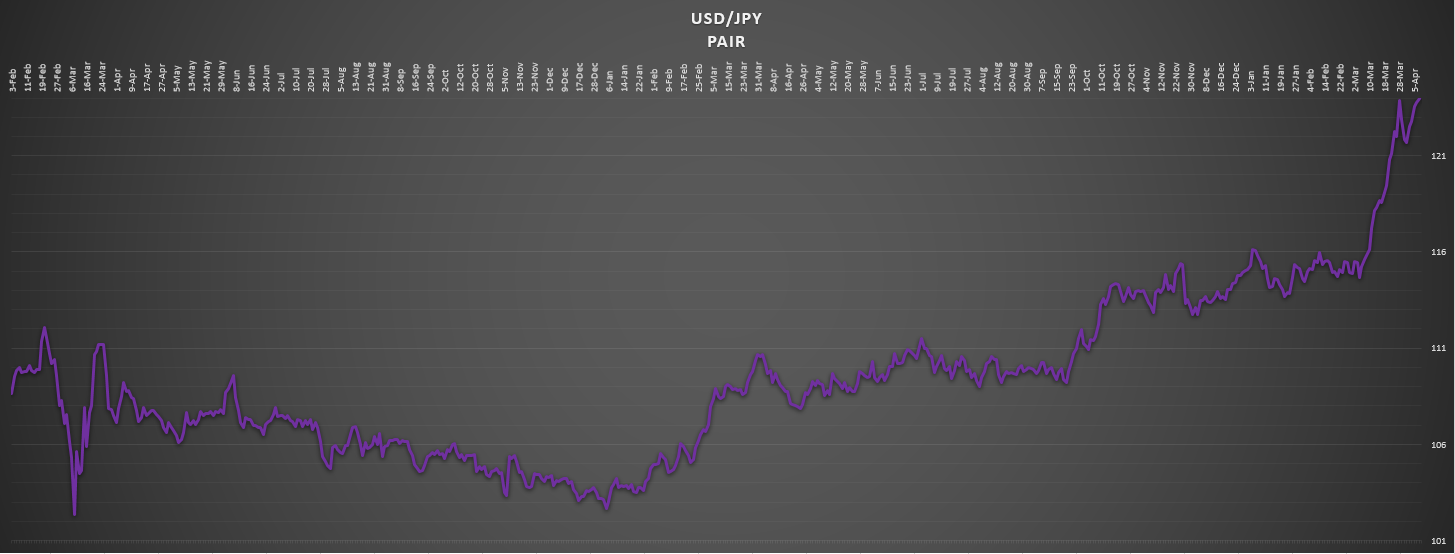
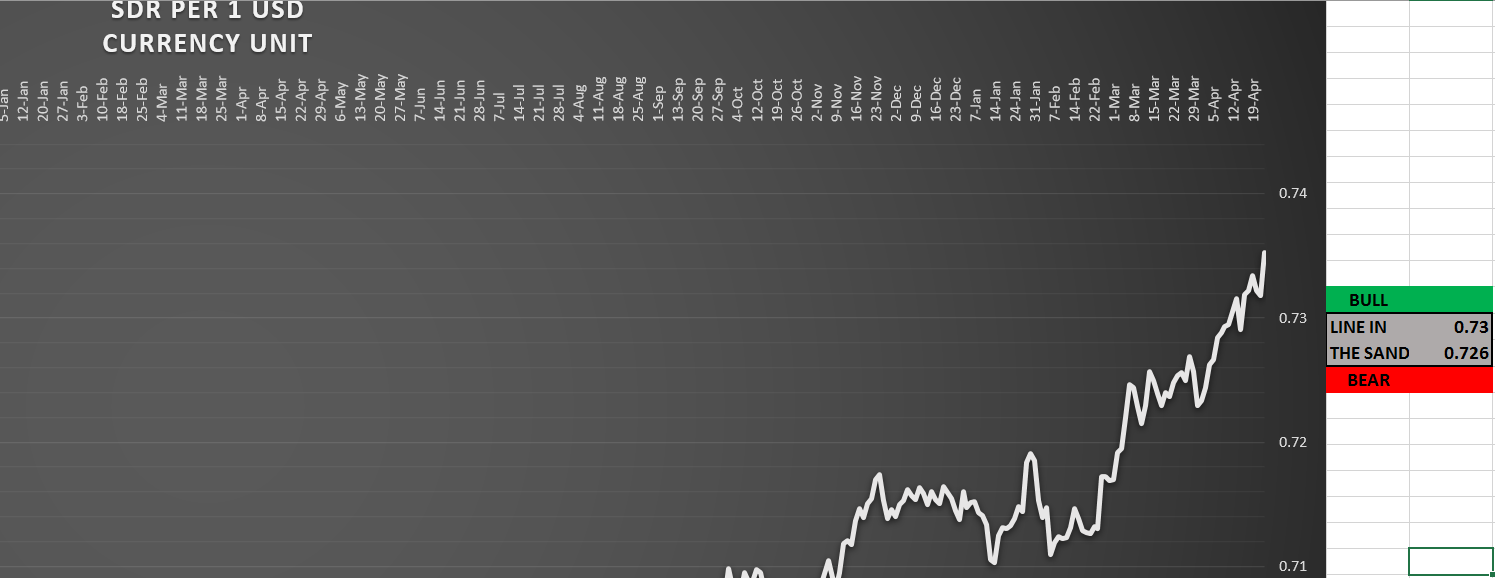
Last but not least, the USD.
I guess when the bomb went off the world needs dollars. Up it goes. That happened like nothing ever. But then it goes on such a bear market. That’s what everyone was talking about.
The Dollar is going away. Brace yourself. But don’t look now, it carved out a nice bottom of a floor. That was in the middle of June 2021. That big spike was about the 16th of June. Yeah, that made a statement. It doesn’t even retrace any of that higher move. Right? Just such a little amount. But that was the support area for a good long time. Higher highs came about, after that.
I mean look. This isn’t all that much of a bull trend is it? Not compared to what the EUR and the GBP has going for them. Now they have shown what a bull trend looks like. This is a sorry excuse, if you ask me, for a bull trend. Even in this entire context. How much has this gone back up since the bomb went off? Like…It didn’t even come back to the start of it! The zero line. Are you kidding me?
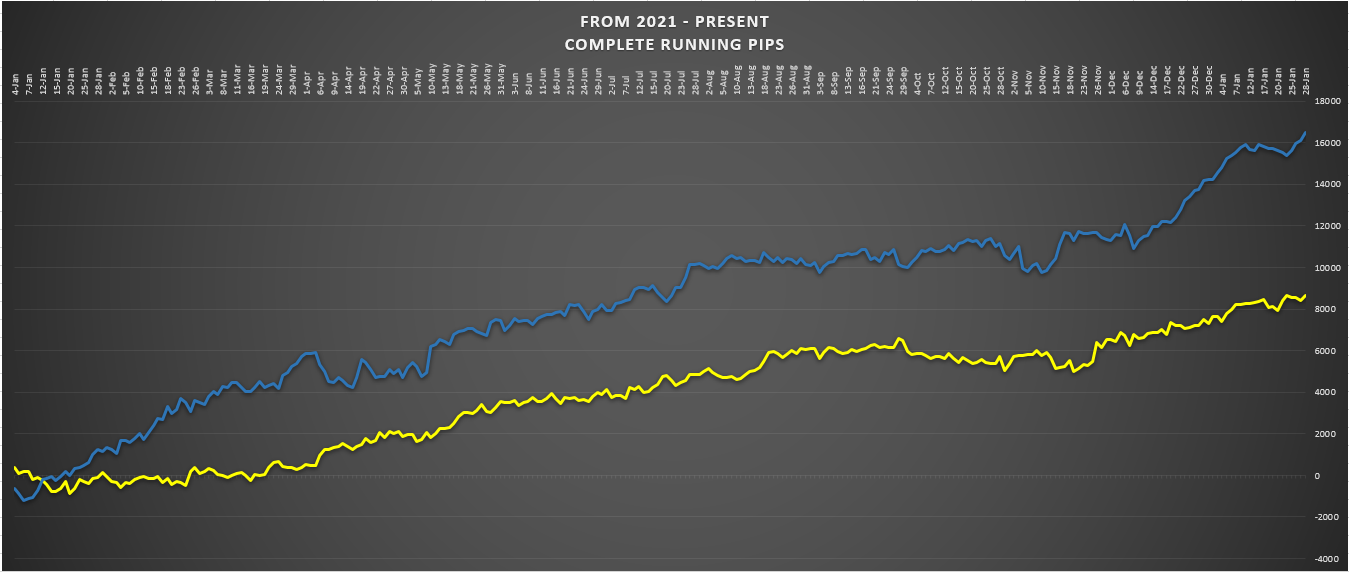
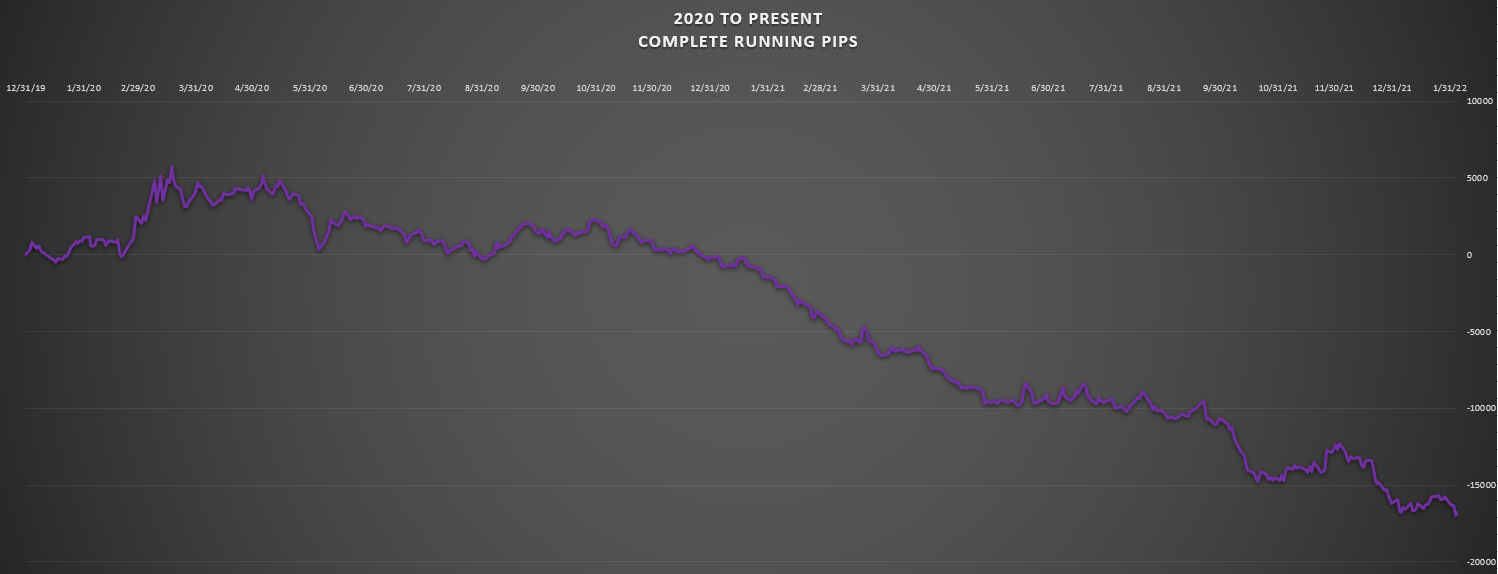
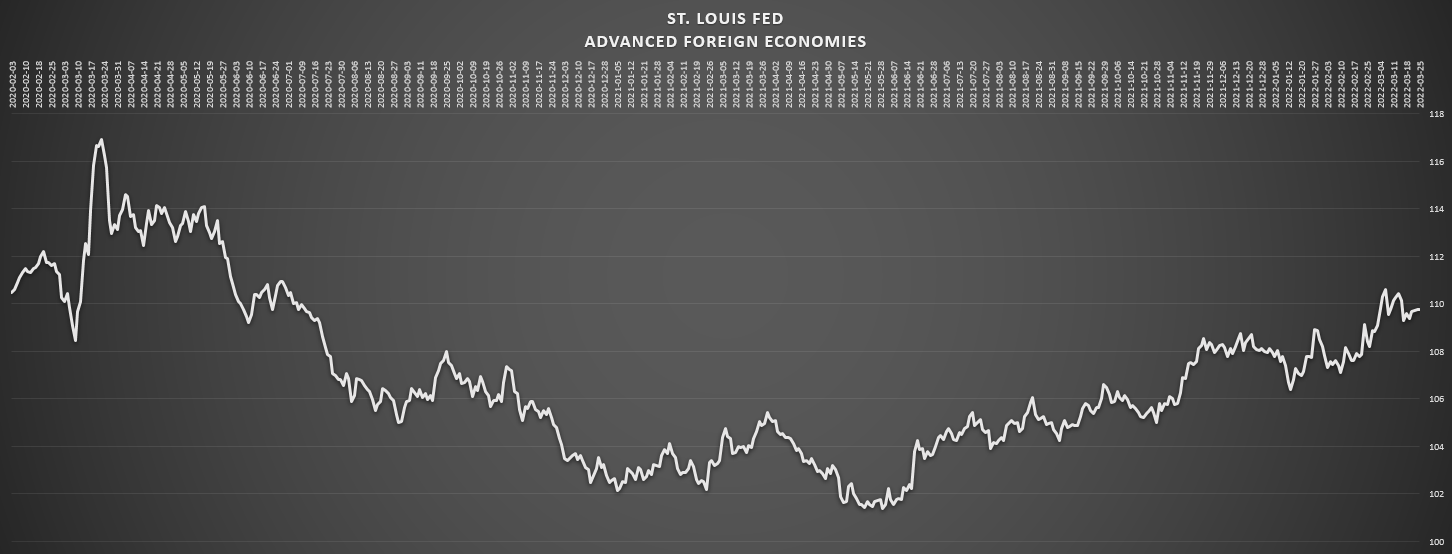
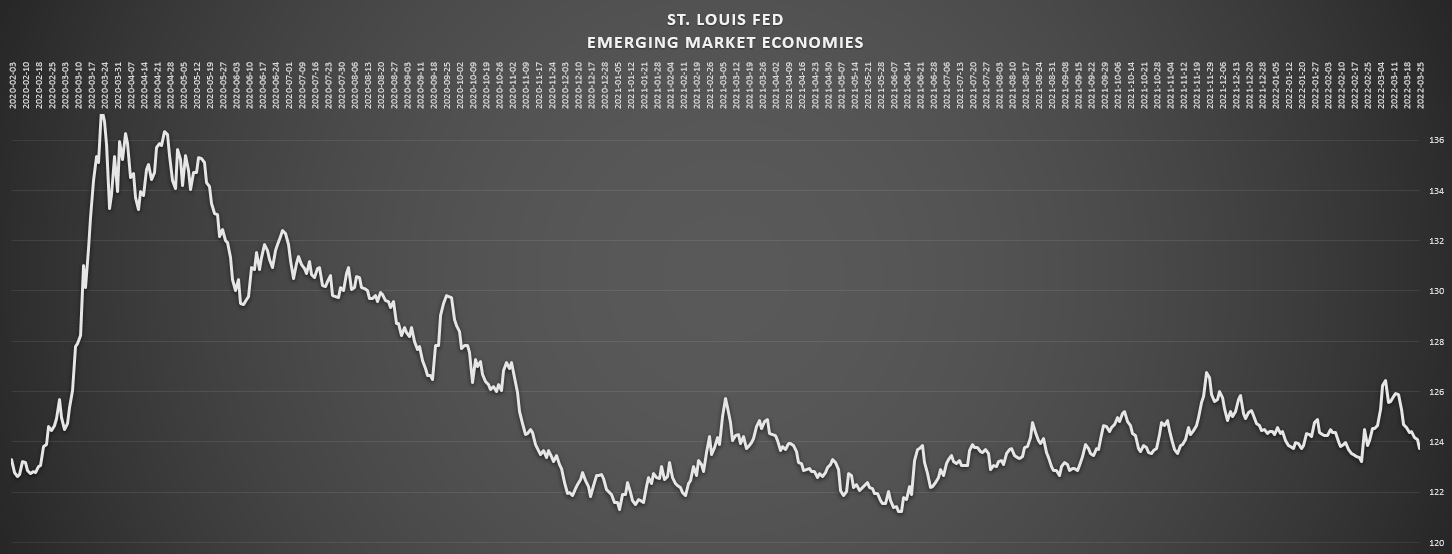
With that idea in mind, which other currencies have gone higher than when the bomb went off? Here’s those results. All 0 at Jan 2020. In order from highest.
- GBP = +17235
- EUR = + 14317
- CHF = + 972
- AUD = - 1875
- USD = - 2347
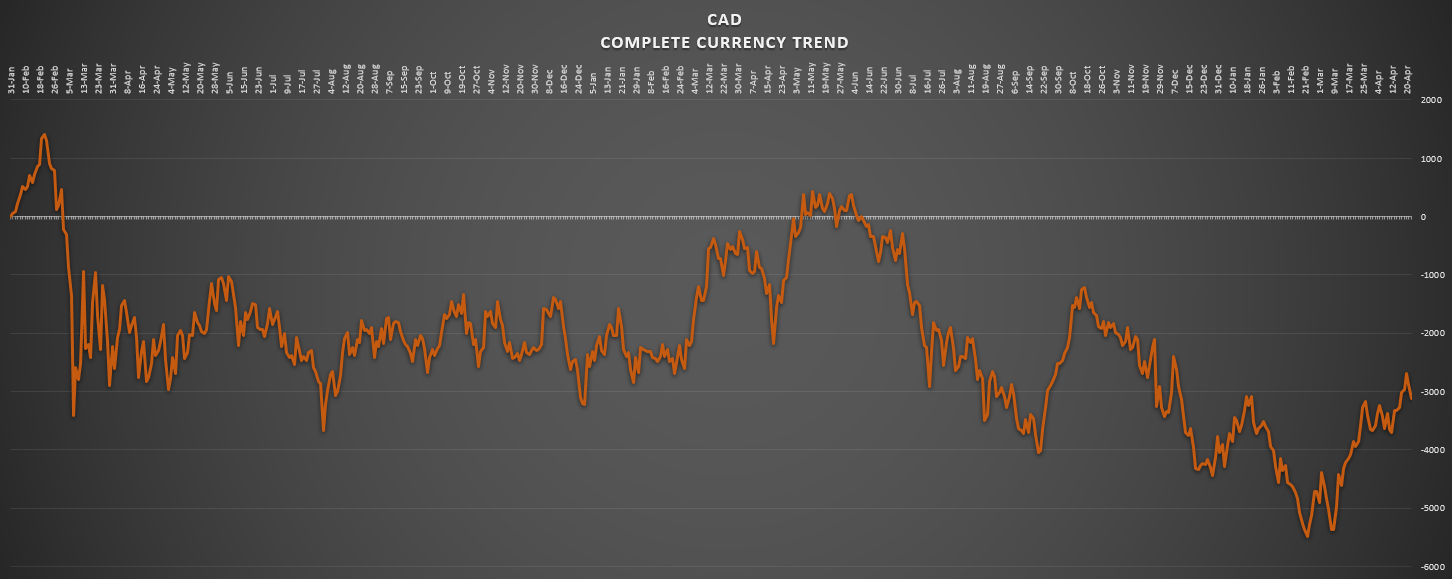
- CAD = - 5687
- NZD = - 5704
- JPY = - 16811
That’s all pip totals from Jan '20 to the present day. Complete currency’s totaled against one another. Each currency having 7 pairs added up, per day.
Ok.
Journal.
I know.
That’s nice.
I’m losing interest here. And I’m sorry that this is such a long post.
I guess lost track. There’s only one currency that I haven’t touched upon.
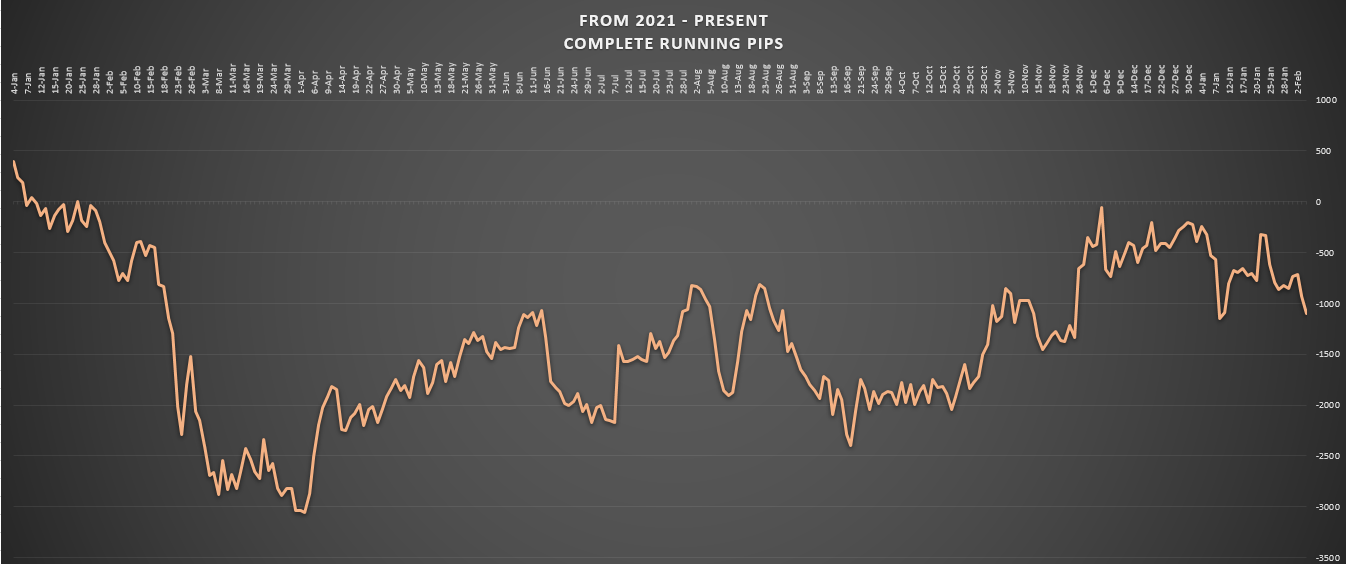
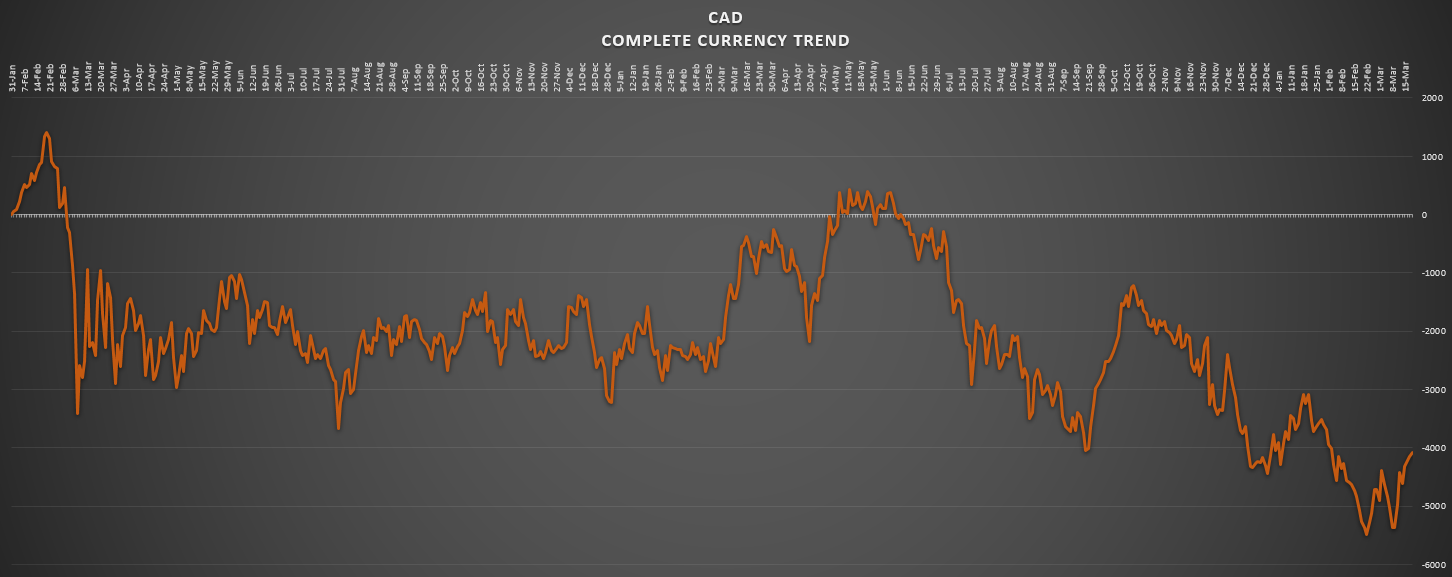
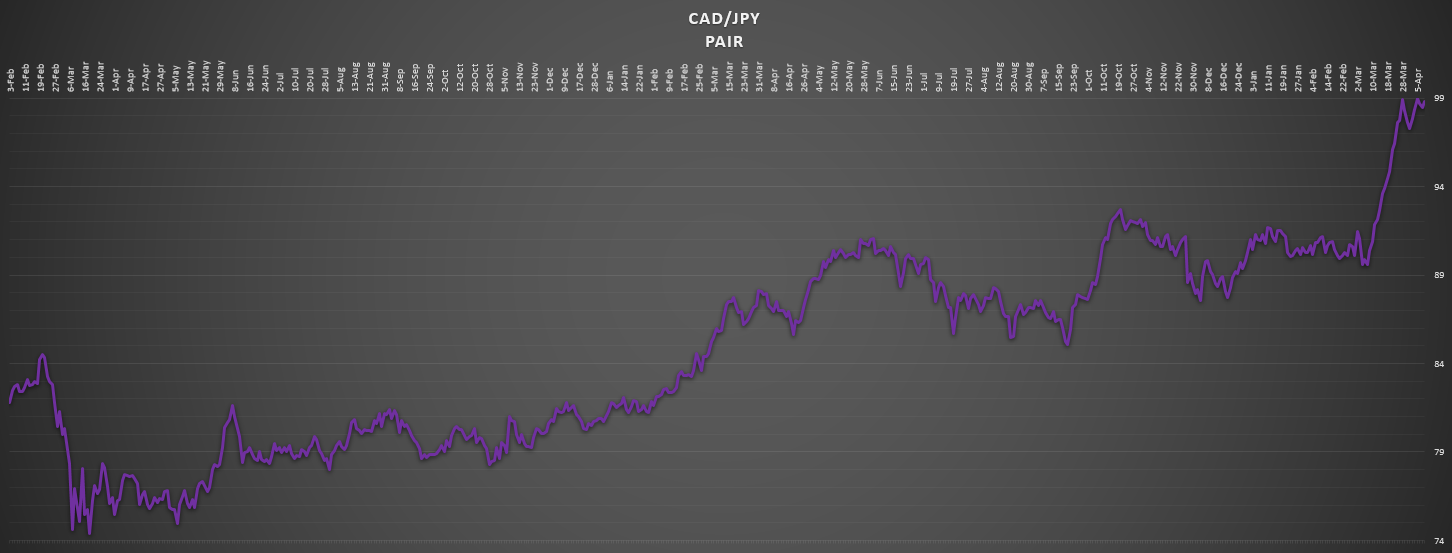
The CAD. Maybe this should cover it.
This is another tricky one which has some nasty dynamics to them.
Bottom line is that they’re in a bear trend. Ever since June 3rd of last year. That was their last high. But they’ve never even reached the 0 point since D day. In fact, the present situation gets them to the lowest level ever since that start.
Ok.
I want to switch gears a little.
How about some micro. I’ve got all the micro you can possibly get.
This should about do it.
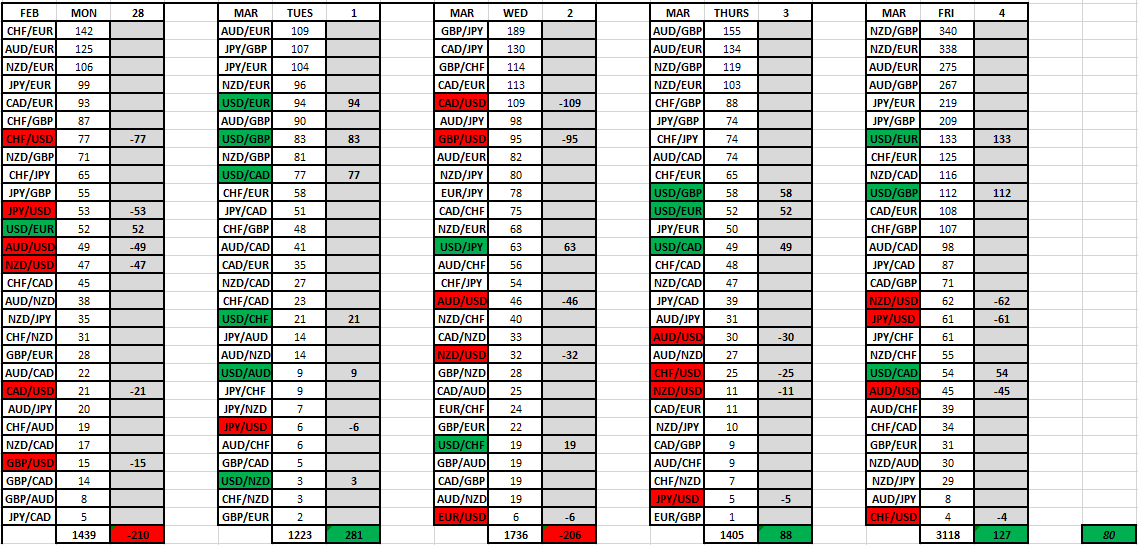
Let’s see. We got each days results. All lined up in order. With their pip results (disregard that right column). Then the weekly result is shown in yellowish.
Then the monthly result (which is just the weeks result plus one day). That’s in greenish. Then in blue (far right) is the yearly running results.
Alright Journal.
Out of time.
Got to run.
Thanks for listening Journal.
Mike