Naked November tradelog (scalping)

I do something similar with my horizontal S&R lines which I call GLORY…

G= Green (Dark) - Monthly
L = Lime Green - Weekly
O = Orange - Daily
R = Red - 4Hr
Y = Yellow - Hrly

with the higher t/f being the thickest line down to the lower being the thinnest

:smiley:

Hey guys, sorry there is no update today, I did not trade (Thursday 12/9). Yesterday I had a volunteer event which caused me to lose 2 hours off my regular sleep schedule (would be down to 4 hours). That was not an issue per se, because I was mentally prepared for that and didn’t want to skip trading. However, an unexpected altercation with law enforcement on my way home put me in a foul mood. I decided with low sleep and this on my mind, it would not be in my best interest to try to focus on good-form trading. Looking forward to Friday morning…

Friday 12/10/10
Quick stats:
7 trades
15min trend bias: down
Trades with 15min trend bias: 7 wins, 0 losses
Trades against 15min trend bias: 0 wins, 0 losses
1.5509% account change

Overall, not a bad trading session. Spreads were closer to “normal” (about 1.1) and activity was moderate. One thing I tried hard to do today was be patient when taking new legs.

By the way, I’m thinking I will start something new on Monday. I want to work on transitioning my account in a way that will support good psychology. I try to stay de-focused on the equity and drawdown balances during my trading session for the most part, but I am still aware of them at some level. The main reason I try not to place emphasis on this is because I want to stay focused on percentages, not dollars or pips. My plan is to be able to ramp up the account as needed with little or no impact on my psychology.

Starting Monday I am thinking to double my account equity and likewise the units I’m trading with. I will keep a close eye on the trading during this next week, and if all is still good (psch-wise), then I will continue doubling the account for each week that my trading is in good form. If things go crazy, I can just crank down and take smaller steps if needed.

Monday 12/13/10
Quick stats:
5 trades
15min trend bias: up
Trades with 15min trend bias: 5 wins, 0 losses
Trades against 15min trend bias: 0 wins, 0 losses
0.4712% account change

Today was slow and a bit boring. For the first time in awhile, Oanda spreads were back to normal at 0.9. Price seemed to tick around very slowly, then from time to time there was a spurt here and there. In conditions like this I typically see the spurts going in the direction of my bias which I am thankful for. Wish there had been more setups today.

Tuesday 12/14/10
Quick stats:
13 trades
15min trend bias: up
Trades with 15min trend bias: 12 wins, 1 loss
Trades against 15min trend bias: 0 wins, 0 losses
1.2695% account change

Today I tried to refocus my efforts on scalping. I’m afraid I may have been slipping back into the swing-trading mode recently, looking for too many pips per trade. It’s great when a trade can reach a logical target, but for scalping I think I’m more successful when I have a larger quantity of trades. The best way to do that is take good-form setups but always take the profit quickly. Then I can do it all over again more times (vs. getting stuck in trades, for example).

Wednesday 12/15/10
Quick stats:
14 trades
15min trend bias: down
Trades with 15min trend bias: 13 wins, 1 loss
Trades against 15min trend bias: 0 wins, 0 losses
-5.7250% account change

Oh boy what an exciting day it has been :confused: First I got to experience my first Oanda platform outage. It was downright scary. There was literally no-access to the system. The platform went out as I was clicking to close my scaled position. I tried repeatedly to get back in but the server seemed to be down. I also tried m.fxtrade.com, which is a lightweight mobile version. It was down too. I tried the Oanda telephone numbers, but they were busy. Then I tried the FXtrade app on my iPhone. Surprisingly, this DID work and I could actually see my position floating around (in lots of profit I might add). I went through the app and pressed “close position”… after a few delays it finally said “position closed”, but never actually did anything (the trade still appeared as an open position). So I pressed “close position” over and over again, each time getting a confirmation that it was closed. (Sidenote: the app is useless if it can’t take the order and gives false confirmation!) Finally after several minutes the regular Java platform became available again and I was able to login and manage the trade. It was still open and I decided to take another leg on it, based on where price had moved during the outage. Fortunately I was able to get out at a handy profit on this one.

After that, I had a really good trading session. Lots of activity. Spreads higher but not ridiculous (seemed to be about 1.1 to 1.2). In reviewing my chartshots, it looks like all of my trades were taken in good form. That’s a definite positive, and what I’m looking for.

Near the end of the session though, a scaled trade went against me. This time I did not win the tug-of-war. I feel like I traded more “responsibly” this time because I set a more reasonable stop loss. I first looked at the level I’d be at with a 5% loss. After some consideration, I decided that a better level existed around the 7.6% level, so I decided to use that instead. I actually forgot to take into account the gains so far from the day (~1.9%) and as a result sustained a smaller loss overall. But in retrospect, I might have set a higher stop level had I properly incorporated the gains thus far. I’ll have to come back later and determine if any reasonable stop level could have saved this trade.

I will say that I’m not comfortable with this “unknown” of when the next trade might go seriously awry. I’ve lost about 6 trading days of gains through this, and that’s a lot. I want to figure out a way to fix this problem. I will do some research and look again at mechanical stops – perhaps I can calculate the historic drawdown of good-form trades and see what would happen if I had set a mechanical stop just above them? I have to always keep in mind… that a very tight stop might be good in the grand scheme. It seems bad on the surface because it would probably increase the quantity of losing trades. But with a very tight stop (say 10-20 pips), I can afford to greatly increase my per-trade leverage. I can’t say which plan is better without doing some further analysis to find out.

hello.
if i may add another advice to you.
while i also dont like ot use hard SLs, i do add a hard TP in such case. The size of TP depends usually on the number of the current leg, ie leg #1 might have a 10 pips, while leg #3 might have 15 pips…usually if more leg to the trade, of course my breakeven is coming lower too, thus the initial TP level expectation might be lower too…while of course i believe the price will hit that level, i found in scalping speed is key, and being out fast vs max profit, i find the former more inportant and safe.
Entering a hard TP for a scalp NOT meaning i intend to use it, maybe every 20 times once i let the price hit the hard TP ( i would like to improve this number some, since the TPs are very realistic ones, but again, i think scalping for me is hit and run while the probabilities at their peak, and not the max profit on one position).

anyway, you got the point, maybe you feel to use it in the future sometimes :slight_smile:
as i said, we have a very similar trading style, and since i am trading this way a while beyond you, why not share some ideas?

Wednesday 12/15/10 – OOPS
Oops, I made a stupid platform error. It is somewhat unusual to have a big loss like today. I have probably been incorrectly handling entry of the extended takeprofit and stop levels. I should link these to the original positions but instead I have been entering them as separate orders. Today I got bit by this practice, as I forgot to cancel the takeprofit order after the stoploss triggered. This resulted in an incorrect late-Wednesday entry when I wasn’t even online. Fortunately I had a stop also on that position. The net result is that I paid a stupid-tax on this one.

Thursday 12/16/10
Didn’t trade Thursday because of wisdom teeth surgery.

Friday 12/17/10
Quick stats:
27 trades
15min trend bias: up, then later down
Trades with 15min trend bias: 25 wins, 2 losses
Trades against 15min trend bias: 0 wins, 0 losses
-0.5249% account change

Today I traded a few extra hours trying to catchup from Wednesday’s fallout. Unfortunately the first trade of the day was also a loser, which turned the day into somewhat of a spinning-of-the-wheels. Overall I’m pleased that most trades taken in good form. Also, this is the first time I’ve traded into the New York session, so I feel confidence that this method can work outside of the limited hours I have been trading.

Friday 12/17/10 cont’d

Monday 12/20/10
Quick stats:
5 trades
15min trend bias: down
Trades with 15min trend bias: 5 wins, 0 losses
Trades against 15min trend bias: 0 wins, 0 losses
0.8563% account change

So I’ve decided on a method for dealing with holiday low-liquidity… I’m planning to watch the spread cost. On Oanda the “normal” spread is 0.9. Since Thanksgiving it has been higher, as high as about 1.3 at times. I think I will stay in the game unless it exceeds about 1.5. That will be my indication that liquidity is too low.

Today spreads were similar to what I’ve seen recently, ranging from about 1.2 down to 1.0.

Made a couple execution errors today, but otherwise trades in good form. That’s what I like to see. The scaled trade was acceptable, never got close to my stop level. But nonetheless, I’d love to figure out a better solution for these. One thing I’m exploring is related to tingtong’s idea about RSI… Ideally I would like a way to be able to tell MID-TRADE if the trend is changing. I want to know when to relax and let the trade keep developing vs. cutting losses and moving on.

Great idea – thank you … I’ve already started doing this as of Friday. For now I’ve hardcoded a 10-pip takeprofit in the platform, that is applied to every trade. For scale trades, I now manually tweak/consolidate the takeprofit after each leg. I don’t plan to hit these takeprofits, as you said, but in the event of platform outage or a quick run, it’s possible I could snag a few more pips.

Tuesday 12/21/10
Quick stats:
10 trades
15min trend bias: up
Trades with 15min trend bias: 10 wins, 0 losses
Trades against 15min trend bias: 0 wins, 0 losses
1.2093% account change

Pretty easy trading today, no major issues at all. Felt a little herky-jerky, probably lower liquidity I’m sure. At times the price would just stop for several (30sec) bars, which is also unusual.

hi
i think it is time to stop trading for the year, however hard it might be, still the best decision.
liquidity is obviously low, the trading range is much smaller than usual, and charts start to be misleading with the same patterns forming and same indicator signals on 10-15-20 pips range, which i dont think of as a real high probability set up.
relax, and dont risk much ondays when things unusual. Even when liquidity is normal, daytrading doesnt have to mean trading everyday :wink: best to trade when there is a real reason, a high enough probability behind. and only then.

i am looking forward reading your entries from January again, and hope could contribute a little to your thread! Happy holidays!

You don’t seem to use 5M chart?

Hello Dusktrader,

you seem to have a very impressive win ratio. I would just like to know do you use B.bands or any indicators? Or are you just making entries based on candlestick analysis.

If you make 10 or so winning trades, how many pips are you grabbing per trade. If you dont use a S/L does that mean that you just exit once you grab afew pips, or else when you go alittle bit into monus territory.

I have read pip-syphons post and also Tymen1s [I]joy of candlesticks`[/I]
trading method. I too will use Oanda as a broker and I am trying out bth trading styles on a demo account.

Thanks alot

Hello hello, it’s me again. I’m back at the grind, at least for the next few days until we go on holiday again at the dayjob. I had already decided that I wouldn’t trade in this week, regardless of the spread situation I mentioned above. But I still keep my daily regimen up and instead of trading I’ve shifted gears to more of a hands-on study role for this week. Btw spreads today were actually normal at 0.9, so I don’t think that is a very good indication of liquidity (bad theory huh?)

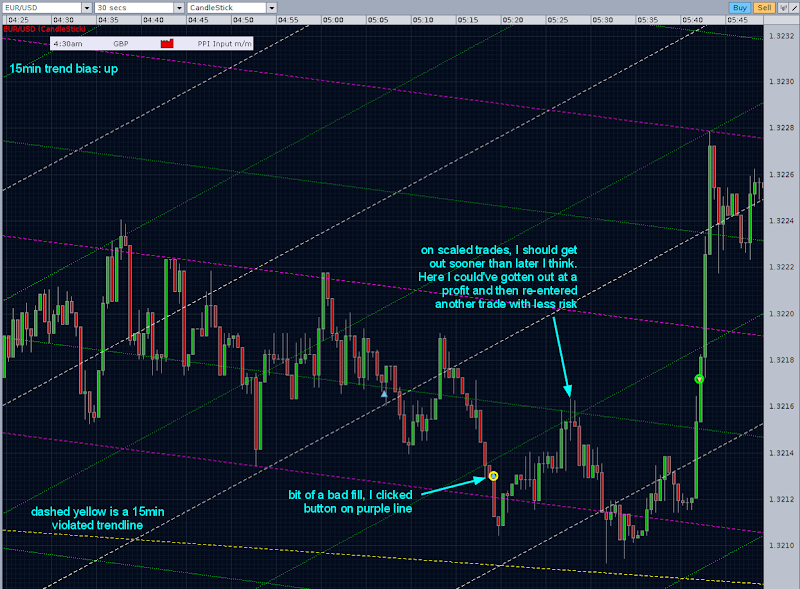
Well, I did get bit in the butt on 12/22. I really shouldn’t have traded that day, but I did it anyway. On some level, I needed to get bit so I could grow through that pain on a small account. There are always lessons to be learned. I guess in some weird way, I wanted to prove to myself that I WOULD get bit if I traded in irresponsible conditions like this. I’ll post the chartshot when I get around to marking it up… but it was basically the “worst case scenario”… got stuck in scaled trade and had to setup autopilot. Used a 10% stop loss, which did eventually get hit. Overall the market was just erratic.

One great thing about this experience is that it underscores in my mind that the #1 thing I need to focus on is stop controls. I think I am building a system that has multiple components here. One component is the “trading” part. This is the fun part where I get to buy and sell, scalping pips here and there. Sometimes I get to scale too, which can be like hitting a jackpot in some ways (it’s a lot more pips on average than a typical 1-leg scalp). But there are other components as well, and these are the ones that need work. Namely… identifying the trend properly (to maximize probabilities) and closing the gap with runaway bad trades (they’re gonna happen, so I need to have a solid plan).

This week I’m making some good progress. I’ve decided that one thing that could help me is a more responsive trend indicator. Right now my trend indicator is 100% discretionary and I base it on the 15min chart. But it’s been in a sideways pattern frequently these days, and I feel like I’m just “guessing” which I do not want to do.

It’s very important to me, at least for now, that the trading component stay completely naked. I do not want to use any indicators to tell me when to trade. BUT, I think I’m ok with the idea of an indicator “indicating” what the current trend is. As I’ve mentioned before… my philosophy is that scalping can work in any market conditions and in any trend. It can even work if you are accidentally trading in the wrong trend direction, as I’ve done at times. The reason I believe this is because I’m trading the 30sec chart, which is full of micro trends or maybe “noise” as some people call it. This noisy hum of the market is always happening, so there are always scalp opportunities I think.

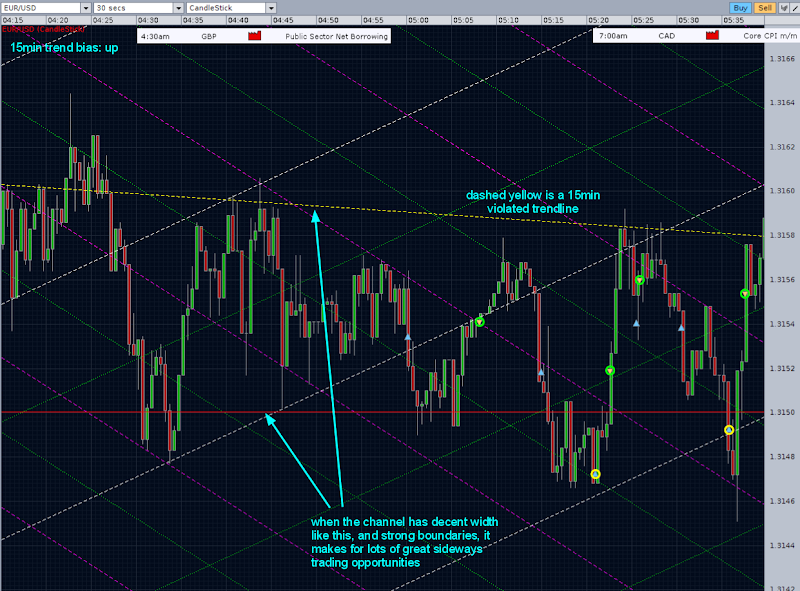
BUT, certainly it is true that trading WITH the predominant trend is helpful, and increases probability of success. So if there was a way to identify this so-called trend, then it would serve the trader well to have a bias.

This brings up another point I have been studying this week. If a trend was to be studied, which time frame is relevant with regard to scalping on the 30sec chart? It seems like you’d want a larger timeframe because you don’t want to get whipped around too much with the mini-trends. Plus when the broader market trends, it will go in waves on the smaller timeframes. I’m trying to find the sweet spot trend that I can hop on and scalp in harmony. It could be that the 15min trend is too far detached from activity on the 30sec chart.

So with those ideas in mind, after looking at the Oanda indicators at my disposal, I’ve come up with this handful that I like – meaning, I could probably make rules and use them as reference points in my trading. As of Tuesday, I’m leaning towards PSAR only because I like this best and I can make very non-discretionary rules around its use:
[ul][li]Awesome Oscillator default 5,34 on 5min
[/li][li]Williams R(66) on 5min
[/li][li]PSAR (0.03, 0.3) on 5min[/ul]
[/li]Note I’ve identified the 5min chart trends to be much more relevant (in my opinion) to what’s happening on the 30sec chart. My theory here is that, in the event I should find myself trading counter-trend to the broader market, the pain should last only a few minutes before PSAR would indicate a reversal.

So my logic is this: I will watch the 5min chart with PSAR (0.03, 0.3) and take the current trend indication from that. Based on that trend (up or down), I will then follow the 30sec chart as usual and look for the good-form setups that I always try to find. The difference in this method is that I could potentially be changing my bias several times in the 2hour block that I trade.

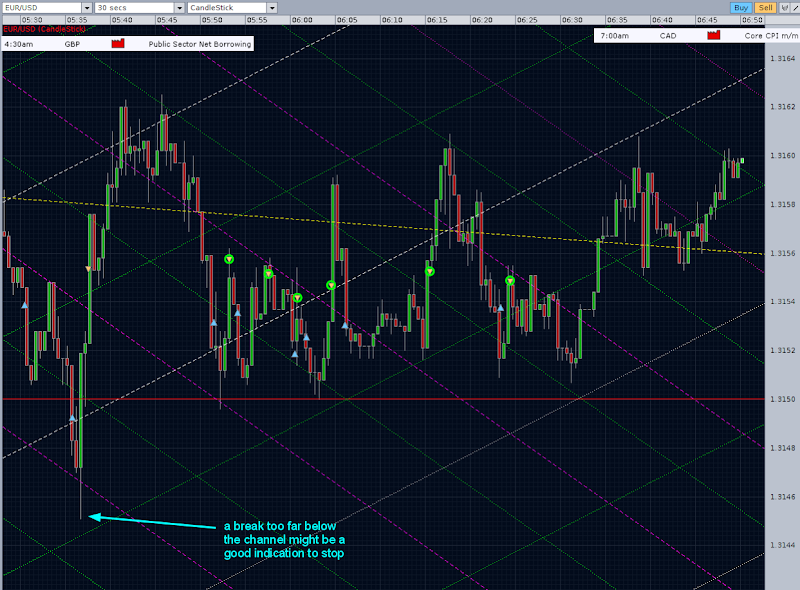
I think I can also incorporate a stop into this method. Without a doubt, if I am still in a trade and 5min PSAR indicates a reversal, then I need to get out. So currently I’m exploring the feasibility of using 5min PSAR as my hard stop. This means I would scalp normally on the 30sec, scaling as needed, etc… but if 5min PSAR gets breached, I’ll take an immediate loss. I need to explore this further to see if it’s getting me out quick enough.

Anyway… good times… I love the action. I’m really looking forward to live trading again on Monday.

I have not used it so far, but I’m looking at it now as a possible trend timeframe.

Nope, this is naked trading and 100% discretionary. I don’t really place much emphasis on candlestick patterns either. Mostly, I’m watching price behavior around the trendlines I draw.

I don’t track pips-per-trade. I focus on percentages only (as in percentage gain or loss on the day). You can probably get the pip info from MyFXBook stats. To me pips are completely irrelevant and they would also be confusing to me with my swing-trading background.

Yes, you are correct, I usually exit after grabbing a few pips. I watch the Oanda pip counter in realtime. I am targeting about 2-5 pips per scalp, but sometimes its more or less depending on the price action. If price hesitates I try to take the profit and run.

I have read pip-siphons thread and get a lot of inspiration from his method. I will probably read it again soon to see what other gems he has hidden in there. I have not yet read Tymen’s thread.

Hey, one idea… you should open a live Oanda account with just a few dollars and trade pennies. That’s what I’m doing, and it’s really different than demo trading…

Thanks for the positive thoughts in my thread.
I am excited to start a new year as well.

Wishing you great success in 2011!

P.S. I had some minor success with PSAR as well…
that may be the way to go… tweaking it for your 30 sec charts.

Ok, after MUCH fighting I have finally figured out how to upload a video of how I draw trendlines. I don’t have too much experience with screencasting so I’m still learning. Looks like Google squished my video and made it fuzzy. I might be able to tweak that a bit (I’ll try).

In the meantime, here is me drawing all my trendlines (as described in a post somewhere above) on every timeframe. I started from scratch and did this in my demo account. Make sure the lower-right corner says “360p” for the best resolution.

Video link here

EDIT: moved the video, this one is much easier to see

Im not seeing any video