ok got it
Thanks for exelent thread
ok got it
Thanks for exelent thread
Wednesday 12/22/10
Quick stats:
2 trades
15min trend bias: up
Trades with 15min trend bias: 1 wins, 1 losses
Trades against 15min trend bias: 0 wins, 0 losses
-9.8966% account change
Ouch. Well, couple lessons learned here:
Monday 1/3/11
Quick stats:
4 trades
Trend bias: now based on PSAR indicated on 5min chart
Trades with 5min trend bias: 3 wins, 1 losses
Trades against 5min trend bias: 0 wins, 0 losses
0.2727% account change
I have made a new rule about trend bias and will be testing this over next few days: Instead of taking a 15min trend bias as part of my setup routine, I now keep the 5min chart open in the background (previously just the 1min chart, which I didn’t reference much) and apply a PSAR (0.03, 0.3) indicator. The purpose of the PSAR are twofold: 1) to identify a more-relevant trend bias, and 2) to create a definite stop level.
This will allow me to take trades in both directions depending on the current wave of price action (and I believe 5min action will be more relevant than 15min action to a 30sec chart). Additionally, when price breaches the PSAR on 5min chart, I’d like to use that as an indication that my trade should be stopped. However, I will keep an eye on this because I’ve noticed that sometimes price will tease the PSAR level, enough to breach it even, without actually reversing. Additionally, PSAR is somewhat aggressive in that it continues to tighten if price action is moving sideways. If I’m in the middle of a trade, I don’t want to take a stop unless it is clear that price has lost its trend-in-force.
hi Dusktrader!
good luck to your trading and journal in the new year!
a few questions if you dont mind:
what does the autopilot exactly means on your chart?
is it really important for you to trade with a so called trend bias?
i sure prefer to trade vs sentiment more than vs trend bias…the more extreme the sentiment, the more i pefer to trade, of course along support/resistance and candle formations.
if and when they are together, then comes the system with the trades, where actually the position sizes and the scaling to the trade is quite mechanical and not much discretional anymore.
must say i enjoy very much reading your journal and seeing the progress.
do you have a running total of the profit/loss? i can see the daily results, but there was some change of position sizes, etc.
Hi tingtong, Happy New Year to you too!
I always enjoy a good discussion about trading, thanks for all your ideas.
“Autopilot” is just my cutesy way of saying that I left the platform and set limit orders. Normally I trade at-the-market for everything, but when my time runs out, I must either close trades or enter limit orders. I really do not like leaving trades open like this but so far I have had decent success with this. A perfect day would be one where the trades just naturally reach conclusion by the time I need to stop.
Trend bias… well, the reason I only trade with the identified bias is based on an earlier finding (if you look back in the early days of this journal)… where I found that taking trades only in one direction tended to provide a higher success rate. That is the only reason I have continued to do this.
Please tell me more about your sentiment trading. Sounds like the idea has a lot of merit, I would like to try it out. Where can I get a sentiment reading?
Lastly, I do prefer a more mechanical approach. As I understand, successful trading is supposed to feel “boring” … because you just execute the same thing over and over and hopefully reap the same consistent rewards over and over. It would be great if I could find this and continue reducing discretion.
I do not keep track of running totals right now – they are not important to me at this stage. However MyFXBook does do some cumulative analysis like this, and they even allow you to pick a custom start date. In that way, you can see how a recent change to rules, for example, would affect the consistency rate.
The position sizes I use are (supposed to be) calculated each day before I start. I am currently using a ratio of 250 units per $50 of equity. This figure is just something I came up with over time that seems to work well.
THANKS
hi Dusktrader,
so, just like me, you enjoy a good chat about trading?! 
well, chatting about trading doesnt mean i wish to change in any way about yours…not even necesserily that my trading is better…only to share some ideas.
i think i should probably make some charts and attach to show a bit what i am doing. as i keep saying it is part very similar to your trading, and part very different, as i seem to scalp against the very short term trend, what i said vs. the sentiment.
there is plenty indicator to gauge this, i mentioned that for some reason i found that for me RSI works the best, with slightly different way i use than most site mention it, as well a bit different approach. of course i also have a set of exceptions when i disregard it, as well as the mentioned support/resistance lines and candles.
lately almost exclusively trade from 5 min chart, and time it if needed on the 1min…sometimes for support areas look for 1H, but rarely above, scalping is scalping, dont really find it useful those larger timeframes much, so, i like that you also try to decide your supports mostly on the 15 min TF…
one could use stochastic also ( and many others) to determinate the market sentiment, ie oversold or overbought conditions, but i found before that stoch is too sensitive and less reliable. just as RSI has to have time to disregard too, especially those low volatility times, or at important news releases need to have some other confirmations.
also mentioned before that i have a rather mechanical system now to scale the position, remember, i was suggesting that you do watch out how you pace your position, disregard of the spread, it does pay often to slow a bit in scaling, and see how things work out…all said, i scalp, and i prefer to be out of any position within minutes,and really start to feel bad if i am still into a trade after 15 min…getting impatient, i guess.
so what i meant vs trend is that on such low timeframes trends kind a matte less, especially while scalping, and looking rather some smaller unusual moves to counter them for a quick profits, or once in a while maybe a breakout…
agree, that after a while trading gets a bit boring, but as long as it makes money, it isnt, and i would say around 10% of the positions still give some excitement, due larger than preferred size, drawdowns.
about the running total: i think it does matter. while your days seem to be like 80-90% success, it matters to see how much the occasional larger DD takes out from the grand total, and maybe work out a smaller SL, or such to limit this.
I personally would try to avoid the autopilot also, as much as possible, and pull SL much closer, or if possible around even before leaving. i knowsometimes must go, but if possible to avoid the unknown, best to do that.
i always say: the least time exposed to the market is the best, while trading forex.
PS: if not lazy once, i will make some screens.
Tuesday 1/4/11
Quick stats:
9 trades
Trend bias taken from the 5min PSAR (0.03, 0.3)
Trades with 5min trend bias: 9 wins, 0 losses
Trades against 5min trend bias: 0 wins, 0 losses
2.0820% account change
Today the market actually started to feel more “normal” … I’d say since about Thanksgiving. The spreads were also normal for most of my trading time. But in general, the movements felt more fluid and less jerky, which I like.
So far I am pretty happy with the PSAR as an indication of current bias. But I’m still struggling with how to use this, if at all, for stop management. I’ve noticed on more than one occasion mid-trade that PSAR can be breached, only to find price whip back around and continue. For this reason, I have not exited trades at a loss in many cases. This could mean that I need to take another look at the PSAR setting, perhaps it’s too tight and needs tweaking? Or maybe I just can’t use this for a dynamic stop. I dunno yet.
Hi tingtong,
its great to know someone else who trades a similar way. Do you trade lower than the 5min chart or no? I like it fast and furious so that’s why I’m trying to build something with the 30sec noise. I’ve heard of some people even having success at smaller timeframes than this, but personally I’m scared to do that mostly because of my internet connection speed right now.
Btw, MyFXBook says my average trade length is 1 minute, that sounds about right.
Yes feel free to attach some of your charts, that would be great. Would help to explain things a little better. What I do is use Google Docs Drawing to upload my chartshot and then I can overlay with words and arrows. When done just download as PNG image.
So it sounds like your definition of “sentiment” is almost the same as my definition of “trend”… how are they different? Seems like sentiment is a subjective gauge of market bias which you are gathering from an indicator. I think I am doing the same thing but just calling it a trend bias. I am currently using the 5min trend bias to choose the trade direction on the 30sec chart. It could be that these are still mis-matched and that it would be more appropriate to use something like the 1min trend bias with 30sec chart. I’m trying to avoid having the indicator on the trading timeframe (ie 30 sec) because I don’t want to be influenced to take trades by the indicator itself.
As far as indicators go, I think you are definitely doing the right thing when you say you use it a different way than most others. One of the most valuable lessons I learned from my mentor (few years back) is that when studying an indicator, you should always try to view it with a completely open mind. Everyone sees something different, kindof like a rainbow I suppose. Why would you want to risk skewing your mind’s interpretation by studying someone else’s description of what it’s “supposed to do”? We each have a genius mind and that mind is capable of making the necessary connections without our conscious brain trying to “teach” it booksmarts. When I go to study a new indicator, the procedure I try to follow is to first get a general understanding of what the author purports to display with his calculations. But beyond that, I do not pay attention to statements like “most traders will use the green line crossing the blah blah” or “take a long entry when blah blah”… instead just watch the indicator, absorb how it behaves and what indications, if any, could be deduced as it unfolds alongside pure price action.
In many cases, I find that indicators are too subjective and don’t tell me anything concrete. Sometimes they create more questions in my mind than answers, and I really don’t like that. I do prefer indicators like PSAR that give a solid indication (green and red squares) rather than a squiggly line, for example.
As far as my supports… currently I draw them on: Daily, 3hour, 1hour, 15min, 5min, 30sec timeframes. I would say the most reliable ones are: Daily, 1hour and 15min
Yes I’m in agreement about being patient with scaling. I’ve tried to do this and it works well. I am still restricting myself to a max of 3 legs per trade.
The reason I don’t place a lot of emphasis on the running total right now is because the trading method itself is still molding. There are still issues that must be worked out before I can commit my full trading stake. I would like to see the issues resolved and the method become a little more mechanical and less discretionary. I want to prove this to myself through consistent results day after day.
Wednesday 1/5/11
Quick stats:
11 trades
Trend bias taken from the 5min PSAR (0.03, 0.3)
Trades with 5min trend bias: 11 wins, 0 losses
Trades against 5min trend bias: 0 wins, 0 losses
1.7180% account change
The market really seems back to normal now, it behaved very well today! I’m looking forward to smoother sailing…
Thursday 1/6/11
Quick stats:
7 trades
Trend bias taken from the 5min PSAR (0.03, 0.3)
Trades with 5min trend bias: 7 wins, 0 losses
Trades against 5min trend bias: 0 wins, 0 losses
1.0928% account change
I’m strongly considering the idea of scalping in a sub-account during times when I am stuck waiting on a scaled trade to come to fruition. There seems to be a lot of opportunity loss when the market is ranging like it did today. I’m on the fence as to whether this is a smart idea or not. On one hand, I do not like to enter stop or target orders because I’m undecided if I believe in stop-hunting or not. If I wasn’t paranoid about that, then I could just enter limit orders and resume normal scalping in the sub-account. If I did this, I think I would trade with modified rules. For example, I would need to possibly limit stops and targets… say only 2 pip target trades (vs. logical levels that I sometimes look for) and definitely take more losses vs. scaling. I just feel really unproductive when I’m sitting twittling my thumbs waiting for a scale trade like today.
What do you think? Good idea or bad? Has anyone ever done this before?
Hi, first of all thanks for this very informative thread.
I had a few questions about the scalping day above, and about your method more generally.
To begin, I would like to know when you consider a trendline to be broken. Say, on the trading day that I quoted, there are two red trendlines that correspond to daily trends. Now, you said that “i won’t change bias unless price moves abve the upper bound”. And I can see that once I did, you first trade was actually short (while the trend apparently changed from upwards to downwards). And at that time, the price was way above and a few candles past the upper trendline.
Also, I did not really understand when are you entry and exit points ; what is autopilot ; what are breakeven teasers (and how to recognize them) and how do you get those “circled arrows” indicating actual trades on oanda (I only get the arrows !).
Thank you for your clarifications !
Hi martin, thanks for taking an interest in my journal. Some things with my trade style have been tweaked since the day you posted 12/10, but let me see if I can answer some of your questions:
About trendlines being broken… I see how what I’ve written in that chartshot is confusing. On that day, there were two major Daily trendlines. The one you see is the lower bound of the two (the horizontal line you see at 1.3250 is a psych level, not a trendline). I mentioned that I would shift my bias to upward only if the UPPER trendline were broken. I would consider a broken trendline to occur when price breaches it and stays above it. I am somewhat vague on this because most of my trading strategy does not care about breaking trendlines. In many cases I see price dance around outside a trend boundary, only to come back and continue its former channel. In this one specific case, however, I considered the Daily trendlines to be very major and at that time I based my trend bias on these larger-timeframe trends (I no longer take my bias in this way).
Btw, on this trading day, all trades taken were shorts, so I did not change the trend bias at all during this trading session.
My entry and target points are discretionary. Generally speaking, I am fading the resistance levels. I draw a lot of trendlines in a gridlike fashion, so there are lots of areas of resistance to work with. I am always “fading” the movement, which means I enter the market in the opposite direction that it is moving presently. In the case of this day, I will enter when price rises to a resistance area that forms a pattern I like. The entries are easy to spot on my charts because they are the only Oanda blips that do not have circles drawn around them.
“Autopilot” is just my terminology to say that I left the trading platform and entered limit orders. I have to jump in the shower at ~7am so usually you will see these near the end of my trading window if a trade is still in progress.
“Breakeven teasers” occur when you are in a trade that has moved against you… very frequently, price will move up just to kiss the breakeven point, but then retreat again. This happens so often that I actually look for / expect them now. Price action takes a breather as it moves to recover the loss and reach for the target level. But, I think psychologically, a lot of traders in similar positions will freak out and they are happy just to get out of the market at breakeven. I think this is why price pauses and retreats at this level. With a little patience, it will usually come back and continue onward to the target level. I like to point-out the breakeven-teasers because they are so frequent and obvious to me. (By the way, on Oanda platform, there is something called the “average position line” – while in trade, the platform puts a horizontal line at the breakeven point, so you can easily see where breakeven is in relation to your target level.)
The circled arrows… those are things I added myself. What I do to markup my chartshots for journal is as follows:
Hope this helps clarify!
great reply, thank you. Have noticed how subjective your method is (especially in determining trends on higher TFs, placing adequate R/S…)
An issue I must have forgotten is about take profits and stop losses. I can infer that you take profits right before the next R/S level is hit (relating to your grid), but what about stop losses ? In an earlier post, you pointed out the possibility of SL hunting, so I guess you use mental SLs. Do you wait for the next R/S level too once you have entered a losing position ? In that case, there are 2 possibilities :
Also, to determine a trend :
Thanks again  Some of my questions can be pretty basic, but I think they are essential for starting traders… and even experienced ones as everyone has something new to bring on to the table
Happy scalping
As far as targets go, I’ve toyed with 2 different methods and I do still flip-flop around a little bit. The first method is to identify a target level, usually an upcoming trendline I’ve drawn. The other method is to simply watch the pips-in-profit and get out when it hits 2 or 3. I go back and forth about which one I like better… but it also has to do with my feelings about how the market is behaving that day. If I feel defensive, such as times when the market is jerky, I will usually go with the 2-3 pips only. If it is slow and methodical, I love to get a long run of 5-10 pips. For scaled trades, I almost always exit around 3 pips beyond the average position line. These trades carry much higher leverage and I’ve learned not to be greedy with them. 3 pips beyond avg position line is actually a very nice profit on those.
Regarding stops, this is an area that I still struggle with and have yet to define something I’m totally comfortable with. I do not like to take “calculated stops” but I will if I’m forced to. I would rather look at the chart and find a logical stop, based on the price action / channels / swing high,lows / etc. However, the possibility of stop occurs so rarely that I really do not have enough experience to perfect this yet. I am hoping that if I get enough screen-time (and perhaps if I get BURNED enough times) that I will finally nail down a solid plan.
For trades that go out of control, I’ve pretty-much adopted a 5% equity loss max. This reached 10% on a bad trading day in late December, but I’m not happy with that. In my mind 5% is plenty enough to tell me when I’m wrong. Having said that though, I would much prefer a better plan still – because even 5% could erase an entire weeks worth of good trading.
(Bottom line – stops are broken – they need fixing)
Also, to determine a trend :
- which TFs are the most suitable ?
I used to look at the 15min trend but I no longer do this, it’s too subjective. Currently as of January, I am using PSAR (0.03, 0.3) on the 5min chart. I am still trying to figure out the best way to use this information. When I get ready to place a trade, I first look at the current PSAR reading – it’s either long or short. So it’s possible that, using this method, I could trade both long and short in the same session.
- supposing, say, the 15 minutes is in a downtrend but approaching a support line, what would you do on the 1 min TF for scalping ? long or short ? (once it has actually “touched” the line ?)
In this particular case, the trend is very uncertain so how to choose a way ?- Sometimes different TFs give different trends… quite confusing
This is exactly why I stopped attempting to predict the trend bias. My philosophy is that the scalping method can work in ANY trend condition, albeit more difficult trading if I’m against the trend. Using PSAR gives me an objective reading about the current 5min trend, which I have found to be relevant on the 30sec chart. In other words, I can trade with and against the trend… but I’d much rather be with the trend, it’s a lot more forgiving.
Thanks again
Happy scalping
No problem! Thanks for your questions, it helps me also to justify reasoning in my own mind sometimes.
hi
since your scaled trades are themself about scalping timeframe, i would tend to suggest against having a sub account for more scalping…
remember, there is a phrase where i come from: can ride on one horse a time with one ass
if anything you must add, maybe some longer timeframe daytrades with bit smaller positions might be a way to experiment, i am sure sometimes you see stronger moves than another, and i believe often the reversal is just as forceful, and might be good to be in for a bit larger potential profit (in pips term).
Also for most case i made a rule not to scalp/scale trade more than 1 pair a time, the few exceptions when the technicals change and i do the next scaling on a highly correlated pair…
PS: for the Jan 6 trades entry this comment, i see a few posts got between.
Friday 1/7/11
Quick stats:
4 trades
Trend bias taken from the 5min PSAR (0.03, 0.3)
Trades with 5min trend bias: 4 wins, 0 losses
Trades against 5min trend bias: 0 wins, 0 losses
0.6075% account change
The market was a bit choppy today. This could also be seen in the 5min PSAR, it was whipping back and forth a bit. I considered changing the PSAR setting but then decided price was actually not really trending, so the whipping around was accurate. I still feel like PSAR is helpful. My philosophy is that the trend identification is not CRITICAL to my success, only very helpful. So even in whipsaw times like today, I can make it work.
Monday 1/10/11
Quick stats:
5 trades
Trend bias taken from the 5min PSAR (0.03, 0.3)
Trades with 5min trend bias: 5 wins, 0 losses
Trades against 5min trend bias: 0 wins, 0 losses
1.7050% account change
Tuesday 1/11/11
Quick stats:
3 trades
Trend bias taken from the 5min PSAR (0.03, 0.3)
Trades with 5min trend bias: 3 wins, 0 losses
Trades against 5min trend bias: 0 wins, 0 losses
1.3053% account change
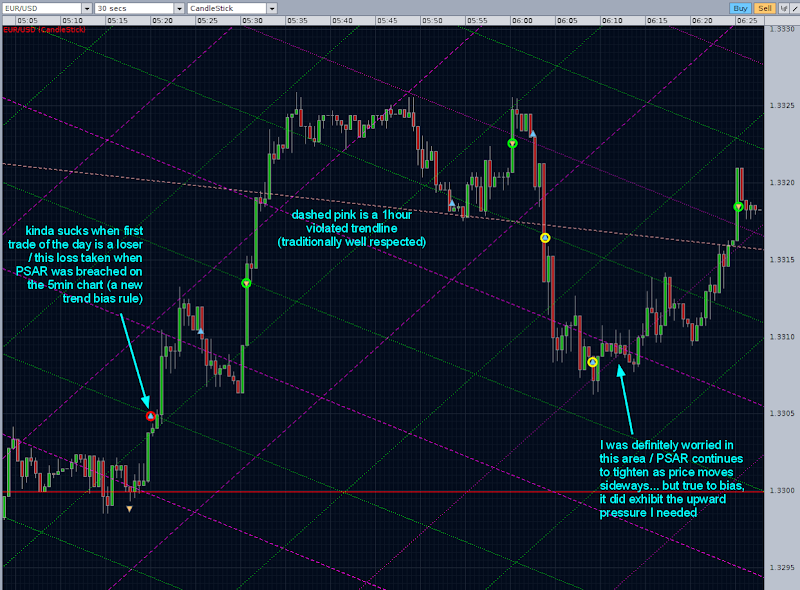
Decent trading day but greed got in the way a bit… had I not been stuck so long in that scaled trade, I could’ve probably scalped many more times today.
it is easy to be smart in aftermath, but here is a thought:
i think between your 2 arrows ( greedy part) when the price set after the entry a new higher high and higher low after, the next move down i would be happy to bail out, there would be clues for me that chance to get my bigger profit might just slipped some.
(referring to your chart around 6:25-6:30).
such cases i am happy to take less and wait for another opportunity.
[QUOTE=dusktrader;… had I not been stuck so long in that scaled trade, I could’ve probably scalped many more times[/QUOTE]
This is why I am suspicious of scaling outside the calm hours where price action might be ranging. Scaling works well then, but oh boy when you get a break-out in the wrong direction, you will be paying in stress or cash!
I am training myself to take losses instead of scaling, you can take a lot of small losses for one 2% loss of account due to scaling. It will also force you to take only highly probable trades, instead of 50/50% trades that could be justified with the option of scaling.
But the main reason remains the opportunity cost of lost scalping trades while you are waiting for a scaled trade to close in profit (or big loss).