Alright, trying this out. Looking for a buy opportunity on the daily chart, most likely Tuesday, on GBPUSD:

4H is showing that it could hit 62 level first:

Have a great weekend!
Alright, trying this out. Looking for a buy opportunity on the daily chart, most likely Tuesday, on GBPUSD:
4H is showing that it could hit 62 level first:
Have a great weekend!
Here How!
1st After taking entry i go down to h4 and then break the fibbo down to 2 parts and the 50% point of that is my tp-1
once hit trade BE (Break even) 50-80% position closed.
Because Its not always the market gonna hit full tp. but believe me if you are right the the 50% is hit like 80% of the time.
Regards.
Hey…
Looks good But in these examples your fibbonacci is drawn a little bit off.
I wouldn’t draw it like that.

This is how you should do it.
also an example of how to use Fibonacci for your first (TAKE PROFIT)
50% maybe above. I wait for rejection candle after an stop hunt…
Regards.
mmm, so what your saying is you make the rules up as you go to suit.
Not a good way to go. Here’s my take.
I would have closed out both trades taking profit. My statistical analysis of their respective weekly candles would indicate there is an approximate 92% chance of the price retracing at least 10pips from this weeks close. This leaves an opportunity for a better entry at some point next week if the current structure holds true. Tech analysis is good to help identify trade opportunities but only statistical analysis open the door for potential returns.
Having set targets to TP is a sure-fire way to blow ones account. You have to manage each and every trade on its merits.
Hi @Amarsaleem, @MattyMoney, I don’t think I explained the strategy with enough detail… When I applied the Fib. R, I didn’t take any notice of the Fib. levels…
I only concentrated on adding the “Join” across the structure as a trendline (Candle Bodies preferably).
I also concentrated the trendline on first 50% of the structure… because effectively the second 50% has not yet painted… This technique gives the strategy more merit… Anyone can lay a trendline across the whole structure… I attempt to develop and code predictive strategies… not reactive…
When the levels aligned with reversals and congestion points, this just gave me some confirmation that more was going here than a simple Fib. R overlay… I hadn’t noticed before.
I hope this makes sense and helps other posters taking an interest in this thread.
Hey @therealInsideBar, the perfect way to apply some risk management and gain some extra pips, especially when applied on each and every trade.
I’m pretty sure I get what you are doing. Price keeps coming back to your Fib Join Line, essentially predicting its next move.
It’s tough to ignore those fib levels though (you’ve even added 2 new levels on this chart that I did not see on your previous charts). Price is hitting the fib levels very accurately, it’s almost scary!
Then out of curiosity, why not just draw trend lines? Take GBPUSD and look a the 2H view, I see a channel that can be used to predict when price could reverse back to the “join/trend” line. The support line for this channel would have been confirmed Oct. 14th at 3AM (EST), resistance line long before then:
Maybe I’m getting it, maybe I’m not…maybe I’m overthinking it. But one thing is certain, using the join line as a trend line in combination with the fib levels certainly worked well with this one.
I will keep following.
Hi @MattyMoney, those other Fib Levels were always there, just outside of the Chartshot…
I have never really used the Fib. R or Trend Lines so I’m not a true believer in the Indicators themselves… But as you have pointed out Price Action does seem to be activated at Fib Levels… often enough that cannot be just a coincidence?
I have Algo’s that drop pending orders every x amount of pips behind PA as it moves away from the Fib Trend, so when price eventually retraces back to the line it Pyramids multiple positions where it performs a < Close All > on contact with the Trend Line… hence my mention early on of the dynamic nature of the “Join Line” level. If price continues to move away ie: change trend… no damage done…
I haven’t demonstrated it here as I just wanted to show the simple strategy that popped out of the charts on @Amarsaleem OP…
Algo’s I have been developing of late don’t use indicators at all… with the substantial backtesting of many, many I have done over the last 18 months… I have realised that certain candle structures when formed, defeat most indicators… It would be good if BP had Video capability, I could demonstrate this behavior.
Well, Yes they have…
Just Hope onto YouTube record a video and submit the short link here on the reply.
Maybe I will try to record an explanation as well.
100%, there is a lot of information in just 1 or 2 daily candles. Since paying more attention to inside bar strategies, such as the Harami Inside Bar Breakout strategy John has laid out on his website, I now scan my charts for daily bars with very little momentum, and wait for a breakout in either direction. There is almost guaranteed to be one. Apply that concept with any strategy and your chances of making some money are increased.

@Amarsaleem, sorry for taking this thread a bit off topic.
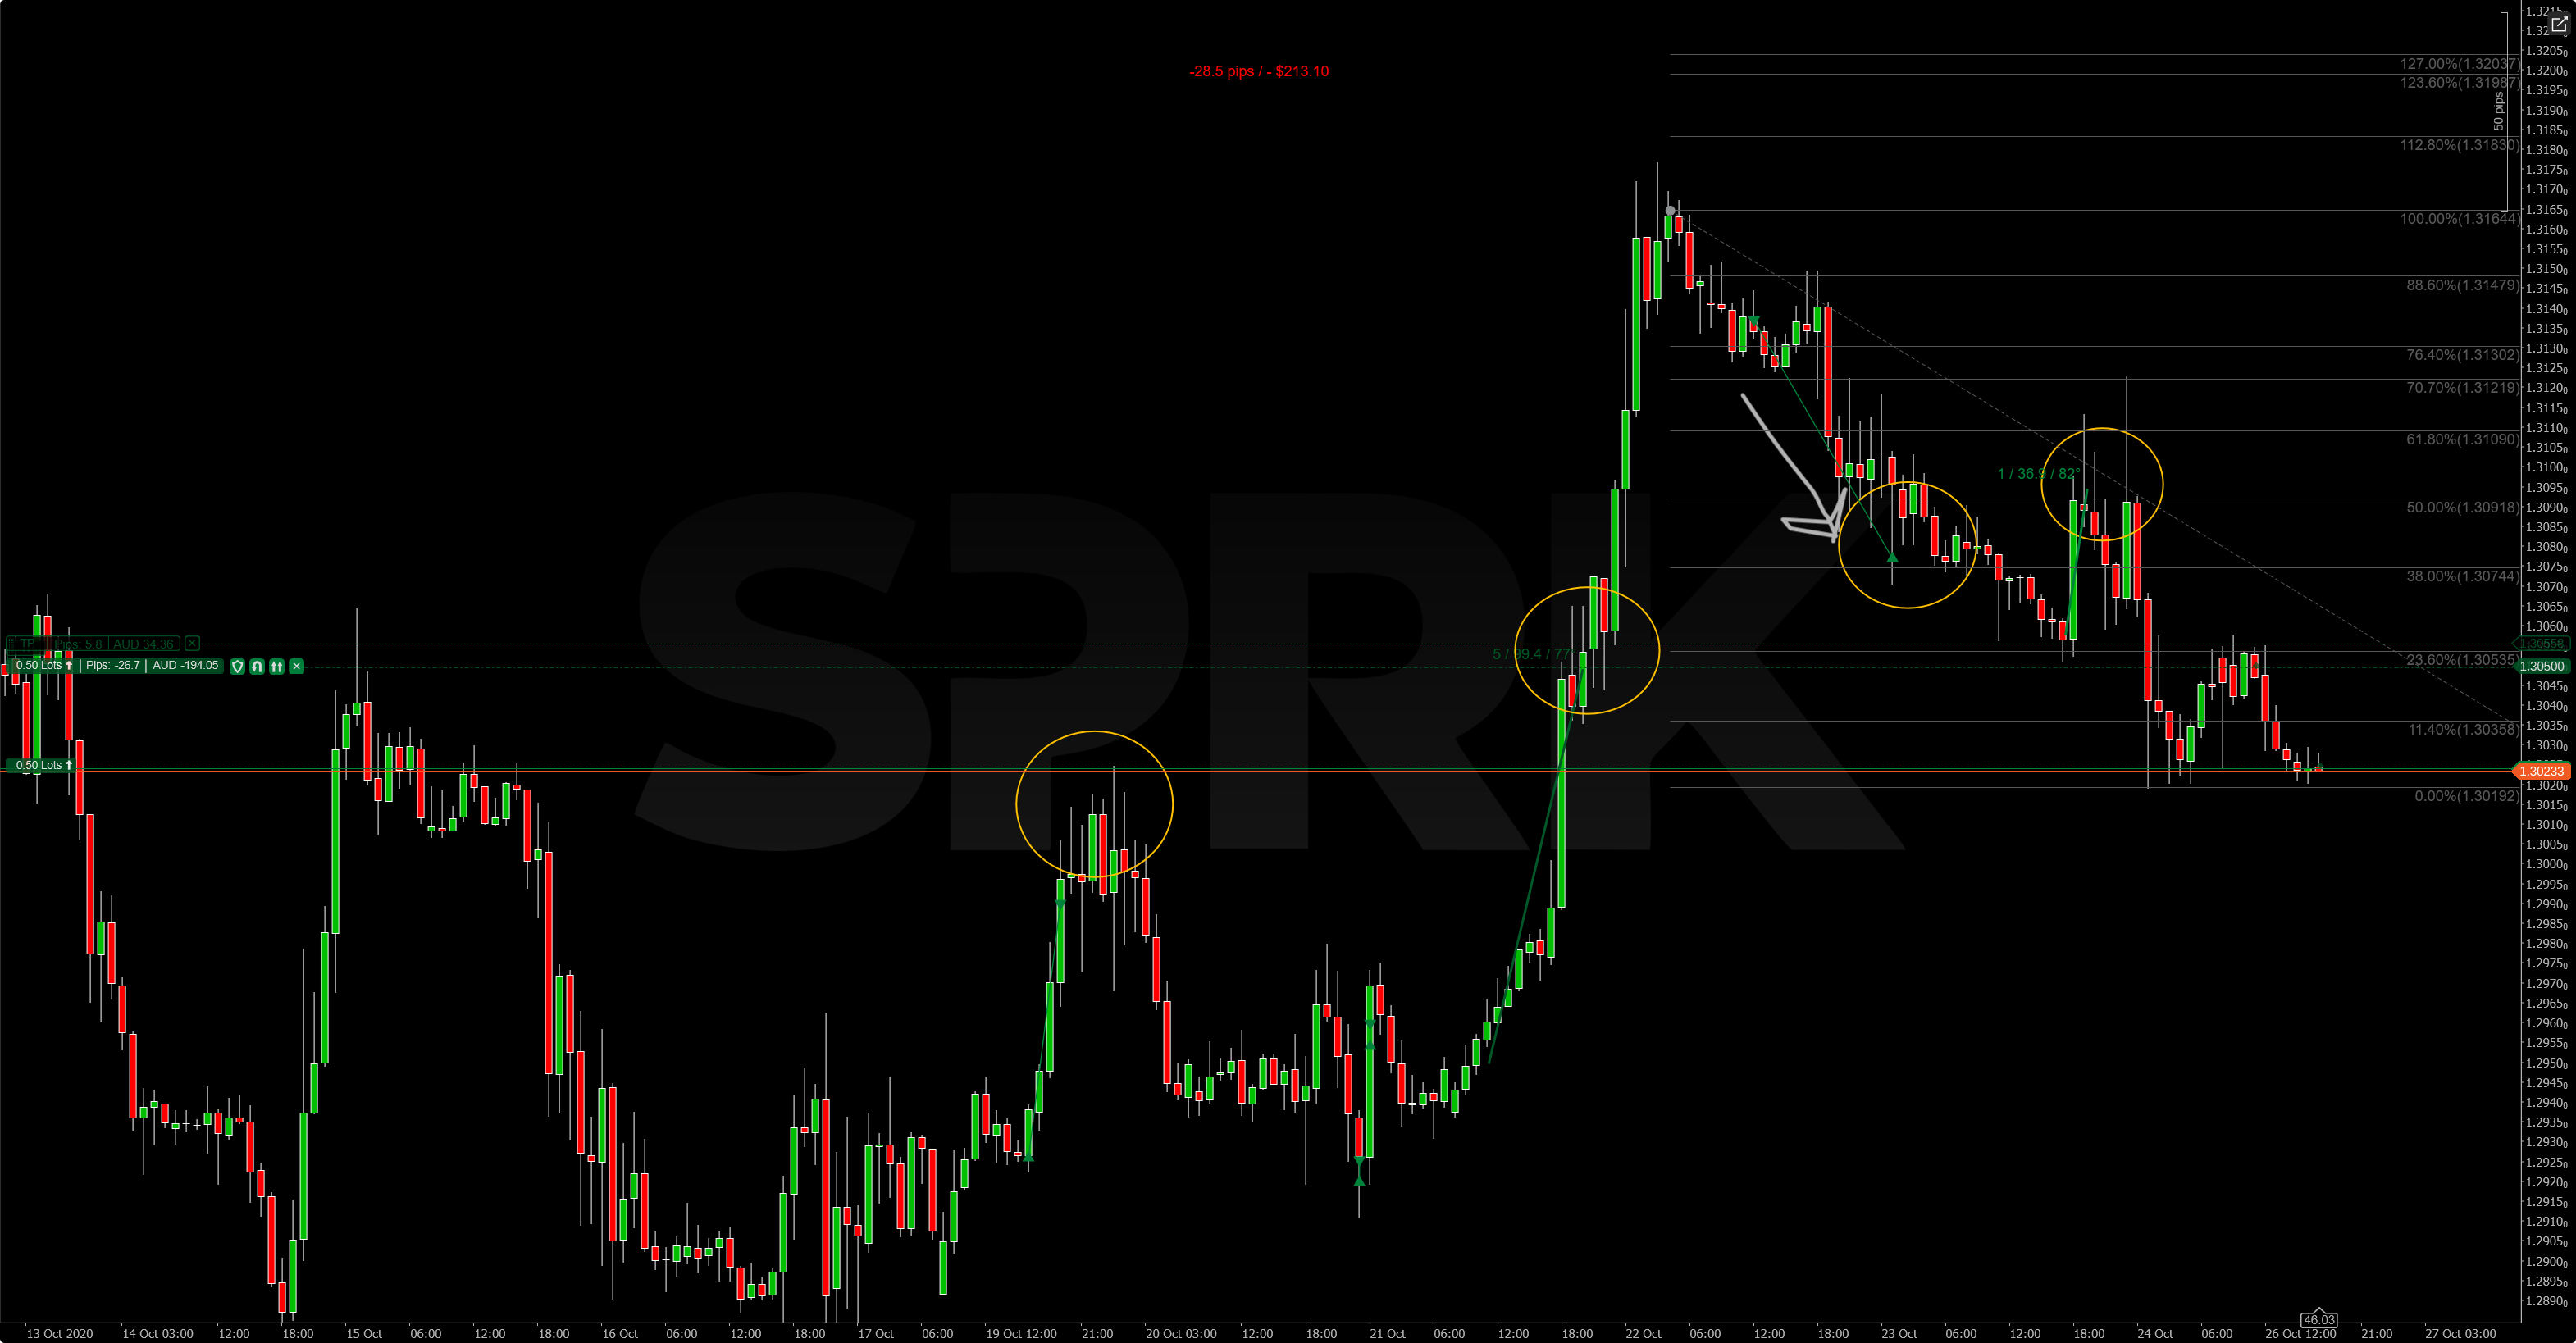
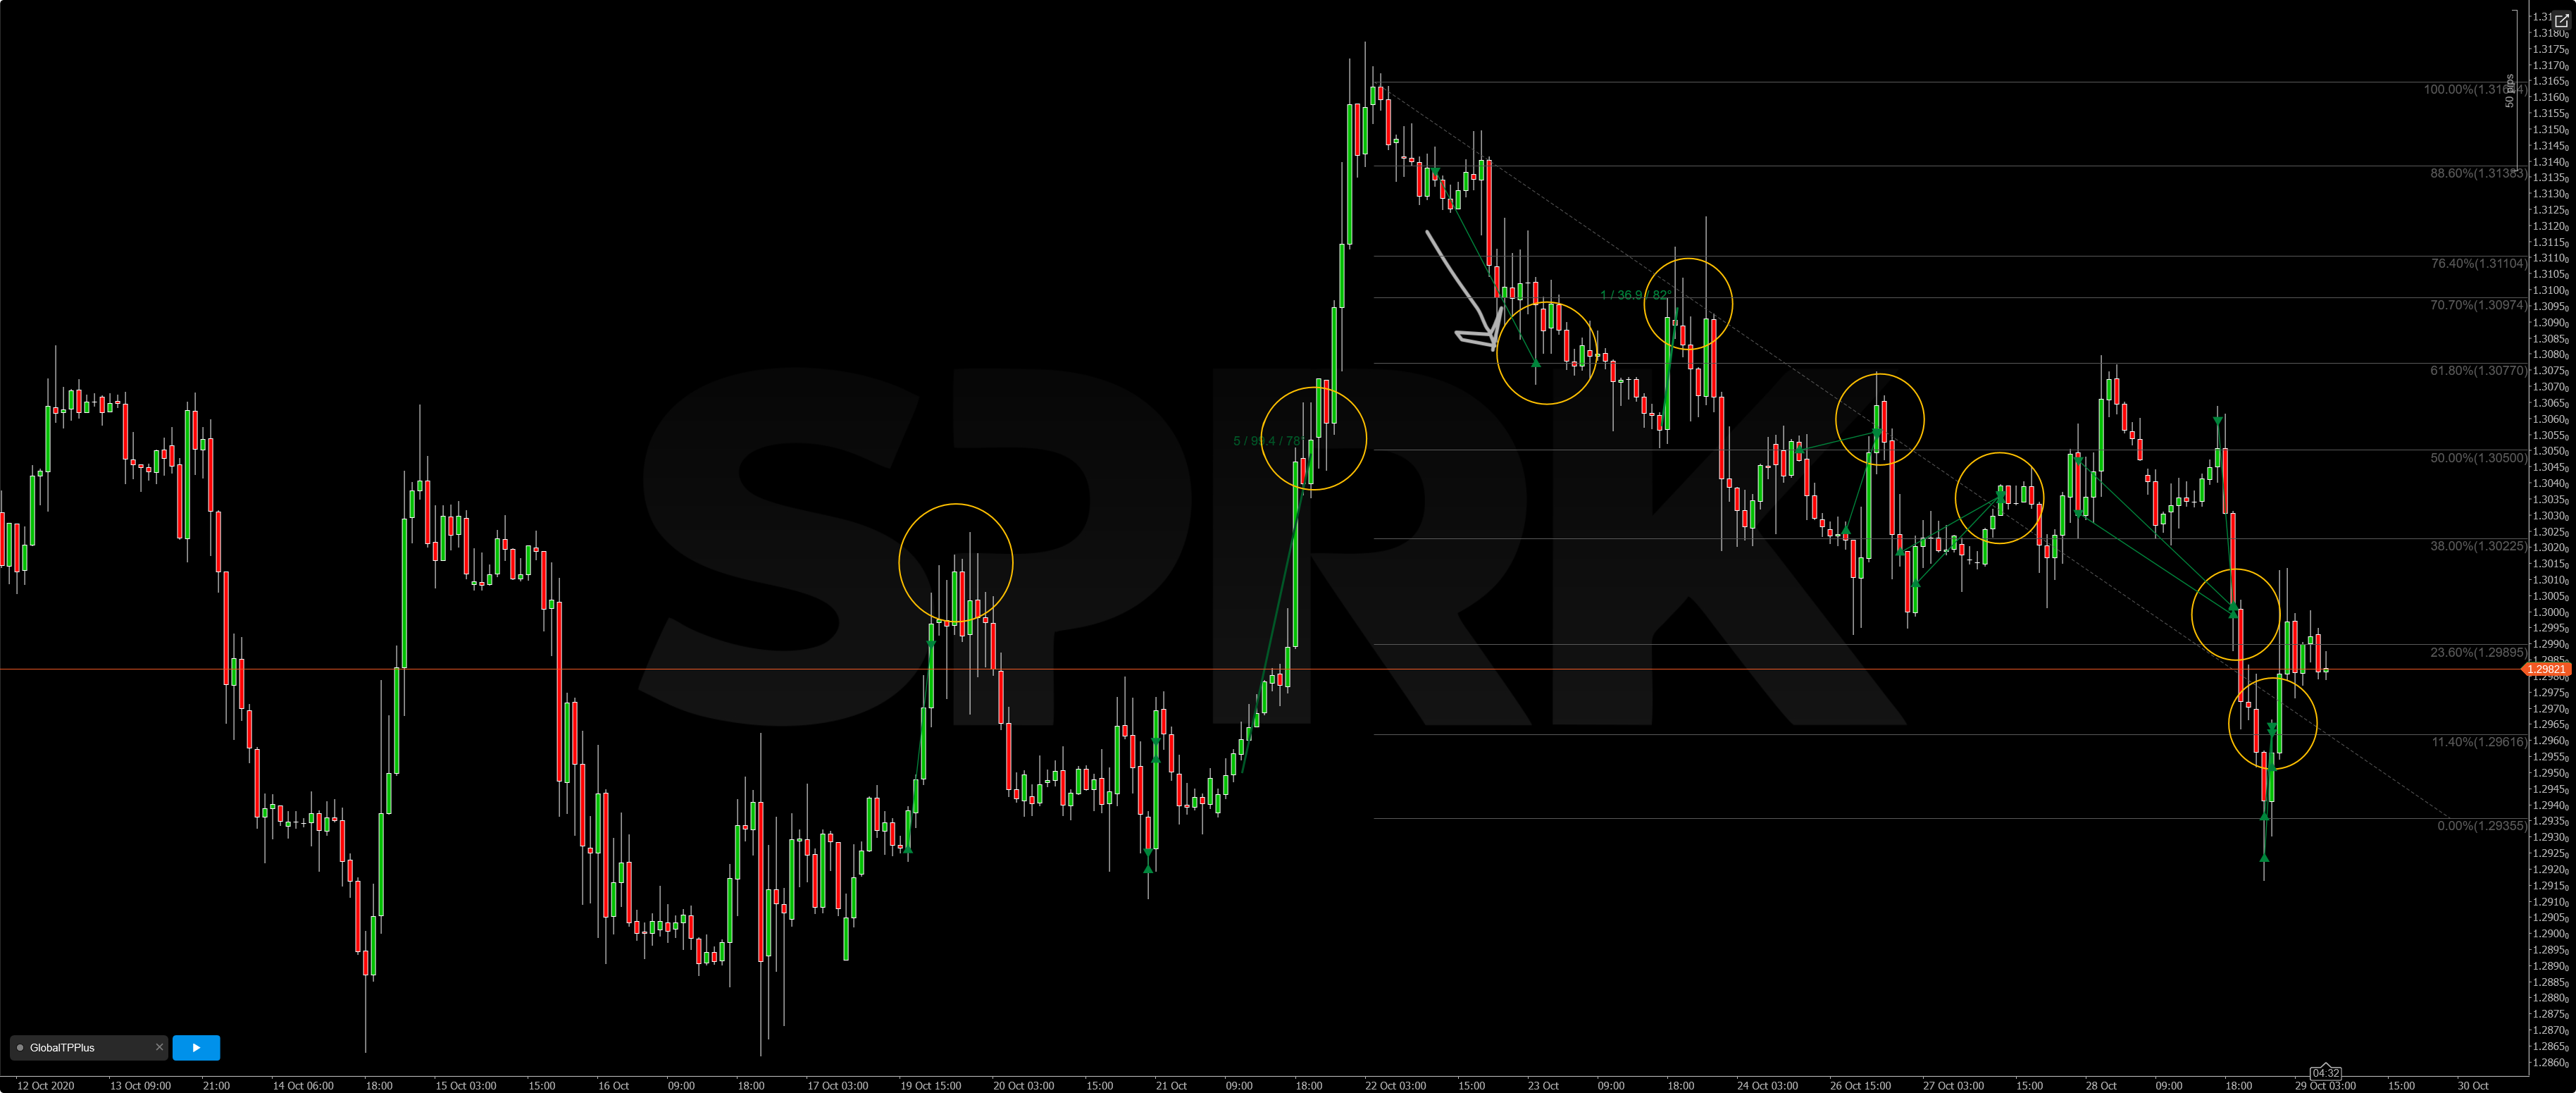
Snaps back yet again… another trade using arbitrage and the F-R as a trendline and double pyramid positions…83+ pips…
That’s just so unbelievable … what… 5 times in a row… even on a change of trend…
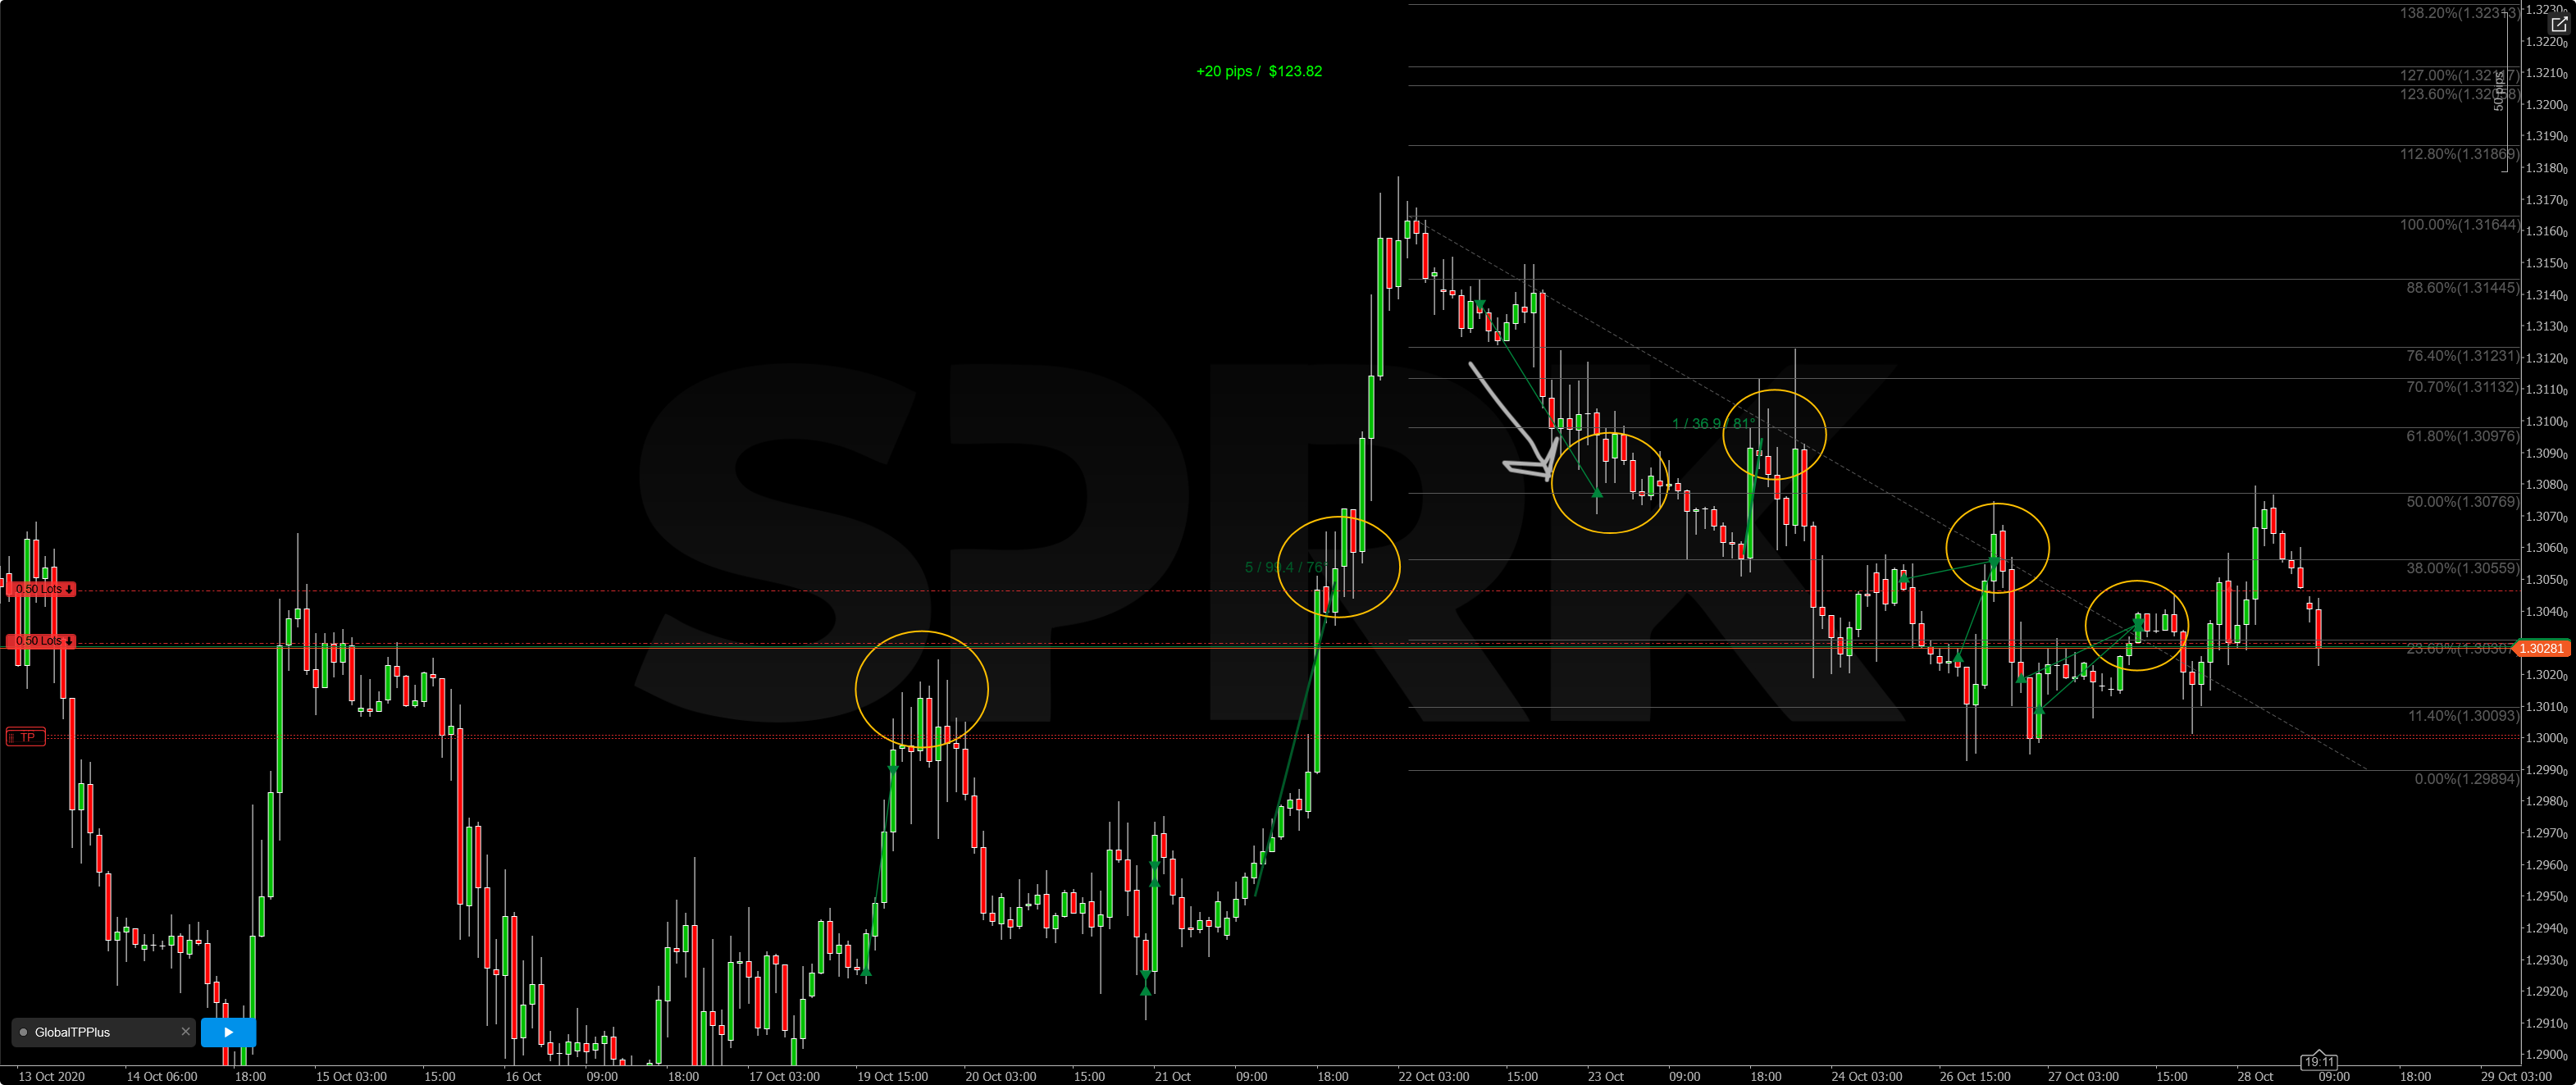
Snaps back again… it’s getting boring how accurate this simple, simple strategy is to apply.… Just using a bit of arbitrage theory and the F-R as a trendline with double pyramid positions…61+ pips…
6 times in a row… I honestly don’t know what the rest of you are doing wrong…
Great to see your using IBs more often.
Frankly I think most people’s problems are firstly their strategies are far too complex and secondly (though I know I harp on about it far too much) is this obsession with small timeframes.
I don’t believe it’s where the best risk reward or reward per time employed are.
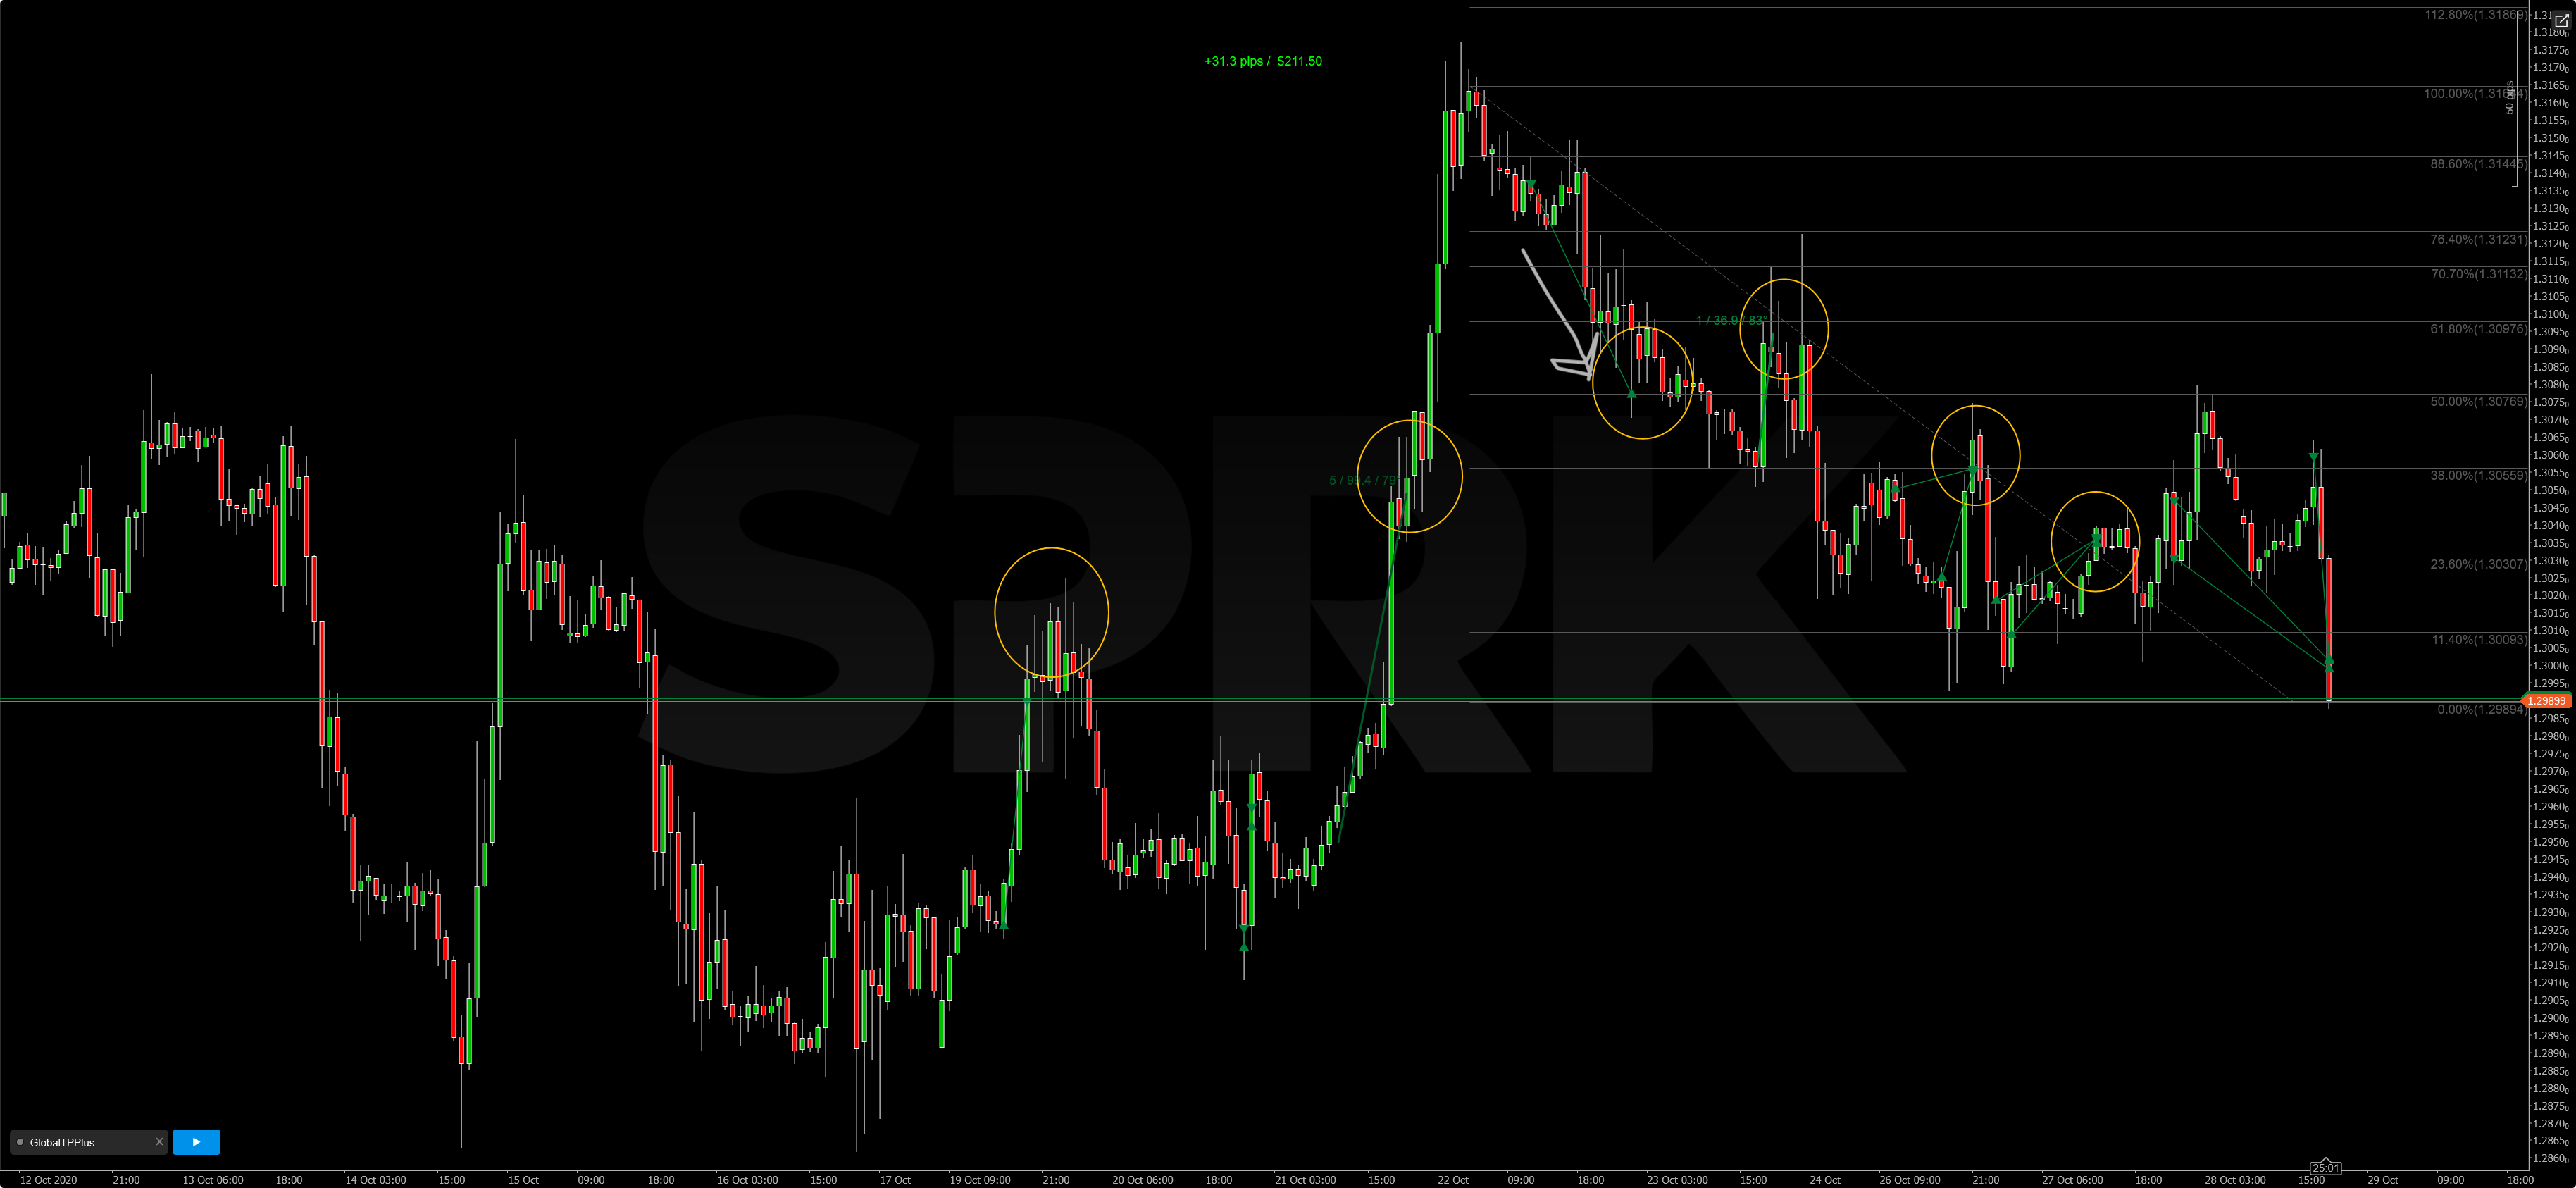
Triple Pyramid positions…106+ pips…
GBPUSD 1 Hour (9.00pm UTC +11) 28-10-2020
For the majority who cannot take a simple strategy and make a Profit… All trades match the charts…
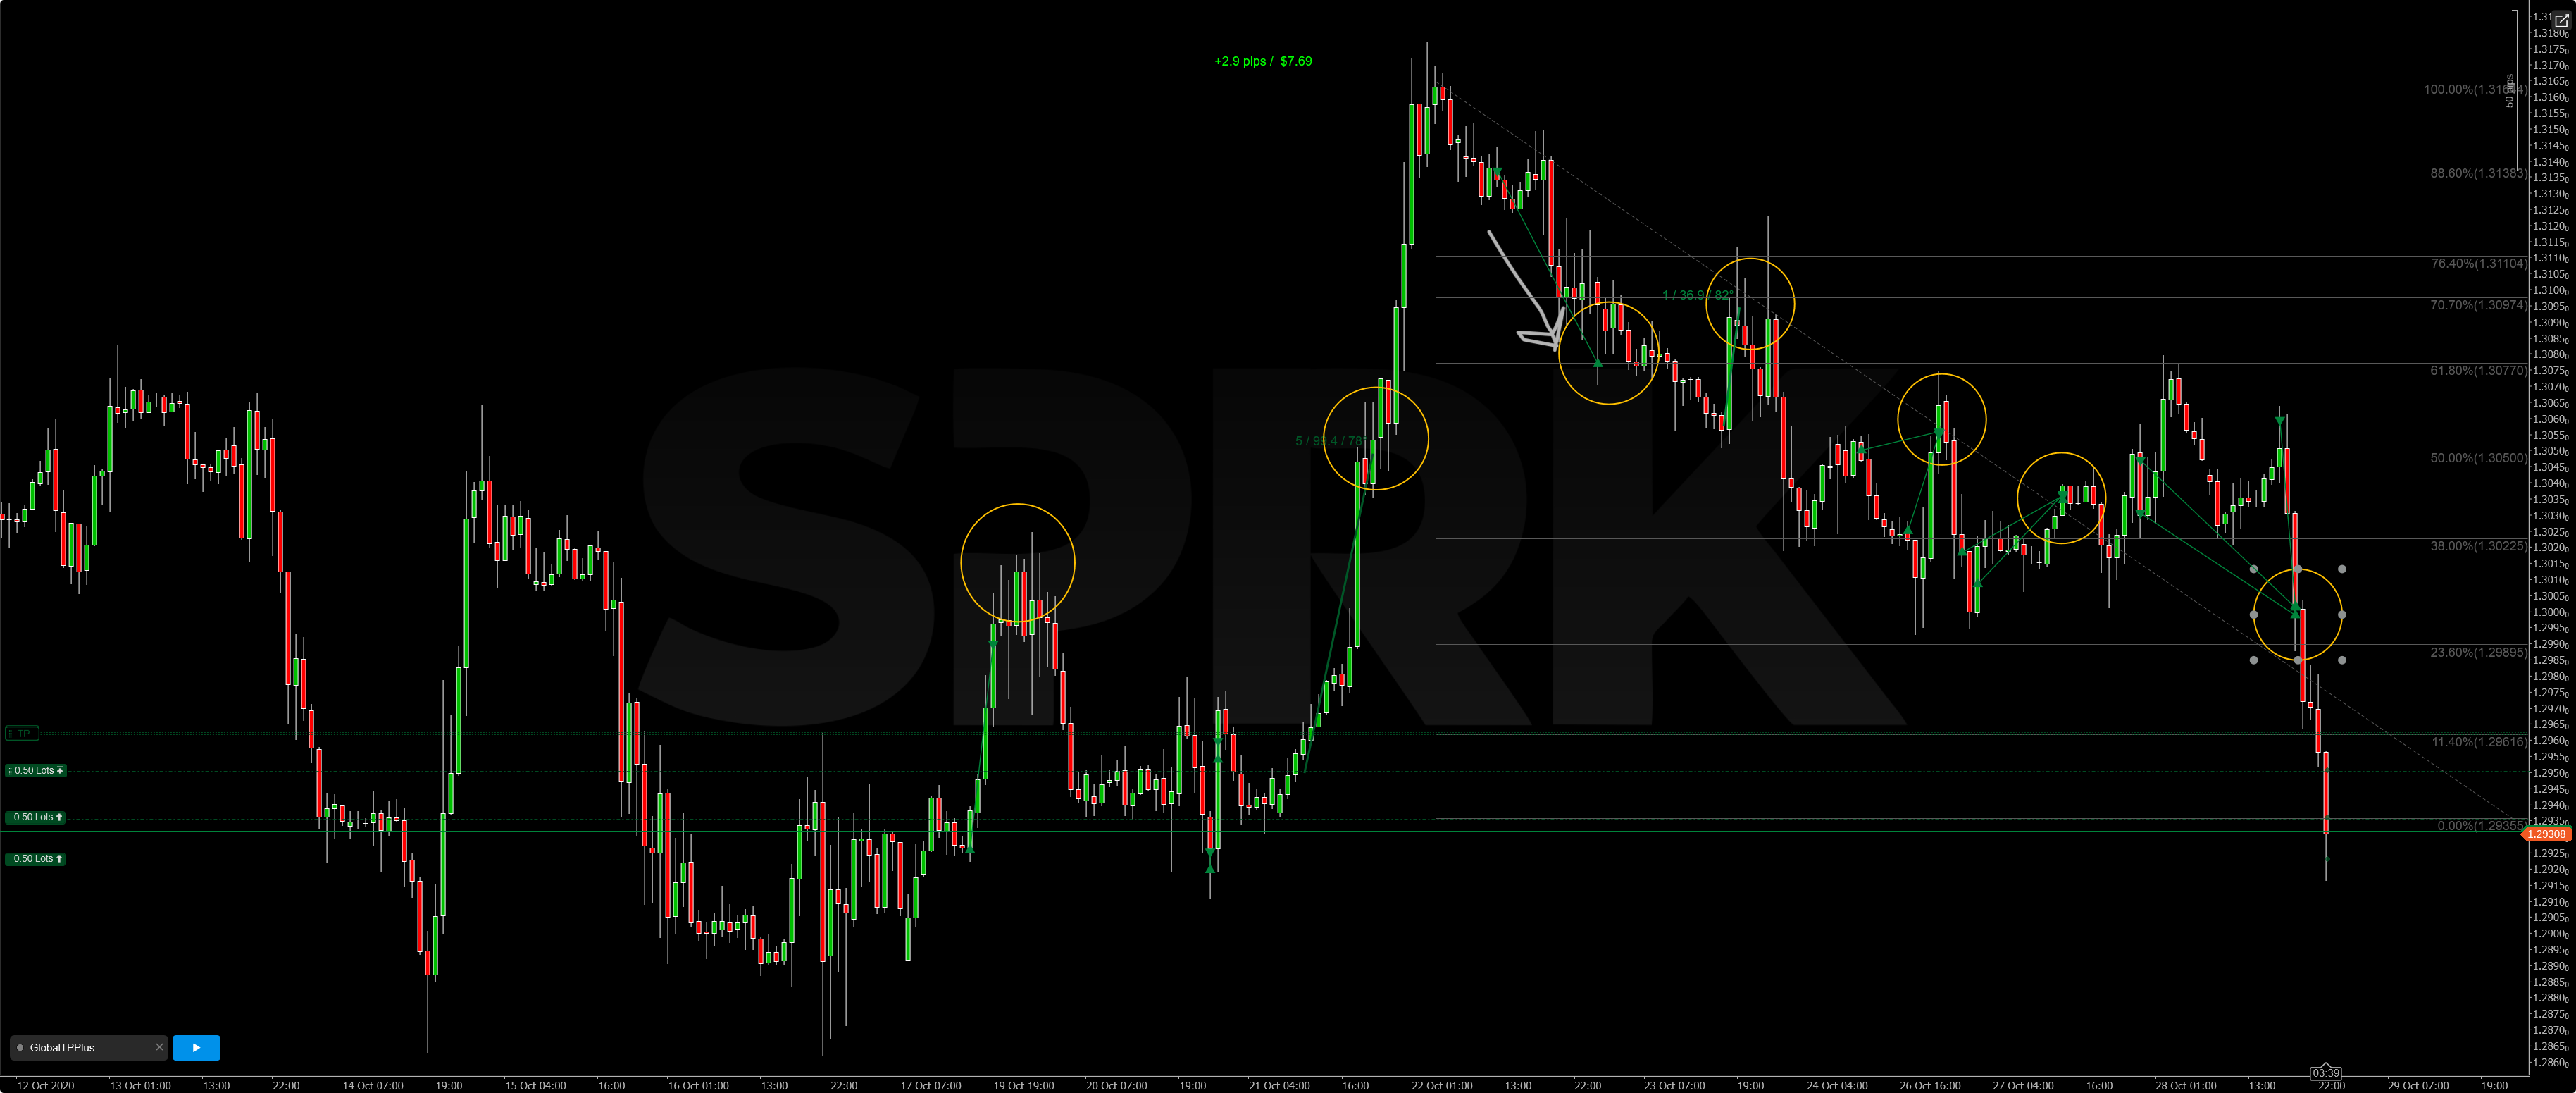
Another Triple Pyramid of positions…81+ pips…
7 days… and 100’s of Pips later… all from applying a simple observation that started here…
@Trendswithbenefits So Basically You are saying its not just luck anymore? 
its trend following with use of fibb and its dynamic trend lines?
Do you care to elaborate your method a bit more? or should I say TWB Method (trendswithbenefits) 
Maybe am not funny anyways… I would love to follow your journey <3
So how are those long bets going bro. Bit quite.
Here is a simple strategy for noobs. Come to babypips. Discovery what the "Guru"s are doing then bet the opposite 


@therealInsideBar Everything Is available for free. only a moron will pay a guru…
trading requires nuts and commitment.
Most of the people only talk… In fact they are even not good demo traders.
BTW. when your bias is right. even the fundamentals will boost your trade.
No I asked how your trades are going, this one
and this one
A measure of a trader is not how he handles his winners but as how he handles the losing trades