Rly? So markup is over? I thought we would have to see a proper buying climax… darn…
EDIT: Well it looks like they wanted to start off without me. No NS was present and the push thru was on very high volume. No entry for me. Now they are selling in the fib zone. It might give me another opportunity but maybe not. :38:
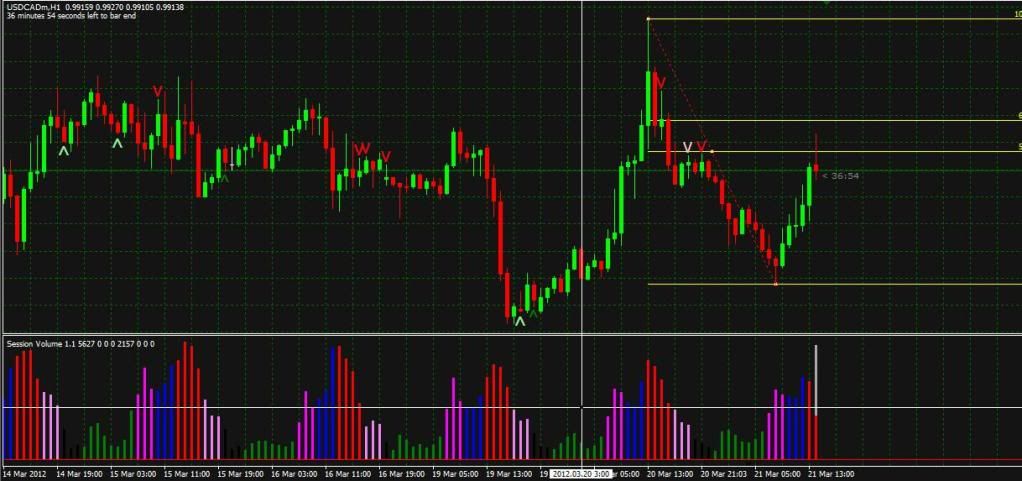
I missed a lot early this morning, but currently the USD/CAD is testing a downward 50-61.8 fib. There may not be enough time in the session, but I’m looking for a short.
That was on high impact news. It usually doesn’t happen that way. Not a time to enter anyway. Don’t worry about hindsight moves, and trying to catch them all…just proper setups.
Pete when do you re-draw the fib levels? the last on gdp was a swing low to swing high (H1)…now the was a higher high but also a lower low…the lower low did not close below the last swing low. thank you.
I like your charts, but like SagiCZ is saying, do you consider background? I passed on that short entry due to 1hr, but 5 min was perfect…so had some decent probability.
ok so you are considering VSA in the daily. My home base to give me direction is the 1hr. We differ there. More power to you if you’re doing well. I just wanted to clarify the difference.
what the present conditions of gbpjpy pair tell about vsa? I see pin bar formation after this uptrend. Also can we use accumulation distribution indicator for volume?
First of all I want to thank Pete for the effort in explaining and promoting this approach. I think volumes are an interesting subject to consider and the whole idea on which the VSA theory is based is actually valid. But unfortunately, leaving the theory aside, I can’t say the same about the practical aspects. In fact there is a significant detail to consider as well: the amount of volume we consider while trading is just the broker one.
Some time ago (I don’t remember if it was in this or in the previous thread) you were suggesting to open a demo account on IBFX to get “better volumes”. The point is that there are no “better”, “more right” volumes. Every broker will just give you a partial view of the whole phenomenon, because there are no better or worse data: there are just the broker ones. And trying two or three different platforms at the same time you can see that data can be widely different, so a volume analysis is statistically useless for taking trading operative decisions. Using a broker you could take a particular decision; using another one you could end up with different conclusions about the same trend. So, even if you analyze charts in a reasonable way, the final result is still kinda random, because it is based on non-objective data that could differ a lot from broker to broker.
I don’t want to be brutal (LOL) but unfortunately that’s the truth behind data you use to take decision on. Since those we refer to are subjective volumes and they depend on the broker we have chosen, I think it’s still not possible to take valuable, reasoning decisions with volumes, even if the general approach theoretically is right.
Pete I also took that short. in the background, I saw a bullish close, but it had the largest wick on top for the day…when it bounced off harshly against the fibb… had to take the ND.
Question is: was it risky because of the 12 gmt 1hr bar having a wick on the bottom?
I think it’s safe to say that Petes and other peoples succes on this thread disproves what you have just written. That said, you can get a data feed from esignal for about $100 monthly that merges the feeds from several large banks to give you an exact volume feed. I will only switch to it if the brokers begin to play with the volume information to thier benfit. At least there is an option if that happens, but for now, the broker feed does sufice. Cheers,