TP hit at +15. Short again at 1.3402.
Post a chart and explain why. No random trade calls please.
Sorry, trying to get to 5 post so that I can.
Got the charts ready to go but didn’t want to just spam the thread.
So I guess I’ll just say hello!
Been trading stocks since about 2009, just finding my way into forex, and love it so far. The volume analysis techniques have been a godsend to transitioning my knowledge.
I’m a long time follower of pefefader’s information, and have read through the other VSA thread twice. Now for a chart!
ah, ok cool.
That reminds me of something I want to talk about soon, the difference between tick volume and actual volume.
In short, if we were looking at [I]actual[/I] volume we would want to see an increase in activity to “support a move”. It tells us there is a lot of money behind it. That doesn’t apply to tick volume.
A significant increase in volume on let’s say an up move, shows us that many ticks, including down, went on during that candle…showing possible weakness…sell orders coming in. I’ll talk more about that soon. It will help clear up some of the confusion regarding Master The Markets. 
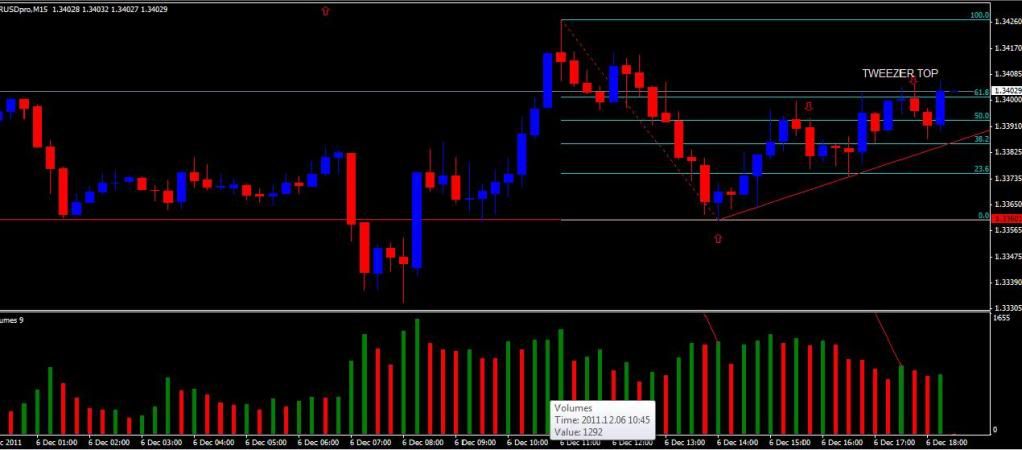
One More. Tested the 61.8 FIB for a third time with high volume and was rejected. Shorted at 1.33985 and riding it down now!
You didn’t give any analysis, which is sorta the point here. Also, it’s not the entries I’m trying to teach here. I would like to keep things on track. Do you already have have a profitable method with VSA?
Ok, I think that answered my question…your trading VSA like I did a few years ago lol. Highly aggressive.
You are right on spotting that weakness, but entry is another story…depends how aggressive one wants to be.
Also, trading this time of day is more risky.
No, I have no other systems I use to trade, just what I’ve learned from your resources. You’re the man!
I agree it’s aggressive. It’s one of the things I’m trying to scale back on. With larger moves on Hour charts and the like, I definitely tend to wait for confirmation. However, my bad habit is that when trading these smaller, shorter term moves, I tend to enter early. Definitely working on it, but it’s hard to change when its working! I need to get burned a couple more times. 
One question though, if you have time.
The last down-move before that last peak at 61.8 Fib kind of scared me a bit with the amount of volume on the down bars and the downward pinbars. It seemed to be showing a decent bit of strength on the way up to that Fib. Is there a reasonable explanation for that, or just an anomaly?
Ok, now I get the picture. You’re a lurker coming out lol. It’s cool to hear that you learned my method and doing well, and we never talked lol.
Your question. We know as a general rule, lower prices bring more demand and higher prices more supply. Both supply and demand are always present. If I’m looking at the correct spot that you’re talking about, it’s a fib zone bounce from the last swing low/high. Demand is present and overwhelmed supply at the lower price/fib zone. It could present trouble if you shorted into that, but consider that amount of volume compared to the supply.

OK…maybe this should only apply to entries. Because proper exits would have netted me about 1% profit today. Instead I’m down a few cents due to slippage.
The first exit I posted I am okay with. I obeyed my instincts. Would like to have the experience to have stayed in that one though.
But here is the second:
[http://i1090.photobucket.com/albums/i361/Blessed444/exitsaremybane-2.gif[/IMG]"]
]([IMG)
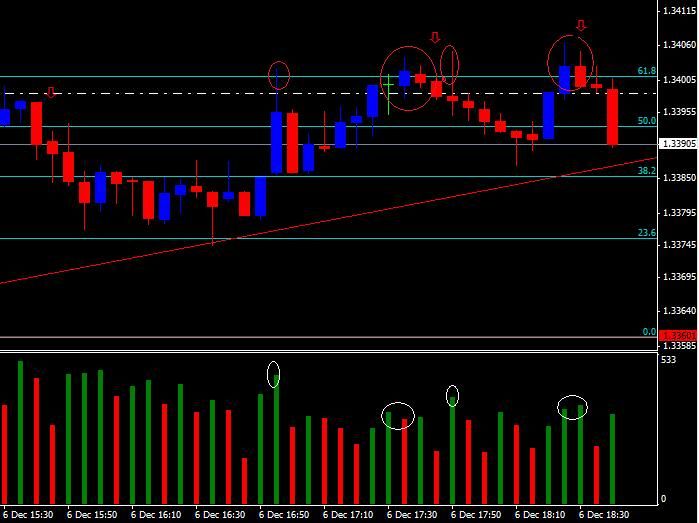
In hindsight, a proper exit would have been at the reaction to C (probably the smartest), the close of D, or the close of E.
A: Secondary test of the buying climax. Very high volume considering the small spread. Closes a bit below the high of the buying climax. The volume is lower than that of the buying climax. Lower volume in the area of a climax/stopping volume says higher/lower prices are not coming. In this case higher.
B: This is not a ND. But it is no-demandish. This bar along with the climax and bar A was enough weakness to bring me in. I do recognize it is very aggressive. Higher volume than A, or a true technical ND would have been much better.
C and D: Demand comes in. This is where my mind starts playing tricks. The volume on both of these bars increases from the ones before it, but no where near the volume on all the selling pressure.
Actually, after looking again its pretty close. Darn. Also just noticed the volume on C is higher than the volume in the whole down move, plus the high close. Which would make D the secondary test on lower volume. And E would be the no supply that brings you in for a long. Wow. Its so visible now. How do I not see this “in the moment.”
The two upthrusts on both sides of D also helped convince me to stay in. I ended up holding my whole position all the way till it came back to BE and took me out. “Hoping” for a move all the way to support. I was also greedy in not wanting to accept +10 pips or so, and looking for a 30 pip move. Maybe I should start exiting a piece of my position every time I feel hope setting in lol.
I would say stopping myself out on the first trade contributed to staying in the second as well. Turns out this post is less about VSA, and more about psychology. But I did all the work and Im leaving it in  Maybe someone gets something out of it.
I felt like I needed to make this video to finish off the “Truth” video series. I really just improvised here. I hope I did it effectively.
This should be most helpful to those still trying to make sense of Smart money activity and bring together the concepts shown in the first 3 videos.
It only covers a few hypothetical situations, but hopefully sheds light on price movement in general.
Feel free to follow up with any questions you may have.
Since everyone is sharing their indicators, I thought I’d share mine
I’ve programmed it to paint the candle Green if it’s a No Demand bar, and Red if it’s a No Supply bar. If the candle has the highest volume of the day, it will paint it pink.
Here are the settings:
NumberOfBars - How many bars back do I paint the candlesticks?
VolumeLookBack - Needs to be the lowest in this many candles to be a No Demand or No Supply.
AlertHighest - Alert if this candle is the highest volume candle of the day
AlertNoDemand - Alert if this candle is a No Demand
AlertNoSupply - Alert if this candle is a No Supply
AlertSound - Play this sound for the alert
AlertEmail - Send an e-mail for the alert
Arrows - If the next candle after a No Demand or a No Supply closes past it, put an arrow.
A nice trick, is to put your cell phone number as the e-mail address in your MT4 settings, that way it will send you a text for the alert. Here’s a list of Email to SMS gateways to get you started:
List of SMS gateways - Wikipedia, the free encyclopedia
If you have trouble setting up MT4 to send e-mails, GMX.com e-mail is both free and compatible.
Personally, I use Prowl to sync the message with my iPhone without bothering with text messages, but either way will work.
Here is a chart from yesterday to see how it works, using the rules of the thread. Have fun!

BetterVolume ChartBars part1 1.4_Revised_Public.mq4.zip (2.24 KB)

Nice…
First trade using this technique alone and snagged a bucket full of pips.
Just closed out (rightly or wrongly) as I see volumes increasing which to me indicates some background buying in to supply…
Guess this might be re-distribution though…
hmmm…
Perhaps I should hang on to half the trade and keep an eye on volumes.
Anyone looking at the EU at the moment, possible NS.
No, just closed on its low. Looking around for a possible long here with the hi volume stopping the down move

![http://i1090.photobucket.com/albums/i361/Blessed444/exitsaremybane-2.gif[/IMG]](http://i1090.photobucket.com/albums/i361/Blessed444/exitsaremybane-2.gif%5B/IMG%5D)
May keep heading down now. Will wait and see what happens. No urgency at all. Wait patiently fot he chart to yell at me 
I am watching it too, but we still need confirmation