This is how I do it:
http://i1086.photobucket.com/albums/j449/yunny11/eurusd158.png
Now, something a little more complex 
http://i1086.photobucket.com/albums/j449/yunny11/eurusd157.png
Waiting for tastefullvenom answer 
This is how I do it:
Now, something a little more complex
Waiting for tastefullvenom answer
I’m guessing yunny that the reason you have said that the point marked above is NOT a dip is that it has used a prior high as support. So for the purpose of the bullish bias to reman in tact, this is not necessary. Price may fall further than that level, as long as it makes a higher LOW than the previous LOW, the bullish bias continues.
Sorry I can’t offer anything in the way of a diagram to show what I mean here guys but I am at work right now and trying to write this on my phone. But I’m reading along intently and loving the whole bias of this thread right now.
Some good work guys.
I have my answer to this. But as per request I’ll wait until TV answers
You are right HoG! that is not a dip because we do not have enough info to tell that level will move the price to the upside… if you go long at that level without further analysis then is what “experts” call “to chase the price”
the only info is the last swing low … that is when patience comes in play… you have to wait for your trade…
Please HoG … go ahead… tell us your answer…
I asked for TFV answer just because I spotted something interesting in his last chart… 
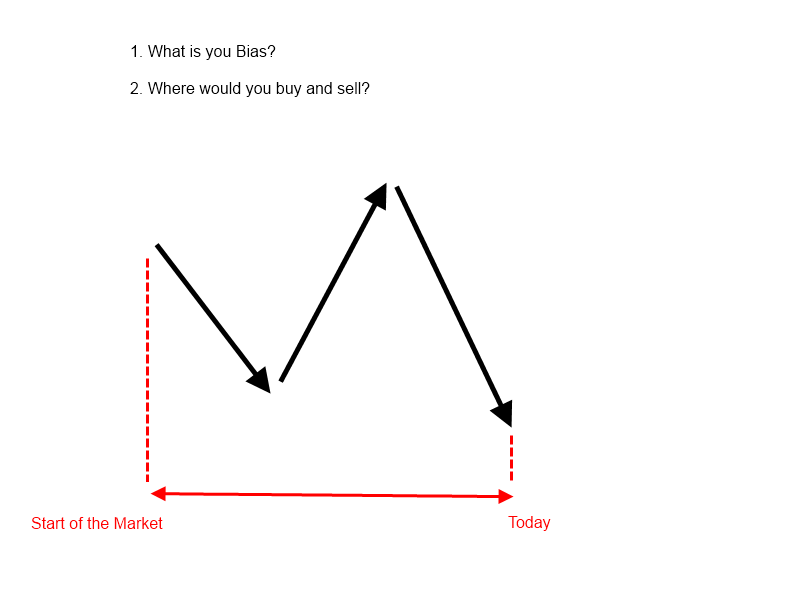
My overall bias for this chart would need to be bearish. I would be looking for price to rally to some point short of the first high and sell from around thefe if a top is formed
However I don’t think that one is as straight forward as the first as the first high was higher than the open before the new lower low
HoG, I’ll answer later about the last chart.
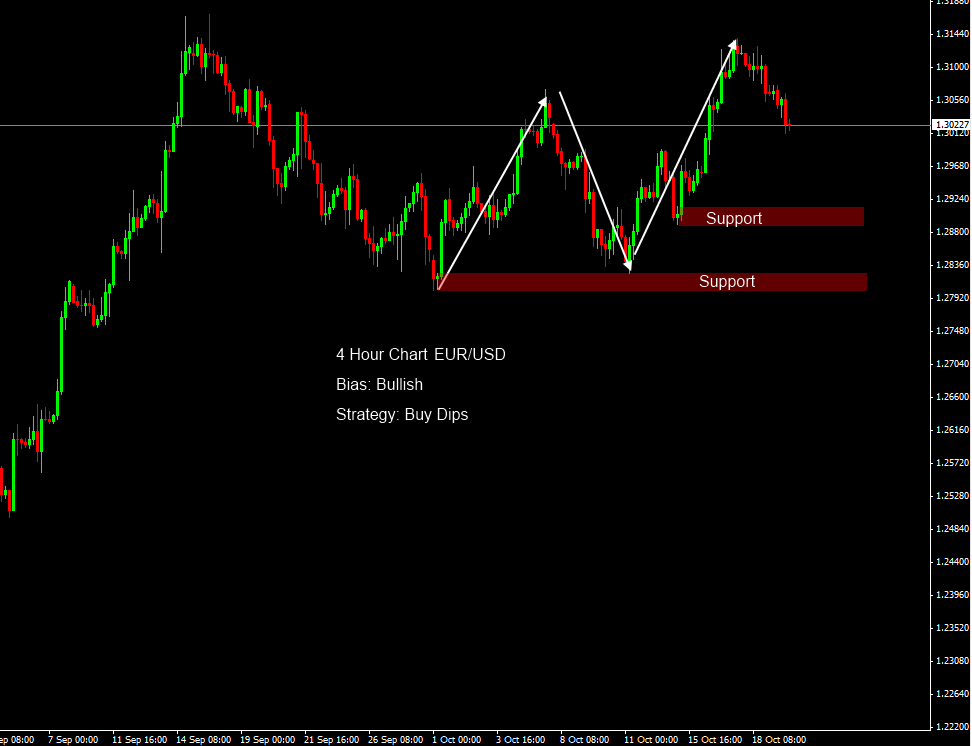
Meanwhile I already have my plan for the Fiber this week, let’s see if price reaches the levels I marked. I might buy at the first support level if a good PA appears. If price goes to the second support level then I’ll wait for better signals
Please do not trade anything from this post with real money, i am not a signal service and this is NOT a sure-fire strategy
Yunny,
would you care to comment on whether or not Demand has any influence on your decision?
(thats if you see a distinction between support and demand.)
Also, I know it’s off track here, so would you mind posting in Bronz’s thread, since he is targeting demand/supply anyway.
I hope it’s not too much to ask, but thanks in advance anyway.
By the way, this is turning out to be a really great thread, one of my favourites at the moment.
Well done to you and HOG
Well… Demand/Support and Supply/Resistance for me are the same… that part of my trading is partially based on Sam Seiden’s ideas. I know a lot of traders have a different opinion but I want to stay away from that discussion.
bronzbeard is posting trades in the 1 Hour chart, something that I do not do anymore… but I always like to share my ideas, so I will post from time to time there…
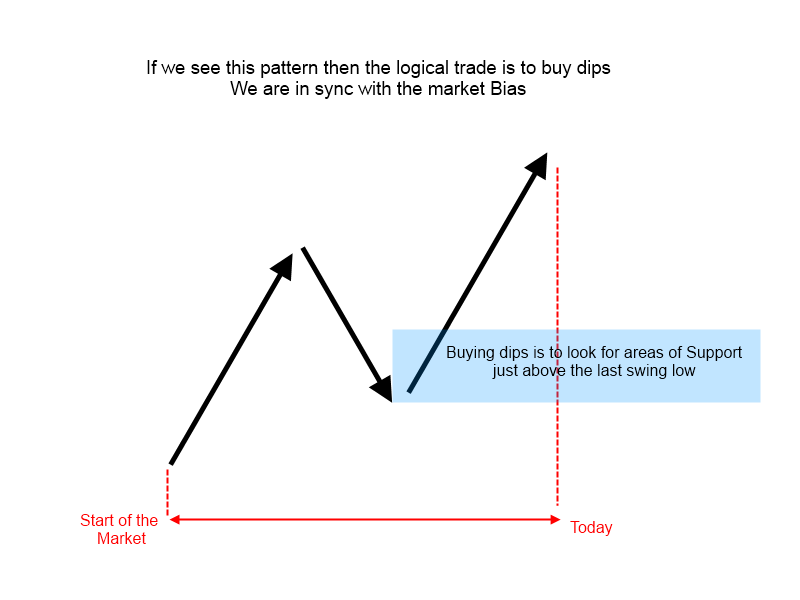
If there was no more price history at this moment if I was going to place a trade I would sell. The reason is there are obviously buyers and well if people want to buy something I want to sell it to them and hopefully make some cash in the process. I know most will say buy dips but dip to where?
I get your point Bob… you will anticipate the fall of the price… but is the safer trade? where would you place your SL?
The dip is just above the last swing point… why? because is the only and last info we have about the behavior of traders… they stopped the fall and pushed the price up at that level. So may be more traders will seek to buy ahead of that level.
Now, something a little more complex
http://i1086.photobucket.com/albums/j449/yunny11/eurusd157.pngWaiting for tastefullvenom answer
Sorry for taking this long to reply but I just could not make it earlier.
That is an interesting chart that Yunny is asking us about and one that puzzles me. My thoughts about it are the following…
Probably a better and more patient trader than me would just stay out of such a market and wait for a clearer market structure before he throws his hard earned cash in the market.
The market might as well keep ranging and in the mean time hunt the immediate highs and lows till it decides to move strongly in one way or another. Therefore the proper play I think would be to wait for the next swing high to form and take an informed decsion on how to trade it. A swing high below point A would indicate a bearish market environment while a swing high above point A would mean that more wait is required till the next swing low is formed.
Wish I had the patience to wait that long…

Yes, the overall Bias is Bearish BUT we have to be very cautious because volatility is picking up
This image caught my attention… that is why I wanted to wait for your answer for the last chart. In your mind you are anticipating a run for stops and then a continuation of the up move, that happens from time to time but if you look in your charts (mainly in higher time frames) they are not the norm.
If that swing low is broken then it might signal a change of Bias…
Pretty good answer… with the info I am providing may be the best action is to wait… however if you are able to find a good resistance level near point A… this pattern is a signal of change in Bias (Bearish).
Last week I took a trade using this pattern in a Aussie trade: 301 Moved Permanently
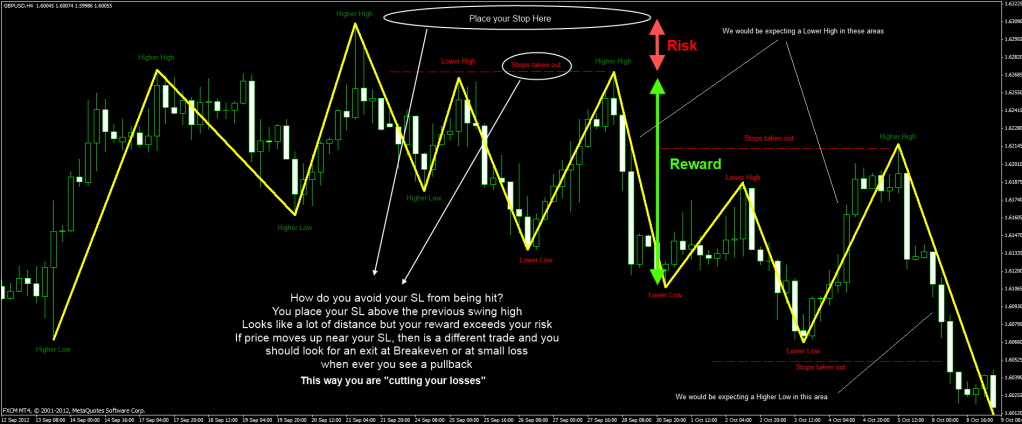
I agree with yunny that it is more probable for a lower high to form after the last low has been taken out, but the scenarios where that does not happen is more often then we would like it to. Even on higher time frames. Attached is a 4 hour snapshot of the recent price action on cable.
http://www.hostpic.org/images/11cable.gif
… Had to update post a couple of time to attach the right snapshot …
Yunny any thoughts on how to avoid getting caught by such moves?
Actually I took a Trade at one of the levels you are showing TFV…
http://forums.babypips.com/newbie-island/46951-traders-arms-2nd-floor-26.html#post404291
The entry was based on the weekly chart… but if you zoom in to the 4 hour chart and see how those levels formed (the lower high and then the lower low) I knew I should hold to this trade… I am not going to lie to you, when price came back against me, I was already thinking in an exit… fortunately was only a stops raid and price fell like a rock… that trade ended up making me around 350 pips…
Here is the way I manage my SL…
I was kind of expecting that you give me that answer. Well done for that trade btw. I still need to get used to trading from higher timeframes…using large stop loses and larger targets.
So back to the thread’s topic…so far we established that before a trade one needs to have a bias. The steps we discussed to get a bias are …
Take note of the way the market is moving (market structure) …
…higher highs + higher lows = bullish
…lower highs + lower lows = bearish
…if market is not as defined trade with caution but market usually moves in the direction of the last swing high/low that was taken out
Take note of higher timeframe support and resistance areas to anticipate where price might react
Is there anything which we need to add to the above?
PS…would like to hear what ST has to say too regarding this topic
I respect the opinions of ST and as always, would be interested on his thoughts, and the thoughts of RC too. I’d also like to hear from any new traders who might be reading along and don’t quite understand some point made or maybe just have a question.
That is, after all, the reason we decided to start from the start in the first place.
Did want to just add this quickly though since we are on the subject of bias. It’s my trading platforms own Dollar Index chart (4Hour).

Just really shows what has been discussed already with a series of higher highs/higher lows, then moving to a lower high, lower low and possibly another lower high being carved out just now.
Don’t really have much comment to make about the chart other than to say it will be interesting to watch how that unfolds this week.
Should say about it though that I did not draw the lines manually. It is the zig-zag. Should also add that I don’t have a clue how the zig-zag works or what the best settings are for it, I just used the default 12, 5, 3 settings because I was too bloody lazy to draw my own lines tonight.
One last thing before we get into it this week. When I made my last video about the Dark Cloud cover, my youngest daughter was standing beside me, listening to me talking about how and why I was drawing the lines that I was drawing on the chart.
When I got out of bed today, after doing my nightshift last night she told me SHE had done a chart that I could use for my trading this week. This is her Support and Resistance levels for the Dollar this week.

In the unlikely event that anyone can’t make out the first swing low, just tell me and I’ll be happy to point it out
Well sometimes an un[B]bias[/B] opinion is needed from time to time
This kind of remind me about a story in the Book “The Adam Theory of Markets”
“ Once upon a time there was an enchanted land called
Marketland where a fascinating game called The Market was played
most days. And the thing about this game was that it would go up or
down every day and the players would make bets about the
outcome. A simple game.
But there were complications, which had to do with the fact
that all the players in Marketland had opinions about which way the
market would go.
And not only opinions. The players had systems, methods,
evidence and analysis to back up their opinions. They had Dactyl
numbers and Pdontiff waves, Xandon lines and Zigdar harmonics.
They had the legacies of the old masters, Oerbot and Caljen. They
had inventories and earnings, money-flow studies, astrology charts
and the benefits of 4th-order spectrum analysis, all of which was
extremely fascinating. Yes indeed, the players had many marvelous
things.
The problem, though, was that sometimes the methods
called for the market to go one way and it would go the other way.
This never failed to astonish everyone concerned, and there were
many long discussions about how or why the market could be so
perverse. However, it was usually agreed that this had just been a
temporary aberration by the market and that the methods and
analyses were as good as ever.
But one afternoon something happened to one of the
players, a man named Mr. Beright. And he was never the same
again. Mr. Beright had made a detailed study of Azerhof numbers,
becoming one of Marketland’s recognized experts on the subject.
And the Azerhof numbers were now quite plainly stating that the
market needed to go up, so Mr. Beright had taken a solid long
position.
Unfortunately, quite soon after Mr. Beright had gone
massively long, the market started down. This did not worry Mr.
Beright excessively, since he realized the market had to go up. Yet
the market (strange creature that it is) wouldn’t pay any attention. It
kept going down. And down. And down. And Mr. Beright
(understandably, since we’ve all lived through these moments) got
quite anxious and depressed. But he knew it would all get better very
soon, just as soon as the market turned around and went the way It
was supposed to go.
Now all good fairy tales have children in them and this one
is no exception. Mr. Beright, it turns out, had a beautiful five year-old
daughter named Herenow, and just as he was contemplating his sad
fate, Herenow walked into the room. Sensing that something was
wrong, she asked what it was.
“Oh nothing, darling, You wouldn’t understand. It’s just that
the market is supposed to go up and it hasn’t yet.”
“Is this the market, daddy? This line on the screen here?"
“Yes.”
Little Herenow went over and peered intently at the jagged
line on the screen. And then she said:
“Well, daddy, I don’t know anything about the market. But it
certainly seems to be going down.”
“ Well dear, that’s why you don’t understand. You see, the
Azerhof numbers say that absolutely, positively the market has to go
up here.”
“l know, daddy, but right now it seems to be going down.”
“Not only that Herenow, but the Melinxar frequencies state
unequivocably that the market has got to go up here.”
“t know, daddy, but right now it seems to be going down.”
“You don’t understand, darling. When the Azerhof numbers
and the Melinxar frequencies agree, the market has got to go in that
direction.”
Little Herenow looked puzzled. She went over and peered at
the screen once more.
“ l don’t understand all those things you’re talking about,
daddy, and don’t understand the market, but right now it seems to
be going down. Doesn’t it?"
Mr. Beright paused and looked carefully at his five year-old
daughter. “Would you say that again, Herenow?”
“Just that right now, daddy, the market seems to be going
down. That’s all. Did t say something wrong?”
“No, dear no . . . not at all.”
And at that precise moment something snapped in Mr.
Beright. All those years of studying Azerhof numbers and Melinxar
frequencies and everything else swam in front of his eyes. Then he
looked at his little daughter again, picked up the phone and sold out
his long position. And what’s more, he went very, very short.
Now Mr. Beright is a changed man. Because all that time
that he used to spend studying Azerhof numbers and so on he now
spends playing golf and enjoying his family. And his friends think he
has become very strange, because he has no interest in all those
fascinating systems and methods and statistics about the market
anymore.
But Mr. Beright doesn’t care. Because he’s making money.
Lots and lots of it.”
Just to remind you guys that this strategy to set a Bias does NOT intent to tell you where to take a trade… I use S/R + PA to do that.
 I missed my entry by just 3 pips. I won’t chase price. Patience.