But not on mt4. If you use mt4 they oanda the lowest you can trade is 1,000 units or .01 lots and you can’t partial close.
I like oanda a lot tho they fxtrade platform is nice. And you can set it to automatically apply a SL.
But not on mt4. If you use mt4 they oanda the lowest you can trade is 1,000 units or .01 lots and you can’t partial close.
I like oanda a lot tho they fxtrade platform is nice. And you can set it to automatically apply a SL.
I’ve never used MT4 Iya, I trade with FXCM and use their tradestation II platform. I hear a lot of people talking about MT4, but to be honest I’ve never even seen it, what does it give in terms of an advantage over other platforms?
I hate MT4, do not like it a bit… but I use it because most of the indicators you can download are written in mql4
I have a demo account with FxPro.
Really all it gives is i indicators like yunny said and expert advisors. Which are trading robots. And it’s pretty universal.
I wish I could have custom indicators on fxtrade I really like that platform for order placing and management. But not so much for analysis.
I am attempting to analyze a chart using these mysterious supply and demand zones that many at the Trader’s Arms seem to favor. Below is a chart of the AUD/USD from this morning with 3 zones I have identified. Below is my assessment of each zone. If someone (anyone!) could comment on if I am on the right track or off my rocker it would be much appreciated.
Zone 1
The only Supply zone on the chart. It is not a very good supply zone for the following reasons: 1) Price ranged at the level quite a bit before heading lower and 2) there is a bit of a double top so this zone is not a “fresh zone.”
Zone 2
A very strong zone. Price ranged briefly then quickly shot up. The zone is as fresh as a daisy. When/if price again hits this area a reversal is probable.
Zone 3
Another poor zone. Price quickly reversed from this area indicating demand greatly exceeds supply but looking just left of this area it is clear that, again, the level is not a fresh one.
So, is this the kind of stuff I should be looking for? Any help would be appreciated!
Evening JL, glad to see someone getting back to trading points in the midst of the other “excitement” going on around here lately.
As for you chart, here’s my 2 cents worth.
Zone 1 I would still look at as a resistance area. My stop loss would obviously go a few pips above the zone you have marked. I’d be looking to short as deep into that zone as I could get.
Zone 2, funnily enough, is the weaker of the two green zones imho. I can’t see from your chart what your timeframe is here, but if you see the bottom of zone 3 IS in fact a bit lower than the bottom of zone 2. Now if that’s a 5 minute chart then we’re only talking a few pips of a difference and you’d be right, (again imho) that level has already been tested.
But if that is a daily chart, then that small difference may well be 50 or so pips, and that surely is a new level.
My other reason for thinking zone 2 is the weaker is look where it is. It’s slap bang in the middle of the move from the top of zone 1 to the bottom of zone 3, so although it hasn’t been re-tested, it’s still for me in the middle of nowhere and I probably wouldn’t trade it unless I was on a short time frame looking for a relatively small amount of pips.
Regards zone 3. Price did shoot up out of there pretty quickly, but then doesn’t that indicate the demand overwhelmed supply convincingly at that level? Wouldn’t it be interesting to see if there was still a load of demand at that level next time?
In between talking to my wife, it has taken me ages to write this post, and I know the minute I hit the “post” button I’m going to see another post by someone saying “Yeah JL, you’re spot on with the zone 3 thing” and I’m going to sit here saying to myself, “Just goes to show what little I know!” LOL
Thanks for chiming in HoG. The chart is the daily. I can’t say I disagree with any of your observations since I have no clue what I am doing with Seiden/Yunny levels. The chart is a bit hard to see details on but the top of Zone 3 overlaps that previous zone a bit. I suppose demand is now just a bit lower on that Zone 3 level then?
This is a most interesting method of trading, I must say. It is simple, straightforward and makes perfect sense. Those must also be the reasons I haven’t had much success with them!
You may have just coined a new trading method, “Seiden/yunny” levels. I like that. If we can trade the bobmaninc using seiden/yunny levels we’ve knocked it off.
Just as a side note, which I’m sure you already know but I’ll tell you anyway, did you know the seiden videos explaining this are on fxstreet.com? Go on to that site, search for sam seiden and you’ll find them. I know you probably know that but I thought I’d just say it since you said you didn’t know about how to use them.
Mind you, I know where the videos are and I’m still not great with them 
Folks,
I was trying to explain the bear move made in Fiber yesterday. In terms of supply and demand, I think I see a supply zone on the 4H Euro chart that formed on Feb 5 (A), that price went into and then dropped out of yesterday 2/7 (B) as the bear move. Is ‘A’ a valid supply zone, and based on S/D, was this a valid entry. I know it made money, but want to make sure that I am understanding S/D zone plays.
This is my first attempt at uploading a chart so not sure how this will look.
Yes, I watched them ages ago and tried to put it all into practice (unsuccessfully). ukdave reminded me of them not too long ago and watched them all again. Like I said, it seems easy. Right up until you put it into practice… which led me to my post trying to see if I understand it all. Since you have presented a differing view it is obvious that I should 1) watch the videos again, 2) keep practicing with it and 3) call it a night. It’s Friday night and I need beer!
Some time ago I watched a video by Steve Nison (Mr candlesticks for the unknowing) who spoke of a concept he called “record sessions”. Basically what he meant by that is that there will only be so many of one candle in a row before an opposite candle appears.
So for instance, 6 bullish candles in a row before a bearish one appears.
In this concept, Mr Candlesticks decided that you will only get around 12, 14 at the very max, of any one candlestick before an opposite candle appears. Therefore 12, max 14, bullish candles before a bearish one appears.
He held this to be true across all timeframes. Enter the USD/JPY weekly chart…

Anyone guessed where I’m going with this??? 12 weeks of moving constantly up, a nice doji/star forming at the top. If I traded off the weekly charts, I know what one of my main trading ideas for next week would be already.
I had that idea before(to lazy to research). Good to know now I don’t have to endlessly count candles lol.
Honest answer for me with that one Hogarste is that it is one of the drawbacks of looking purely at a chart. I think that sudden drop happend as a result of a certain Mr drahgi opening his mouth.
Now regardless of whether he spoke or not would I have been watching that sort of zone? probably yes, because as you can see to the left of the high, it did act as a resistance zone somewhat before. But zone A has now already been tested by high B, and since there is a higher high to the left of them both, the higher high is the one I’d be putting most of my trust in
Just as an add on to your chart above Hogarste, if you drop it down to the 1 hour level this is what you get;

The red box top left is the high of your A zone. The red box to the right is the high of your B.
Now going by the “price moves in small ranges” stuff by Chris Lori, see how the bottom (support) of zone A became resistance to zone B.
The price drops like a stone, ranges for a few hours, moves out from the bottom of that range and then the bottom of the range acts as resistance again at 1-3370 ish I think it is.
So since price did form a supportor resistance level at a certain zone, I think we’d need to pay attention to it in the future. The test for me though, to judge how strong a level it would be, was what timeframe did it form in. If it formed in the daily, obviously you’d be more interested in it than if it formed on the 15 min.
I raised this question because I added an answer to the question on the thread asking about how one could have known about this Euro move, and when I read my answer, I did not like how I sounded, and wanted to look at it from an s/d point of view which I was a little foggy on. However if you look at Fib extensions (I initially posted this as a S/D question only) that zone of s/r, where price ran to (1.3370) is both the 127.2 and the 161.8, depending on which high you start the Fib from. This can only mean that the move was planned, or someone up in heaven went short on the Euro (which makes me wonder what the spreads are.)
If the result of the move was totally the result of Draghi’s speech, then the s/r zone at the bottom (127 & 161) is a huge coincidence as these are well known Fib profit taking areas.
For those who saw the pre-edited first upload that had a chart with my account information, stick around as later I’ll be posting my credit and banking information - which will be good for a couple of laughs…
What date are you going to Florida I’m vacationing there myself this summer.
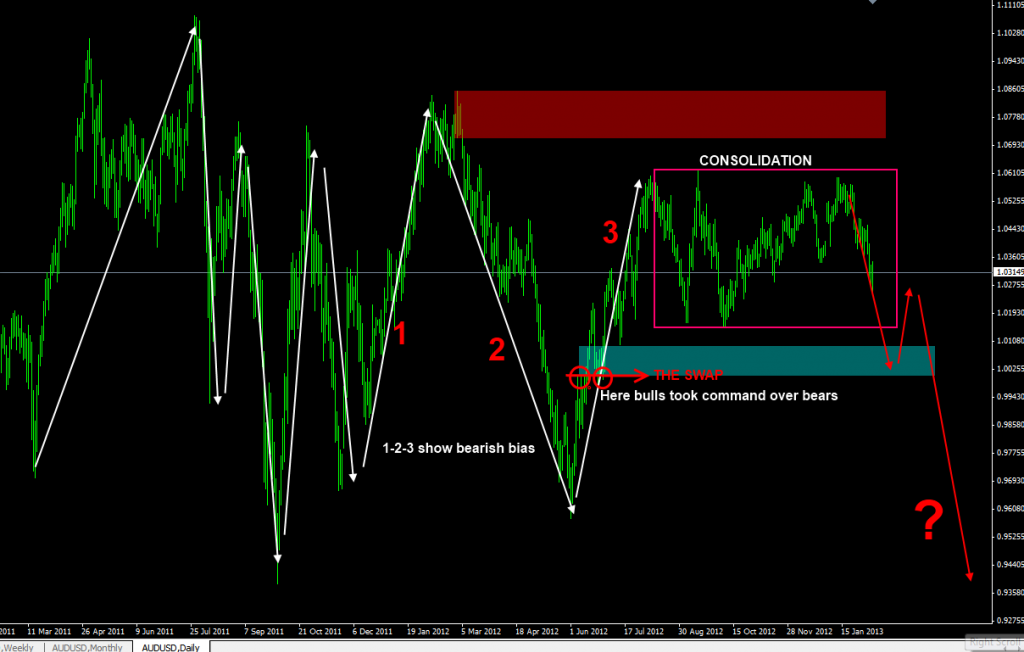
John this is my analysis on the Aussie.
My bias in this pair is bearish, Here is my Daily chart… I will explain below…
First is bias, is set by the 1-2-3 swings… so far swing number 3 has not been able to break the previous high and price has enter a consolidation phase.
Now your zones:
Zone 1: You are right not a strong resistance, not a fresh area and the consolidation phase is too close to that area.
Zone 2: This one is tricky  Is a fresh zone, the price ranged nicely and the move up was strong plus a swap, the swap is the level where bulls overcome bears. Strong area of support but not the best to go long (I’ll explain this below)
Zone 3: Right… kind of weak support it has been used several times… I would go long only with good PA
About zone 2… is a strong support but too close to the consolidation area… if price moves down from the consolidation are it means that bthe weekly down trend has resumed. I might enter a long at 1.0025 with a tight SL and try to move it to BE as soon as I can. Target could be 1.0150. But remember it would be a counter trend trade…
Overall we should look to sell rallies. the problem with the Aussie is the rollover
Hope this helps
I think that is exactly how the game is played considering only a small handful of banks control the vast majority of the forex market. If UBS, Citigroup and Deutschbank, for example, want the markets to move up the markets move up. You, me, every retail trader in the world and most (if not all) hedge funds combined will not alter the course a dozen banks set. This goes a long way in explaining why price movements are not really tied to what the news actually says. Good news? The markets sometimes go up. They sometimes go down. Every now and then they just sit there. Bad news? Same thing. Indifferent news? Same thing.
Catastrophes would be an exception as even they can catch the big banks off balance.
Long term direction based on interest rates are one of the few fundamentals that have any meaning from what I can tell. News releases? Flip a coin.
Thanks Yunny. I picked this chart because I thought it was the sloppiest mess of a chart I could find.
Zooming out and adding in the 1-2-3 bias determination certainly changes how I view the chart. Next week I will try to post some trades using these methods (demo or micros). Hopefully, practice will make perfect and everyone can feel much better about themselves seeing how I flub it up.