welcome you all to my thread
I am a professional trader who started trading in 2012.
First, I told that i am a professional trader.
So how can I say like that myself?
First, we need a definition for a professional trader. Everything starts with definitions. That is the frame that separates professionals from non-professionals.
Many sources define in many different ways this term. But for me the definition is simple.
My definition of a Professional Trader.
"A trader who able to make consistent, maximum gains from minimum risks known as a Professional Trader"
My definition is so simple. In my definition, i never frame a way of trading, Mindset, timeframe, way of analysis… Nothing.
But I use special keywords such as consist , maximum gain , minimum risk . If any system, any person able to do as in definition I can call him/her as a Professional Trader.
There are a million ways to trade, many timeframes, and many ways of analysis. Doesn’t matter how; if anyone can make a consist maximum gains from minimum risks he/she is a professional trader
No matter how experienced, age, education … Nothing is matter if able to do so, then they are professionals.
Simply i will tell in this way,
Let’s say there is a person who trades using a coin flip . He has his own rule system for entry, exit, and also for money management .
If he/her the ability to make consist maximum profits using minimum risks no matter how he trade he is a professional.
I think you all will understand this. This is the simplest formula for any type of professional trading or investing. Everybody in these fields tries to do what i mentioned.
Finally, this is my frame for a professional trader. That is why i told myself as a professional trader.
Because my set of rules in trading is built to make consist of maximum profits from minimum risks.
As everybody, i am also a beginner once. At that time i started discretionary trading as most traders.
With time i face many losses, fails. Tried many systems. Fail again. But i never give up.
Let me give you a summary of my trading life (someone can motivate or learn)
I was facing my entry examination for my higher education. At that time i read few blogs about forex trading. I interested once i saw those articles. Because it seems like one of the easiest ways to earn a good income. In those articles, those authors repeated everywhere that this is very simple and anyone can do. With my exams, i never went to test those.
After my examination. I started demo trading. I remember that first, i used parabolic SAR. At that time it is a magical indicator. Simply most of the time indicator is accurate. Then after i think i used some simple moving averages and MACD. On that day i do not know anything about those indicators. But when we add those to charts really beautiful and seems accurate. On demo some time i wins. Sometimes not. But the interesting part is overall i am profitable. Wow at that time i felt so proud of me.
With the proud, i started a real account.
Then again many magical things happened. When i executed a trade in demo i was never afraid. Why should i? I have nothing to lose. But in real trading when my mouse going to buy/sell buttons i started sweating and tensioned.
Then i found my fear inside. When trade is running making profit i always wanted to close with profit quickly. Because I am too afraid that it will become a loss. So I closed many trades with a small profit.
When trade is negative i always wanted to keep the trade hoping that this trade will become positive. Sometimes when there is more profit i always like to keep it for more and more profits.
Overall what happens is because of fear i close many positive trades with small profits, negative trades with big losses, and because of greed , i turn my positives into losses. At that time my trading is driven totally by my emotions . I do not have rules for trading. So I keep losing.
Then i tried to use many systems on blogs, forums. Even i purchase some indicators and system eBooks. But i keep losing. Nothing gave me a good result.
That is my discretionary trading as a beginner.
With time i learn price action . There are a lot of free resources to learn quality price action theories.
With Price action, my trading life little changed. I didn’t face many failures than previously.
But it does not mean that i am overall profitable. But i was improved than previous. Some months end as green and some not.
At this time i am doing my higher education on Mathematics. i am an undergraduate.
At that same time, i joined a small traders group. There were many members from different countries like USA, UAE, UK, Finland, India, Canada, etc. But there were few. Before offering membership there is an interview with the creator of the group. At that time our group is on Skype.
This also turned my life. Because i was able to talk and share their knowledge and experience. I learned a lot from there.
With time i improved my mathematical base at the university.
Then i discovered an amazing side of trading.
Before that, i have known only three ways of analysis.
- Technical
- Fundamental
- Sentimental
Later i know that there is a field called Quantitative analysis .
That major field was Systematic Trading .
After stepping into that field i improved with time and here now i am.
Later I’ll explain more about what is system trading and related facts
Ok enough about me and us. Let’s turn to trading.
Financial Market Trading (Forex)
We have to treat trading like a business . It should have a vision . A vision in the sense, of what should happen in a month, within next year, and even the next decade. There should also be a mission , which follows the vision.
Let’s talk about the market.
Why do markets move? If we knew why all of us would be profiting. Let us assume that the market moves according to a simple formula. Let’s assume that there are measurable variables, which can be incorporated into a simple algebraic formula, and the formula would tell us to sell or buy. Quite simple isn’t it?
Such linearity doesn’t exist in the market. Markets move randomly . So, one of the basic principles is that there is no such single factor which applies to every market. Market movement is multifactorial .
There are several markets. The stocks, indices, forex and the cryptocurrency itself is an emerging market. Cryptocurrency is more decentralized.
Different markets share the same characteristics. If we consider the movement, they either move uptrends, downtrends, or sideways . These movement patterns are similar in every market . So, when we create trading strategies, there should be rules or properties which bide by these universal patterns. These are core theories.
In addition, there are unique factors. For example, forex trading is based on the currency values of different countries. Stocks depend on the companies that are released publicly.
Forex is an OTC Market
What are OTC markets? OTC means over the counter . This doesn’t mean that they are not real. The counterpart of OTC is an exchange market. For example, if we take the stock exchange, there is a central regulation. For example, if we need to buy/sell stock in NYSE, we have to do that through a broker registered in the NYSE. We cannot do it through a different stock exchange.
In contrast, the OTC market is less centralized . Let me give an example. Let’s assume that we trade EURUSD pair. We trade in the Asian market time when both European and United States banks are closed. Yet we can trade EURUSD.
There are cons as well in the OTC markets. Well, there is a degree of liberty for the brokers to manipulate the market. We will break it down as follows.
Suppose you are buying a pair of shoes. You have a specific brand in the mind. If the manufacturer sells the shoes only via an authorized dealer, that particular dealer would have to stick to a fixed price, which would be agreed upon. Let’s say you are buying the same pair of shoes via Amazon. There will be several sellers, selling the same shoes for different prices. The latter acts as an OTC market. No centralization. However, does that mean that there are no rules at all? Nope. Manipulations are possible, but not to an extent that it would be like the Wild West. So, our intention of developing a strategy is to identify these market manipulations and trick them back.
OTC markets should prevail. They offer us enormous trading opportunities. For example, the market volume of NYSE is around 500 billion USD. The FOREX market is way bigger than that. The nature of OTC trading is the reason behind huge market volatility and liquidity.
So, OTC markets should be there, and brokers must be there, in order for us to profit.
Don’t think of brokers as scammers. They give us leverage so that retail traders like you and I can trade. Before 2007, it would have been a complete dream for us to trade without a huge capital. Leverage has its own pros and cons, and if we follow the correct methods, we can harvest the benefits of pros.
The participants of the forex markets are as follows.
- Governments
- Central banks
- Banks
- Interbank dealers
- Commercial companies
- Retail forex brokers
- Hedge funds
- Speculators and investors
We have to know the participants. We have to know who we are dealing with. Of these participants, investors and speculators are the most important. Not the governments or the central banks. Governments don’t play a part to profit. In the forex, their participation is mainly for the transactions. However, all other participants are in, for the profit.
Our game is against them. They have huge technologies, lots of human resources far greater than an individual retail trader. But their capital is what creates the huge volume and therefore our possibility of making a profit.
Investors and speculators are responsible for 95% of market turnover . And the FX spot market is the most liquid, because of them. Having no central exchange or a physical location, it is a good example of an OTC market. In the past, trading took place through telecommunication, but currently, it happens through electronic trading platforms.
What about the governments? The remaining 5% is made up of governments and commercial converting currencies in order to buy and sell goods and services.
What is technical analysis?
Retail traders use two main analysis methods. The fundamental analysis and technical analysis . There are two less-known methods as well. They are sentimental analysis and quantitative analysis . Don’t be confused with the terminology. We will discuss the latter less known methods later.
Technical analysis is preferred by most retail traders, because it is based on logical thinking, at least to some extent. Technical analysis forecasts the future price movements based on historical prices combined with forex indicators. It is a science, as well as art. We use chart patterns and signals in making decisions.
Having a glance at the history, it is said to be developed by Mr. Homma Munehisa. Doesn’t ring a bell? How about the Japanese candlesticks? Well, he was the guy who introduced them back in the early 18th century.
In the 19th century, Dow Jones comes up with the theory in his name. Ralph Nelson Elliot , William Delbert Gann, and Richard Wyckoff were some of the pioneers who developed technical analysis further, and you might know the theories named after them.
The technical analysis is based on 3 factors . These three have been extracted from the 5 rules of the Dow Theory .
Price moves in trends.
This explains that after a trend has been established, the future market moves in the same direction rather than against it.
Price discounts everything.
This explains that, at a given time, the price reflects every factor that has or would affect a currency pair, the factors being even fundamental factors like inflation and economy. So, we do not analyze the fundamental factors separately. We simply study the price, based on supply and demand and assume that fundamental influences are depicted in the behavior.
History repeats itself.
With the experience, we identify patterns that occur in price action every now and then. This skill helps us in entering or exiting a trade.
Science of trading
In contrast, the mechanical analysis consists of an arsenal of indicators which are based on mathematical formulae. Some commonly used examples are the moving average, oscillators like RSI and MACD, Bollinger bands. You will see that they are relatively objective than the indicators mentioned previously.
Many people criticize the use of indicators. But, if you know the rationale behind an indicator, (for example, If you wondered why RSI diverges from the price in a weakening market), you find that it is extremely helpful.
They show us the past. They are lagging. They don’t lead. These are the main complaints about the indicators. In fact, every indicator, even the so-called price action information such as support and resistance; and reversal candlestick patterns, are the past. It’s in our mind, that the future forecast is worked out.
Dow Theory
Let me explain the theory after introducing the six tenets of Dow Theory.
- The averages discount everything.
- The market has three trends.
- Major trends have three phases.
- The averages must confirm each other.
- The volume must confirm the trend.
- A trend id assumed to be in effect until it gives definite signals that it has reversed.

You will remember that we explained 1, 2, and 6 earlier.
Dow explains that a trend has a beginning and an end. In-between these two points, 3 phases occur. Accumulation phase, mark up phase, and the distribution phase. These phases can be further simplified as market trending and consolidation happening alternatively. A consolidation will either end up in the continuation of the previous trend, which is the mark-up phase. Or it can cause the reversal of a previous trend, which is the distribution phase. The markup phase is the continuation of the same trend after a consolidation.
Eliot saw the market from a different perspective, digging further into Dow’s rules.
What he saw was that a small part of a moving market, or in other words, a lower time frame exhibiting a piece of the overall market movement in a larger time frame, would also abide by the rule of consolidation and trending.
Consolidation in the daily chart would be in fact, a strong uptrend in the hourly chart. But, both timeframes behave in similar market patterns.
This comes with relativity. Relativity in the sense of price movement. For example, suppose that you see a strong uptrend in the hourly chart, your basic instinct would be to buy. But switching on to the daily chart, you see that the price has reached an area of consolidation. Relative to the daily chart, the uptrend is not so powerful.
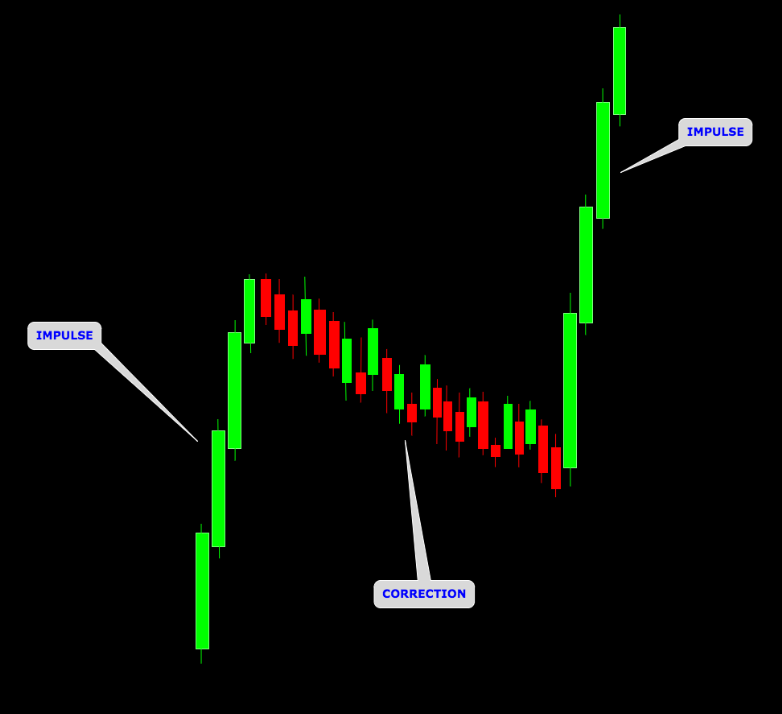
What are impulses and corrections?
According to Dow, the markups are impulses and the accumulations are corrections. Impulses define rapid price movements in a specific direction. The price movements that occur in the opposite direction, leading to consolidations are corrections. But always remember that a correction can turn out to be an impulse. A price movement that initially seemed to be a consolidation after a strong uptrend can turn out to become a strong reversal. We just have to know, when this happens.
Let me break it down further. In a strong uptrend, the pullbacks are the corrections. And the trend continuations are the impulses. When a pullback breaks out of the trend, it can become an impulse in the opposite direction.

Why shouldn’t we rely on others when trading?
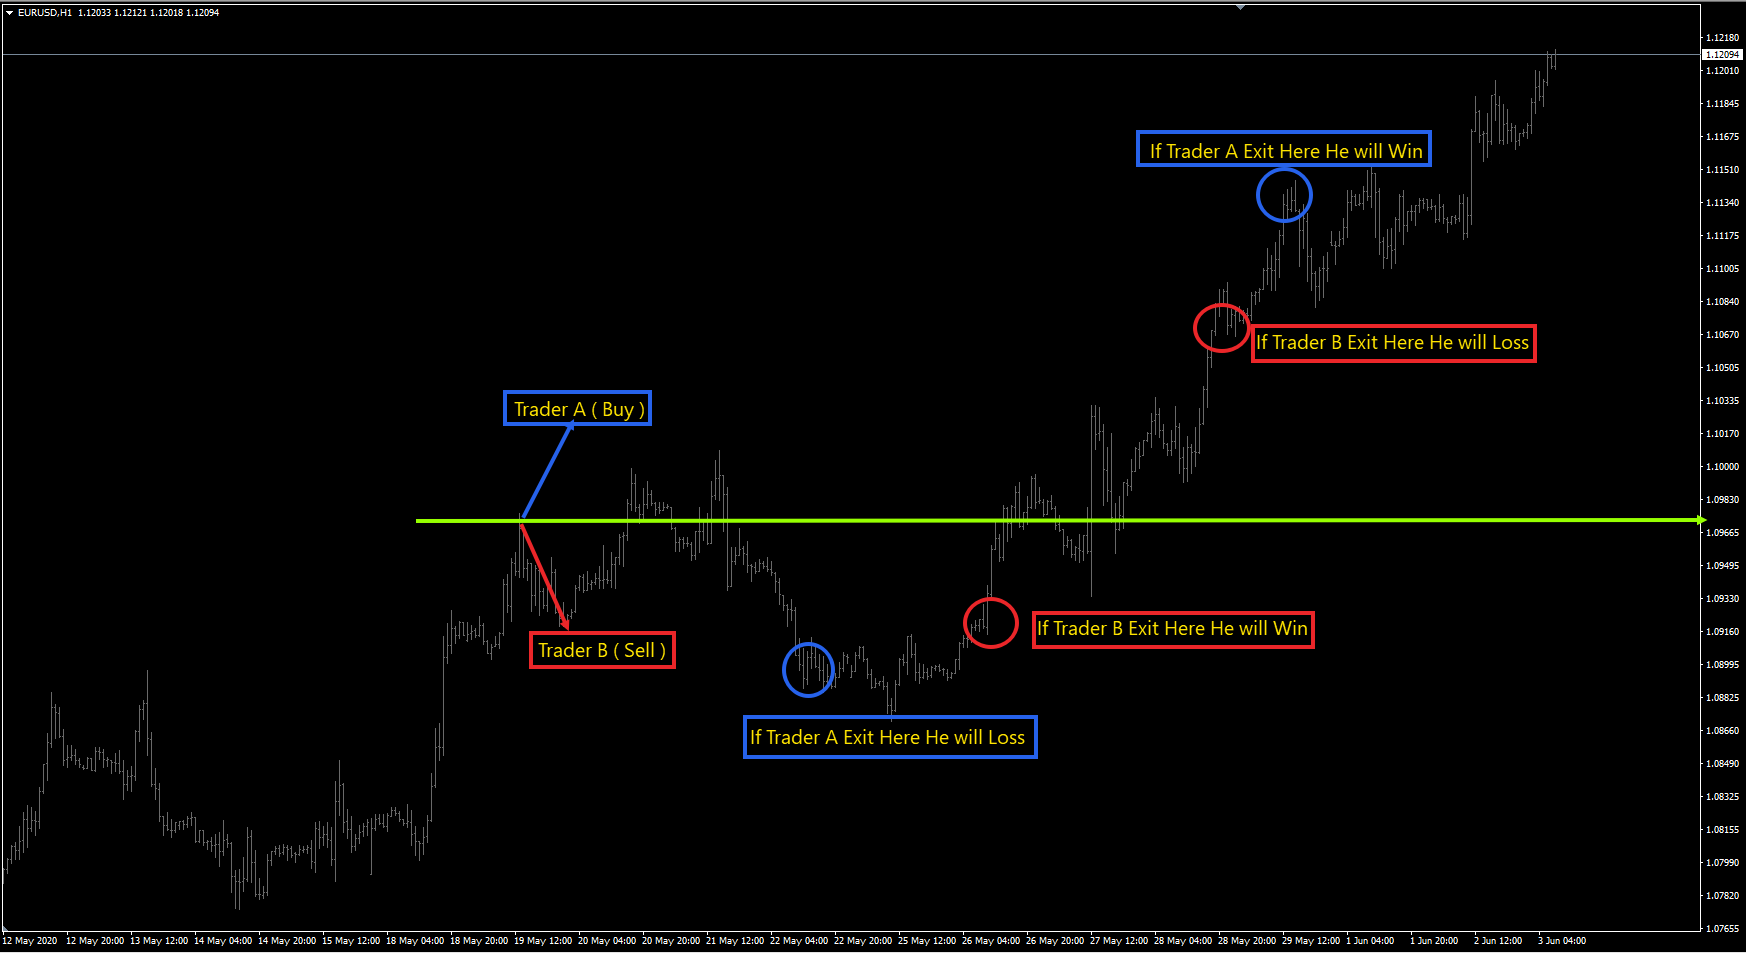
Two traders can enter at the same price, one taking buy trade, the other one a sell trade. Only one can profit, right? Nope. The price can move both ways at different points of time from the initial entry, and both traders can profit. On the other hand, a desperate premature exit can cause both traders to lose. So, it is a matter of your own trading system. Remember, it doesn’t matter if your edge is the total opposite of other ones as long as, you comply with your system. The entry as well as the exit should be well worked out. An exit strategy that will yield profits in the short term, can give heavy losses in the long term.
So, the exit strategy is quite important.
Conclusion
You will have a basic understanding of how, a market behaves according to a certain pattern, which we explained using the Dow Theory. This basic understanding will act as a foundation upon which we can build up a simple, yet profitable strategy.
Theory Notes about Quantitative Analysis and Systematic trading
Systematic trading
Systematic trading (also known as mechanical trading) is a way of defining trade goals, risk controls, and rules that can make investment and trading decisions in a methodical way .
Systematic trading includes both manual trading of systems, and full or partial automation using computers . Although technical systematic systems are more common, there are also systems using fundamental data. Systematic trading includes both high-frequency trading (HFT) and slower types of investment such as systematic trend following.
Systematic trading is related to quantitative trading . Quantitative trading includes all trading that uses quantitative techniques.
Systematic trading should take into account the importance of risk management, using a systematic approach to quantify risk, consistent limits, and techniques to define how to close excessively risky positions.
Systematic trading, in fact, lends itself to control risk precisely because it allows money managers to define profit targets, loss points, trade size, and system shutdown points objectively and in advance of entering each trade.
What is Quantitative Analysis (finance)?
Quantitative analysis is the use of models, or algorithms, to model risks in general, or to evaluate assets for investment. The process usually consists of searching vast databases for patterns, such as correlations among liquid assets or price-movement patterns (trend following or mean reversion) . The resulting strategies may involve high-frequency trading.
Financial signal processing
Financial signal processing is a branch of signal processing technologies which applies to financial signals. They are often used by quantitative investors to make the best estimation of the movement of equity prices, such as stock prices, options prices, or other types of derivatives.
The early history of financial signal processing can be traced back to Isaac Newton . Newton lost money in the famous South Sea Company investment bubble.
The modern start of financial signal processing is often credited to Claude Shannon. Shannon was the inventor of modern communication theory. He discovered the capacity of a communication channel by analyzing the entropy of information.
What is Algorithmic Trading?
Algorithmic trading strategies involve making trading decisions on the basis of pre-set rules that are programmed into a computer. A trader or investor writes code that executes trades on behalf of the trader or investor when certain conditions are met.
Qsigma Trend Smart Trading System - Logic Behind the Algorithm
Qsigma Trend Smart Trading System - Entry, Exit, Position Sizing and Money Management of the System
Note:
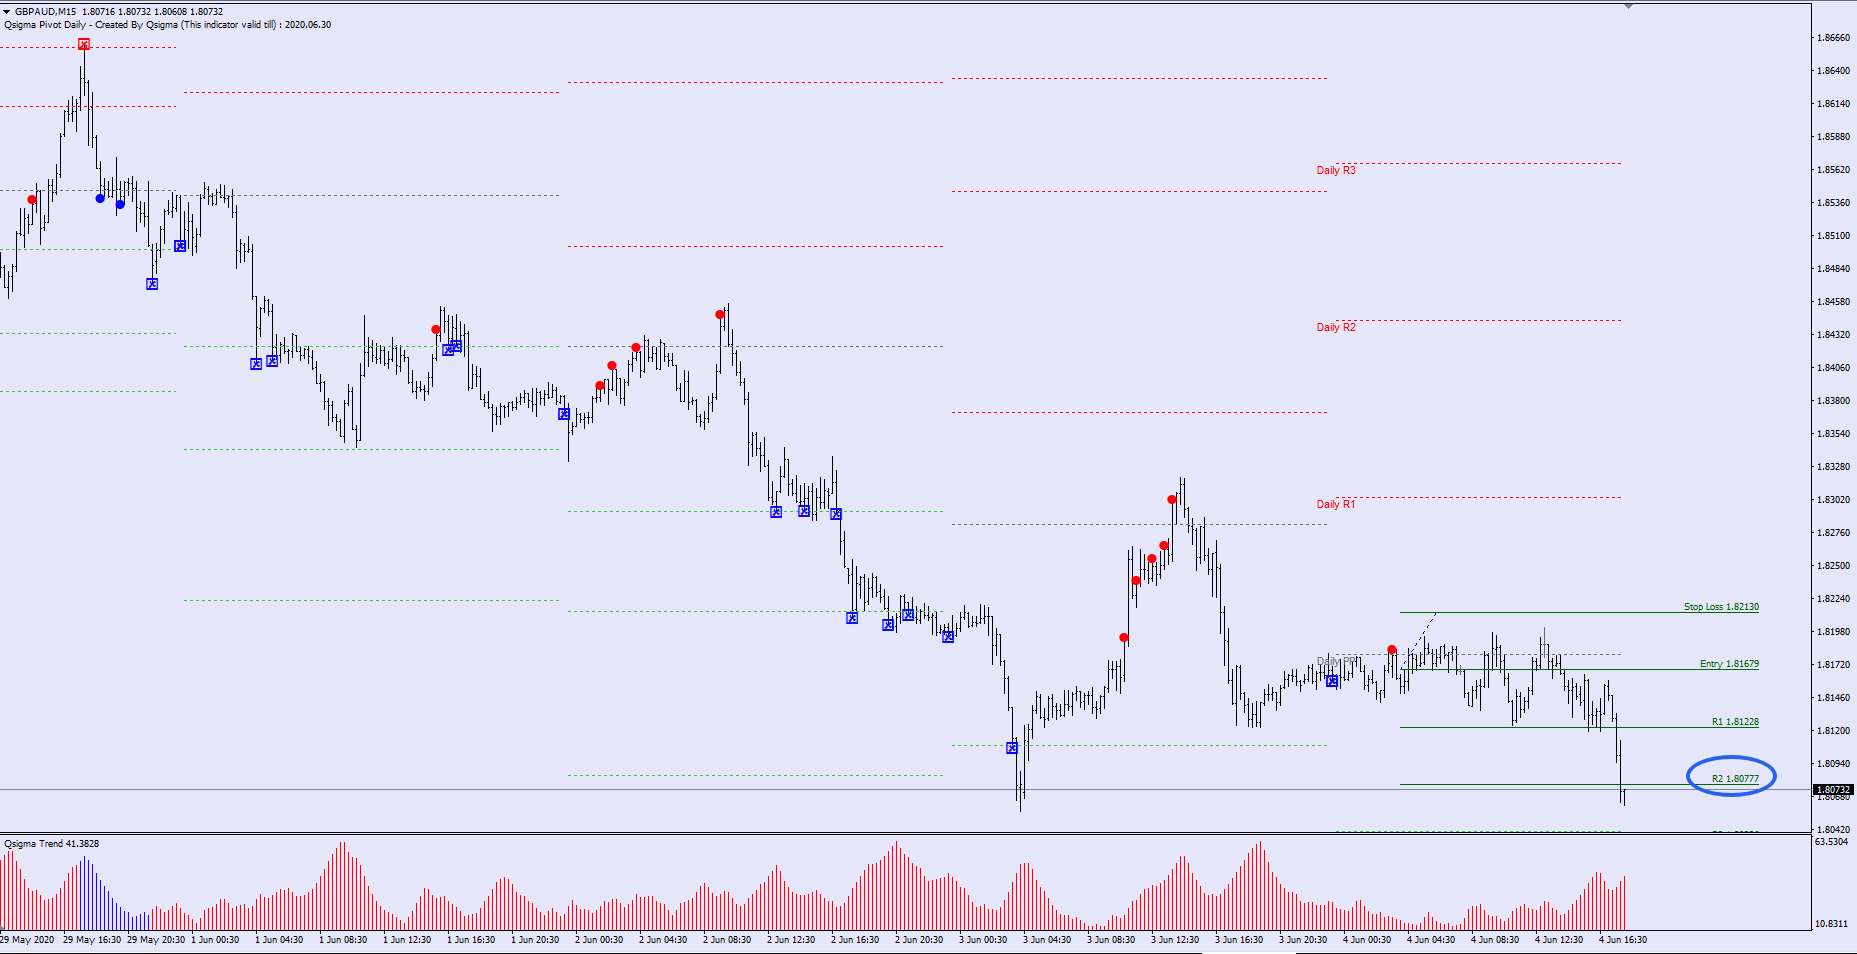
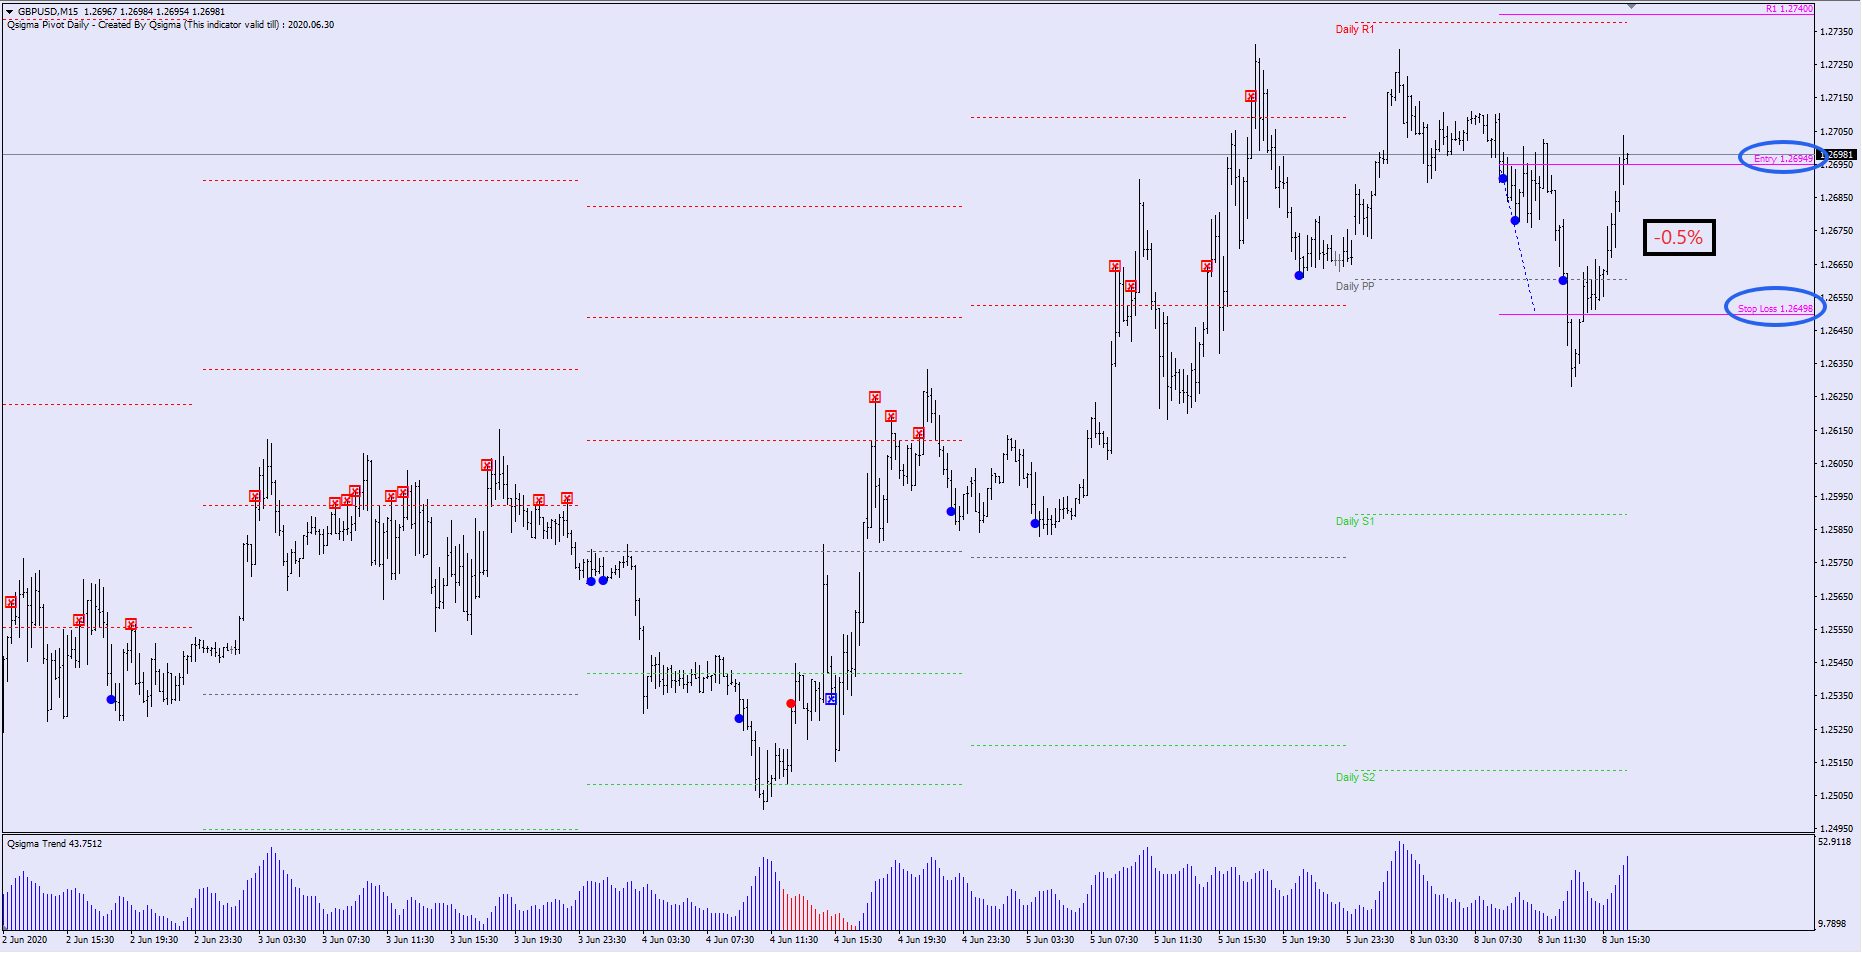
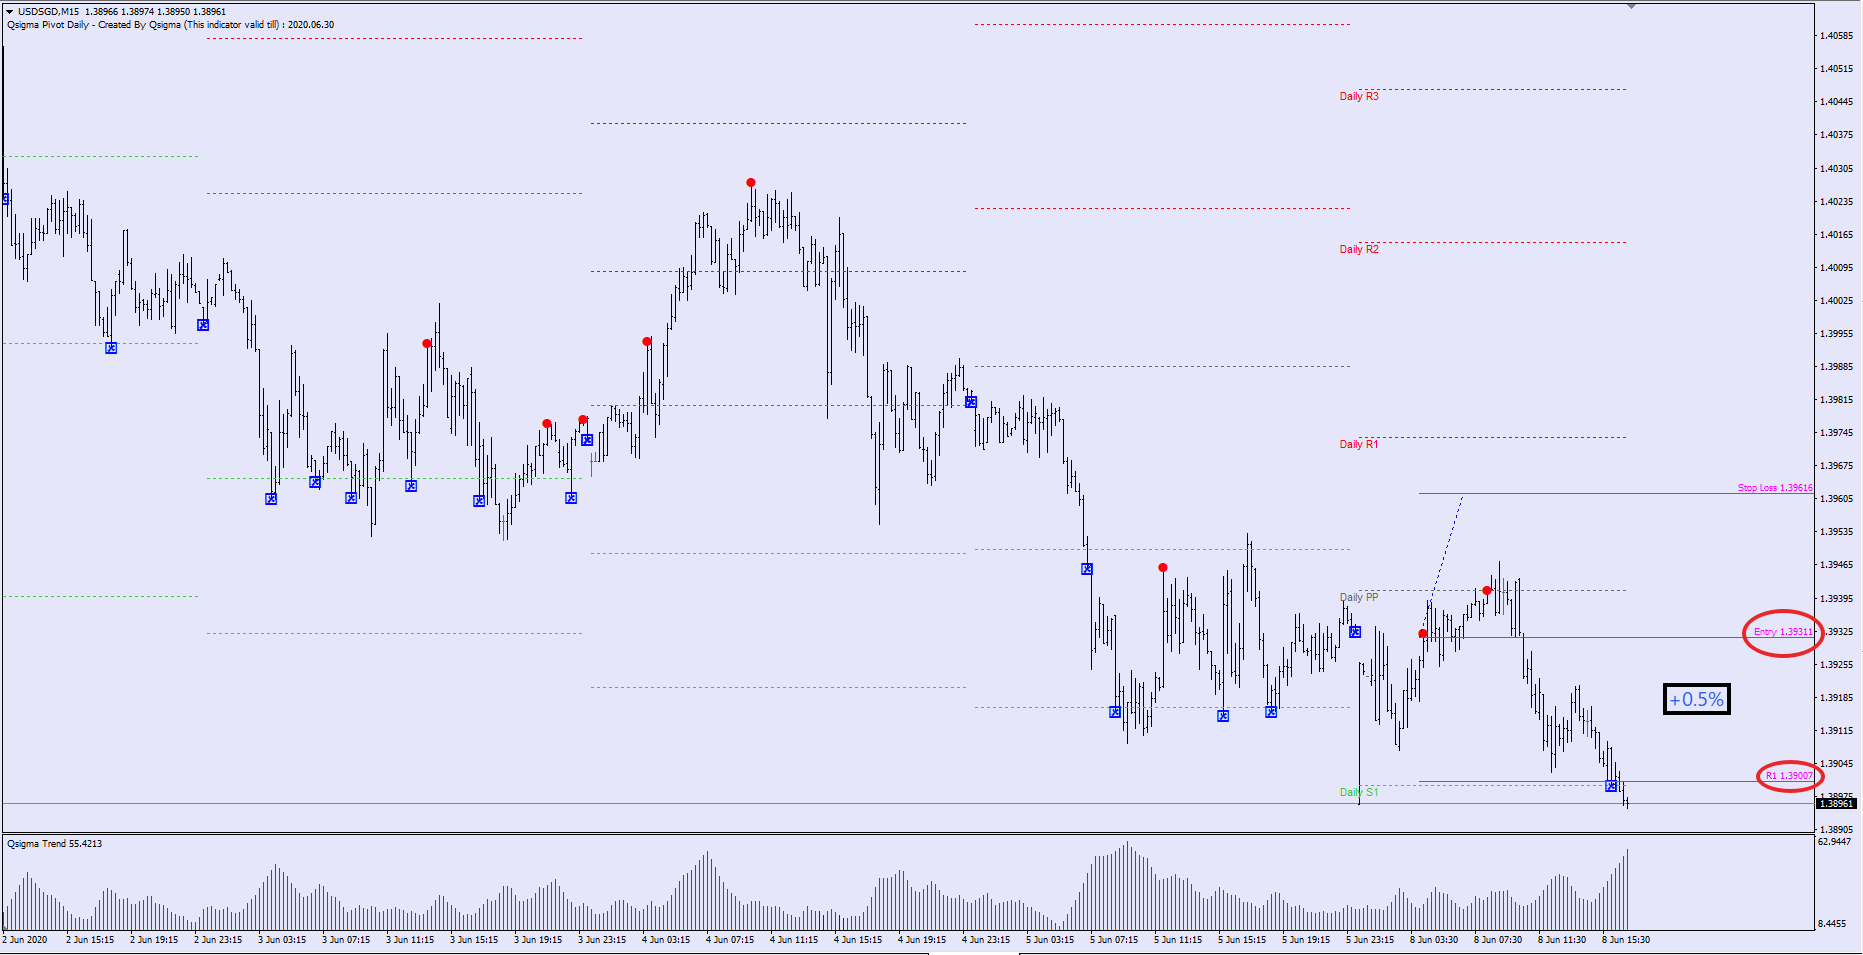
Use only 15min time frame to Trade
When you lose a trade, Don’t Enter for other same direction trades within the same impulse.
Let me clear you with an example.
In this screenshot, we got a short alert. That trade is a losing trade. Then again we got another short alert within the same impulse. If you lose a sell trade. Do not open again and again sell trades in the same impulse. Let the market change the current impulse. Losing mean current correction is turning to an impulse as I explained in the first video. So do not enter the direction trades after losing one.

Download the Algorithm
Use only 15min Timeframe for Trading
These algorithms will expire in the end of each month . I will upload algorithms on the first day of every month .
Upload 01 : ( Algorithm Valid till 2020.06.30 )
Algorithms
Qsigma Pivot Daily.ex4 (22.5 KB)
Qsigma Trend Smart.ex4 (28.4 KB)
Qsigma Trend.ex4 (14.2 KB)
Templates
Qsigma Trend Smart With Exit.tpl (7.4 KB)
Qsigma Trend Smart Without Exit.tpl (7.4 KB)
If you have any problem you can post here