TYG's Trading Story - Thoughts, Trades and Technicallity

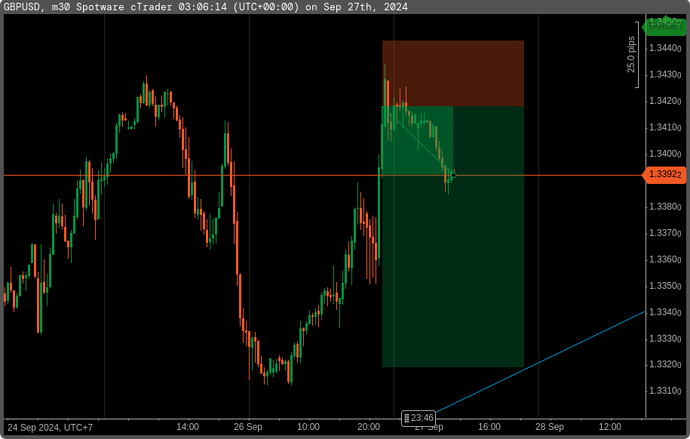
Trade: GBPUSD - High Risk

It’s common when good opportunities past, the next few days will be giving high risk opportunities. It’s a cycle in trading. High risk doesn’t mean we can’t trade. We just need to adjust our money management (MM) better. Less attach with our emotion.


Previous [ link ]

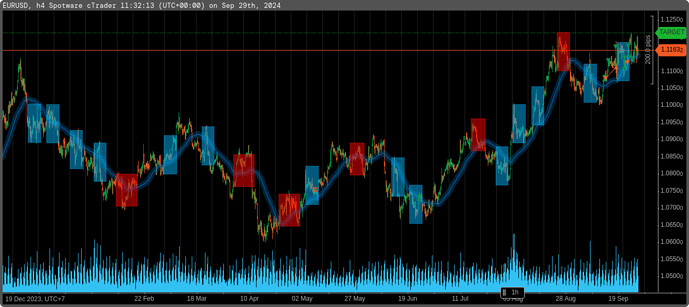
Trade: EURUSD - Mixed Formation

Trading is a very interesting job. We have to be versatile and dynamic. Our mind can’t be locked by one perspective. We need to be able to see market from every angle.

Right now, we just have moderate position for EURUSD. There is just an indication we can do short as well, when a long position is still on. As a trader, we need to follow our operational procedure. Some will get confuse, since both opportunities have high win rate :sweat_smile: so money management is the only way to survive.

We can close all or half of long position, open a short with calculated SL. Since our RR is more then 3, nothing to scare of. The key is on our MM.

Previous [ link ]

Technicality: The Way To Develop A Strategy

It’s no longer discussing a concept. It’s a real thing. Many information about how to develop a strategy is very abstract, misleading us easily.

So, how to build a strategy from scratch? To reach here, we have to have a strong basic technical or fundamental skill, money management, experiences. So how a beginners can step their foots here?

There are three steps for technical trader, minimal:

  • Chart Analysis to find frequently repeated patterns. Here is where your knowledge about chart is used. Mostly we begin from one instrument. If we confuse, we simply have no enough skill.
  • Next is we Design Trading Scenario according to the pattern we have. It’s all about profit target, stop loss, risk level identification and mitigation if possible.
  • The last to develop the best Money Management to support the two steps above.

Most experienced trader will add 2 more steps , which are

  • Method Optimization to enhanced profit, lowering risk.
  • Method Escalation and Specialization to target specific market for trading.

So, how to exercise those concepts, I will use EURUSD as an example. :thinking:

Technicality: (1) EURUSD - Chart Analysis

Why is EURUSD? It’s simple because of its stable movement. Will it remains stable? We never know. For example, USDJPY was trader’s favorite. It was like McDonald’s campaign, “I Love It, So You Do”. But now, “You Love It, That is Your Business!” :sweat_smile:

As Price Action ( PA ) technical trader, I can see very clear its SnR. For others who have no trained eyes, let we use indicator to find its characters.

It took hours and days to discover things by beginner. Since EURUSD is my common pair, it can spot the pattern easily. I will share some of them by using MA50, H4.


From above, we can see how easy to find a repeated pattern in EURUSD. I looked back to its history, the same can be seen. Bellow is 2023’s movements


In 2023, the instrument had the same movement. It also happened in 2010. So we can find this pattern has high probability to be used in trading.

There are many other patterns can be used as well. Here, I will make use of this pattern only to compose a trading system. I need no fancy system or sophisticated methodology or even angelic intuition to develop a system. All are logical and realistic.

Our objective here to find a repetitive patterns only. We look back and forth to confirm the existence of it. There are some patterns can be seen only when it happens. We don’t want this type of patterns. We need to make sure it’s repetitive and can be seen before and after it’s formed.

So after it has been confirmed, we can create exact a definition of it. It’s during a trend on H4, up or down, when price move up / down, far away from MA50, the correction happens on the opposite zone of MA. As long as the price doesn’t break previous support and resistance, it is a good opportunity to get in the market.

The rule to run the system is:

  • Defining current trend on H4.
  • Waiting correction on H4.
  • Correction is not breaking previous SnR.
  • Correction is when price crossing MA50, against the trend.

Once, it’s done, next we move to 2nd step. Design a trading scenario according to rules above, we also need to find out the trading stats from strategy above.

Note: don’t just use statements above in your trade. Strategy without good mm and stats are considered nothing.
.

1 Like
What are yours favorite instrument in CFD trading ?
  • Forex Major Pair
  • Forex Minor Pair
  • Market Index - US30, USTECH, DE30, etc
  • Cryptocurrency
  • Metal - XAU. XAG
  • Energy - XTI, CLR, USOIL, WTI
0 voters

Technicality: (2) EURUSD - Design Trading Scenario

The performance of MA50 in last 16 months:

Base on pattern, the statistic show, 24 wins vs 12 loses. It’s a 60%++ win rates system. We don’t just open a position blindly by knowing this pattern. The next important thing is how to define an entry and exit points. We need to get into the detail on how the pattern works, all in numbers and precision. We don’t just look into it and hoping get intuitions from no where.

Here is one of setup possible for the pattern.


It’s a very simple setup on H4 chart, target for 1RR. On example above, we have RR 70 pips vs 80 pips. We need to be flexible to plot our RR, market is dynamic so our trading style have to be adaptive. Don’t be stubborn, put fix TP and SL without considering current price level in the market. Always respect SnR.

The next example:


The same thing, after broken previous resistance and have correction around MA50, the price went back to retest the new resistance. The key is, when it tries to retest the resistance, it usually passes by our target.

As now we can see latest price formation. We need to practice to look at Signal #1 and Signal #2 before action.


So now we already have a quantitative trading system. We no longer trading qualitatively. From here we can do many things to optimize this method, such as increasing RR, Win Rate, finding other patterns to trade.

We no longer say, my ear is tingling, a signal to long EURUSD. Or I have gut feeling for shorting EURUSD. I even met mentors who trading base on moon’s phase or planet formation. Why don’t I just rely on my cat? If the white cat comes, that means long. When black cat comes, that means short? :sweat_smile:

Btw, I didn’t disrespect any of them. I’m fully understand the concept of seasonality. But seasonality doesn’t work in this way. it’s very quantitative and predictable method.

Once, second phase is done, we need to establish our money management. This is the core to support our trading system. It’s like you are black belt in martial arts. You are good in training, but it doesn’t mean you are good at street fighting with thugs.

Note: this will apply only to EURUSD exclusively.

As a sales, I will announce, the strategy can be applied to all instruments, holy grail to rich fast
( crossing my finger and whispering: I don’t guarantee you can make money of it :grin: )

1 Like

Trades: EURUSD Account Safe Mode

Enjoy the trades, no attachment … :slight_smile:

Technicality: (3) EURUSD - Risk & Money Management

So far, we already have pattern to trade and rule to follow. We have 60% win rate, which is a pretty good strategy. Now we need to find a good model of risk and money management. As from second step, we involuntarily will use a single entry setup, we can see EURUSD’s range movement around 125 pips in H4. Others may laugh, but the most important thing is trade what you can see. If this is lame, no worries, we will optimize it later. We keep improving our methodology, getting more setup, lowering the risk and increasing the profit. These take time.

By following the SOP, we will have TP:SL: 50:50 pips. We have statistict 60% win rate, the consecutive loss is 2 times. Just put 3 times for safety.

50 pips equal to 500 USD / lot. So if we start with 0.01 lot it will be 5 USD / position.
If we are risking 5% each time, the capital you need will be 100 USD. Your max equity drop will be 5 x consecutive loss (3) = 15 USD.
With H4, you will trade 2-3 times / month with profit 50-60% / year. Yes, it’s considered too small for CFD. But by using the system, we have all thing covered for real.

At this step, we know the min. amount of money, volume and trading frequency. At here, we just trade, while we can start doing research for other type of signals or improving the existing method. We keep doing it, and this is how a trader can be improved. No other ways. The first step is the hardest, but need a lot of patient until you have one. :thinking:

Previous [ link ]

2 Likes

Dear All, I’m wondering if what I post here annoying you? :sweat_smile:

I know there is a possibility that I let some others feel uneasy. Please let me know. Also if I have been stepping the term and policy in this community. As have been mentioned, I have no intention to sell things here. I will avoid conflicts unnecessarily. If by chance, my present here will disturb any of your interest, feel free to let me know. I will look for other places. I’m a very open minded person, no ill feeling :grin:

Here is the result for this week. Market was moving sideways this week. This week, I couldn’t get much. There is also war I’m worry about. :cold_sweat:

Screenshot from 2024-10-06 20-44-48

Not in the least. Don’t get discouraged by the lack of participation, more people are reading than you think.

Keep going, there is value to your posts.

1 Like

Hi @MattyMoney, thanks for your encouragement. I just want to protect the funs without getting other irritated. :pray: :innocent:

1 Like

Trades: EURUSD - The Preliminary Sign of Reversal

What is happening with EURUSD? It’s Up or Down? Or …

As a technical trader, we are dealing with probability. Our mind have to be versatile. We can use anything but the reason will always the same.

Forget about anything, like how Bruce Lee once said: The Best Style is No Style.

By using Price Action, we can see currently market has no trend. There is double top, indicating a reversal. The price has broken the support. It’s a Quasimodo.
Using MA50, it also can be seen, MA50 has been broken. So what can we do here?


If we know how price action work, we will be very happy look at this pattern. It’s a lovely pattern, It smells good, It’s sexy in my eyes. :heart_eyes:

Nothing is for sure here. It’s like when you are trying to confess your feeling to one you love, either it’s a yes or an “Arigato” but “Sayonara” kind of answer. :sweat_smile:

Base on MA50, there will be a pullback, confirmed by price action pattern, it needs one more high to create a Lower High to fullfill the destiny of a downtrend. From here, there will be a small uptrend. The question is where?

From right side, we can see there are 2 nearest supports. Those will be the areas we need to watch. Where’s the target? Just wait until the reversal is confirmed. But we already know the potential area. As you can see before the price fell, there is an area, where price was being squeezed, like extracting a lemon :lemon:. what else … :thinking:

1 Like

Interesting read, thank you for your continued contribution - looking forward to more whenever you get a chance
John

2 Likes

Trade: EURUSD - Monday Closing :thinking:

As expected we can see reaction in the blue area. Will it be the reversing area? Don’t be too excited. We are trader, we are not trying to win something. Throw away all emotions, just keep our logical thoughts.

We draw a red line here, it’s the trend line. We will use it to capture the moment of breakout. When it happens, there will be a small up trend. It’s our choice to hop on, or just wait another ride. :thinking: The beginner will have doubts, only experiences can let it away …

I’m looking at the chart with nothing to do
The candle is moving, unknowingly where to go to
Breaking support and resistance without clue
Let me wondering, how my dream can become true.

:thinking:

Previous [ link ]

1 Like

Technicality: Trading Journal

One of the important things to improve our trading is Journal. This is how we can observe our instinct during live trading. When we have done with trading, reading the journal can be quite entertaining and we can see our weakness and solution immediately. The problem is how to make a proper Journal.

Most of us, thinking of journal mean book, spreadsheet, document. No, we can use forums like babypips. Thanks for babypips to provide such services. :saluting_face:

Using other method is not a good option for now. In 1999, I was using spreadsheet. It was messy, very difficult to maintain. I used book, I had to draw the chart. By using public forum will be very convenient.

What if we want to keep our journal private, can we still use public forum? Yes, it’s. In the past I taught my student to replace the keyword with something else. They had to compose a dictionary to what they like. They can share the dictionary to them they wanted to participate. Everyone can see the journal, but without the “dictionary” , surely one will vomit blood to understand the meaning :rofl:

The good journal must have 4 aspects:

  • The key element of the analysis. It must be listed and has to be recorded every time. It can be indicator, chart analysis, fundamental, anything.
  • The psychological element during the time. You can write anything to describe your feeling. The feeling can be caused by price level, candle formation, floating, your balance or equity and external aspect during the time.
  • The result of the situation, just like you open a position, long or short and the reason above all of it.
  • Finally you need to write, when you close the position, profit or loss.

For example, I am a beginner. My trading skill is still limited. I know only Price Action and Moving Average. So, I only have this aspect as my perspective. I will call it PAMA. You can use any symbol you like.

Later on, when you know more, you have to change your perspective, for example you already know about the use of market range, you can create another symbol, for example PAMAR. If you don’t want to share your journal, don’t share the detail of your perspective.

Next if you don’t want to reveal your perspective, you can substitute every terminology to your liking. For example, I am a fan of The Fist of The North Star. I will replace anything to it.

Candle Stick = Chi / Power

Price Action=Kenshiro
Uptrend = Hokuto Shinken
Downtrend = Nanto Shinken
Sideways = Go Noken
Reversal = Yuria

MA=Raoh
Golden Cross=Hokuto Shinken
Death Cross=Nanto Shinken

Market Range=Toki

Next we will create EURUSD journal base on definition above. :sweat_smile:

Screenshot from 2024-10-08 11-32-44

Trades: EURUSD - Journal

Warning: you need dictionary to get the message!!

1. Analysis - PAMA

Kenshiro has been using Go Noken since yesterday. Yuria is showing above will let Kenshiro release Nanto Shinken. We have to wait a good momentum, since the power need to reach certain high so, Kenshiro can truly use Nanto Shinken.

As Raoh is now under Nanto Shinken. Raoh feel fatigue. Power is going back to Raoh.

Both Kenshiro and Raoh agree to move power up.

2. Psychology

My account is around 300 USD. The possible risk is 3 against 8, I will be happy if I can lower the risk to 2 against 8. If I loss, I still can wait for next Yuria that probably close enough to current Yuria. So a pending order is felt better. But I’m a bit worry if the power come up before visiting my order. what if … what if … what if … :thinking:

3. Action
I will do long, with target somewhere near Raoh. Raoh looks friendly enough.
I will use 0.01 lot, with SL, few pips under Yuria’s feet. I put a buy limit to at Yuria’s waist.

4. Result

1 Like

A bit of a mental exercise to follow - have to learn a new language :smile:

2 Likes

I was thinking exactly the same! :smiley: I wasn’t sure whether commenting on this thread was welcomed or not, but hopefully this much is ok! :slightly_smiling_face:

1 Like

Hi @SovoS, feel free to drop messages here. :innocent:

1 Like

Don’t worry, It was just an example. I won’t use it anymore :sweat_smile: