Just hit my limit order at 1.0249, I guess I’ll have to learn the hard way whether or not my analysis is going to pay out. (FYI, just a demo account)
I was in the first hit of that convergence, up 13 pips at one point, but my target was 15 so I just set s/l above breakeven and ended up out with just 2 pips. Hope it goes better for you.
Indeed, it was exactly at 5:01 EST; the spread went to 20 pips at that time!!! The odd thing is it happened on the CHF/JPY trade but not the AU/USD trade which I was also in. Anyway, the loss was just $4. Small price for that lesson I guess.
on what timeframes do you recommend the use of 8 MVA as point X?
Hey defiance,
Sounds like you are getting the hang of it. Nice, good job! 
Just keep on practicing and the stuff will slowly transform your mind. All of the sudden you can draw and see patterns over all the pairs and time frames OR sometimes you can immediately see that there is no good pattern at the moment.
Be careful with your gut feeling tough. This time your feeling was correct, next time it maybe won’t. Have all the rules of the trade made up and in front of you before you enter your trades. Always ask yourself: What do i do if price does that? What do i do when price brakes a specific support resistance? Which ia my SL and TP level? And so on…
Your emotions can be right sometime, but most of the time they make you close early and lead to early profit taking on trades that would have continued in your favour destroying your risk:reward ratio. Or you close trades when they are at minus XX pips but which would would have been profitable if you would have let them run for a while.
Even if you break your rules (predefined SL/TP) to take a profit it’s still a break of your trading plan. And when you break your own rules it’s demotivating in the long run since you go against yourself and what you have setup for yourself.
If you need to change rules in your trading plan, do it when not trading.
Just a suggestion from me who’s been doing these errors over and over again. I have made progress but i still need to get better at this.
Think of it this way:
“Focus on not doing the same mistake more than once and you will eventually run out of mistakes to make!”

All Time frames, check to see if wick to wick or mva to wick works best for the pair you are analyzing and stick to the XA with the best results
BTW EJ and EU have triggered daily/8h patterns right after reaching targets mentioned in the EUR/USD Feb Analysis. Get ready for a pull back to test for continuation.
thanks tmb. You rock!
TMB, Congrats once again to a great week!
I have two questions if you don’t mind.
-
Do you always include the .707 fib?
-
When it comes to the MSRT lines, I know you draw them from mva crosses and that they need to show some sort of respect for the lines at least 2-3 times in order to be correct. But I was wondering if one can’t just as well use any trendline that has shown repeated support. So not only mva crosses but also bottom to bottom or top to top lines that price has respected.
Since I’m on MT4 my MSRT lines do not end up the same as your’s so I’m looking to draw them in a better way for my platform…
Thanks!
I think i found the EU pattern.
but could you please post both charts, thank you
[B]1).[/B] Fibs I [B]always[/B]use: 0.00 .236 .382 .500 .618 [B].707[/B] .786 .886 1.00 1.272 1.618 2.00 2.618
[B]2).[/B] Yes, as long as you see respect and/or significant moves developed from the trendline (a fake out that reverses or pushes through 100+ pips from the trendline for example); you can expect price to repeat the same behavior.
Great, Thanks alot!
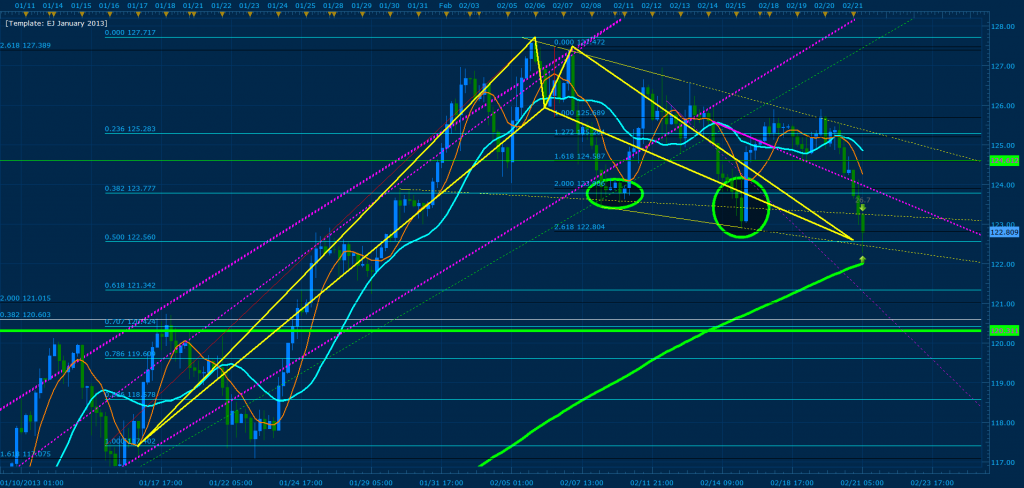
Here’s the EUR/JPY pattern where the .500 of XA (X = 117.402 of the 4h MVA curve) converges with 261% CD. If the daily breaks convergence, expect price to push towards the green horizontal line at 120.311. The green ellipses illustrated here show the respect of the previous convergence.
thanks.
But how do you manage trades? what i have read previously, regarding stops it is a break and close below fib and/or MSRT zone(s) and move stop to BE when you are up 10-15 pips. But what about tp is it still 30 pips or what do you recommend?
a noob question tmb, the gartley you have drawn, AB does not seem to have retraced atleast .238 XA. Am i missing something here?
wow this thread is so old i remember back when it was only 50 pages or so. did Tmoney start a hedge fund in europe or something?
Or something like that, I too am trying to figure out where it went from just Gartleys and Butterflies to his ‘hydra’.
Page 709 explains the additional stuff on the charts.
Hydra’s is just a way of adding additional lots to a gartley or butterfly
On page 709, Tmoney explained in the picture that the yellow trendline is created by connecting the lowest cross of the 8 and 20 SMA to the highest cross and this provides support.
Could someone clarify for me: Where did the purple trendlines come from and what is the thick green moving average? Thanks for your help.

If you move a few pages further you would see the answer… but bellow is the quote 
Note.: The EJ has broken this MSRT bullish channel, causing current volatility in the pair and signs of reversal to retest the levels broken during December and January. If price turns bullish from this point on (which I doubt), expect it to reach this MSRT zone and break previous highs.