USDCHF LONG WEEKLY/DAILY
GBPUSD LONG MONTHLY/WEEKLY/DAILY
EURUSD LONG MONTHLY/WEEKLY/DAILY
USDJPY LONG WEEKLY/DAILY
USDCAD SHORT MONTHLY/WEEKLY/DAILY
EURGBP SHORT MONTHLY/WEEKLY/DAILY
GBPCHF LONG MONTHLY/WEEKLY/DAILY
CADJPY MONTHLY/WEEKLY/DAILY
GBPJPY MONTHLY/WEEKLY/DAILY
EUROCAD SHOR TMONTHLY/WEEKLY/DAILY
CADCHF LONG MONTHLY/WEEKLY/DAILY
EURNZD SHORT MONTHLY/WEEKLY/DAILY
NZDJPY LONG MONTHLY/WEEKLY/DAILY
NZDCHF MONTHLY/WEEKLY/DAILY
I opened these trades with no stop loss trading the Trend just to show by end of next week how much $$$$$ the Account will be in Profit. By the End of the Month using .01 leverage and not touching is Amazing !!!
To trade these pairs this month trade on H1 or H4 chart. They will go in reversal just you correct entry and exit points using the 14/7 Red and yellow Moving Average. Trade Above Yellow Line or Below Yellow Line . Wait for the 2nd candle after the cross.
I’m not sure I understand. In the first quoted message, you say that you just leave the trades with no stop loss and then you check at the end of the month.
In the second quoted message, you talk about adjusting the exit points.
Can you explain more in detail how you proceed to remove your trades?
I guess I confused a lot of people with that post.
You can either let these trades ride or take profit. Let’s be honest trading is 20% Skill and 80% psychological Mindset. It’s all about being patient and waiting for the Entry and Exit points. Therefore Trades do NOT have the patience to wait especially when they are New .
The 14/7 Moving Average Red and Yellow, Tipu MACD, 50 Blue MA Thick line is a Guide for enrty and Exit.
I will be posting more pictures this month of what I am doing So Hang in there.
I can but trading is 20% Skill and 80% Phychological ( Mental Patience )
Extremely hard to have patience to wait for entry and exit points once you do you are a Master Trader.
Combine all Three to get a feel for your Entry and Exit.
The 50 moving Avererage BLUE solid line. Trade LONG above the line and Short below the line.
Tipu MACD ( free indicator Metatrader4) free signals and look for directional Arrow change and signals.
14/7 Red and Yellow Moving Average --Enter 2nd candle after the cross trading above the Yellow line(LONG-Buy) or Bellow Yellow line Short-Sell) wait until the line is about to Cross again and candles are changing colors.
Their can and will be tiny re-tractments within in a up-ward or downward movement on the 1-minutes chart as long as candles do not completely leave the red and yellow lines hold the trade and it will continue the trend.
So from your example there was a signal to sell with the red arrow. There were 2 candles with red crossing below yellow. So you took a sell. As you dont use a stop loss you still have that sell open. And you also have a buy open with the green signal.
Well theres one sell open and one buy open so wheres the profits?
In this thread trading is 80% skill and 20% psychological.
I seen other posts and felt the same way. My 3rd account is not the strategy I use here. Just wondering how long you been trading Forex and did you ever purchase or spend money money on forex programs.
I did at the beginning and in hindsight with what I know now with Babypips education, Youtube, free indicators on MT4 platform there is no need for any trader to be successful to Purchase anything.
I neither agree nor disagree. The reason is people are all different. If someone can motivate themselves and stay dedicated and put the work in then yes all the information is online but you have to wade through the rubbish and read and re-read repeat information. Nearly all candlestick books say the same thing. Each one may add a few different things so you have to read it all to find out what that is. And that’s the same for all parts of forex books.
Then after all that you have to sit down and discipline yourself to chart time, backtest strategies then forward test them. Then fail and start again. By the time you get to the charts you then realise for some reason you are not profitable even though the strategy is- trading psychology. Then you have to read books and articles and discussions of why this happens. Then you have to work on it. Finally you get back to the charts and maybe just maybe you’ll be successful. That’s if you dont go into drawdown and start second guessing your whole strategy… in which case off you go right to the beginning.
All that, but if you paid for a course which isnt a scam and joined a real time online community which explained all of the above so you skip so much and dont pick up bad habits… well doesnt sound so bad.
This thread is now like those forex books which start off the same way and everyone has to re read all the same material again to find out if you have something new to say.
I’m not going to lie,I purchased a system, why? simply that having dabbled on demo accounts, purchased numerous books, and at least one I’ll call it loosely a course for £200, I had followed a trading system that i came across in the early years.
When I had the money I decided to purchase, my reasoning the Forex market is not for the faint hearted, I didn’t want to spend all day sitting in front of charts, I wanted an easy to follow rule based system which at time allowed me to trade at the end of day and spend 30 minutes to apply.
The system is not stagnant and has and is evolving and now allows more adventurous traders and experienced to trade 4 hours charts, and 2 more end of day strategies.
The new strategies are definitely paying off and my trading has gone to the next level, they do require more input so it’s not the case of taking them blindly and hoping for the best, but it does give me the best of both worlds.
Thanks for sharing your strategy for a successful trade in FX.
But, it may sound bit daft but I am bit confused with the strategy as you explained in your post and in comments !
Just to make it simple, I am telling what I understood here and please see if those are correct.
You said-
Daily and weekly charts to follow for day trading ( or weekly trading ) !
in both charts it does not matter how the charts look but trend has to be same , means either uptrend or downtrend.
( this is very confusing ) if the chart is showing downtrend you do Long , or trade opposite if the chat shows uptrend !
4.You said many times to have patient for successful trading means you will see the trading result in few days times after the trading ( or end of the day after 4 to 5 hours trading ) !
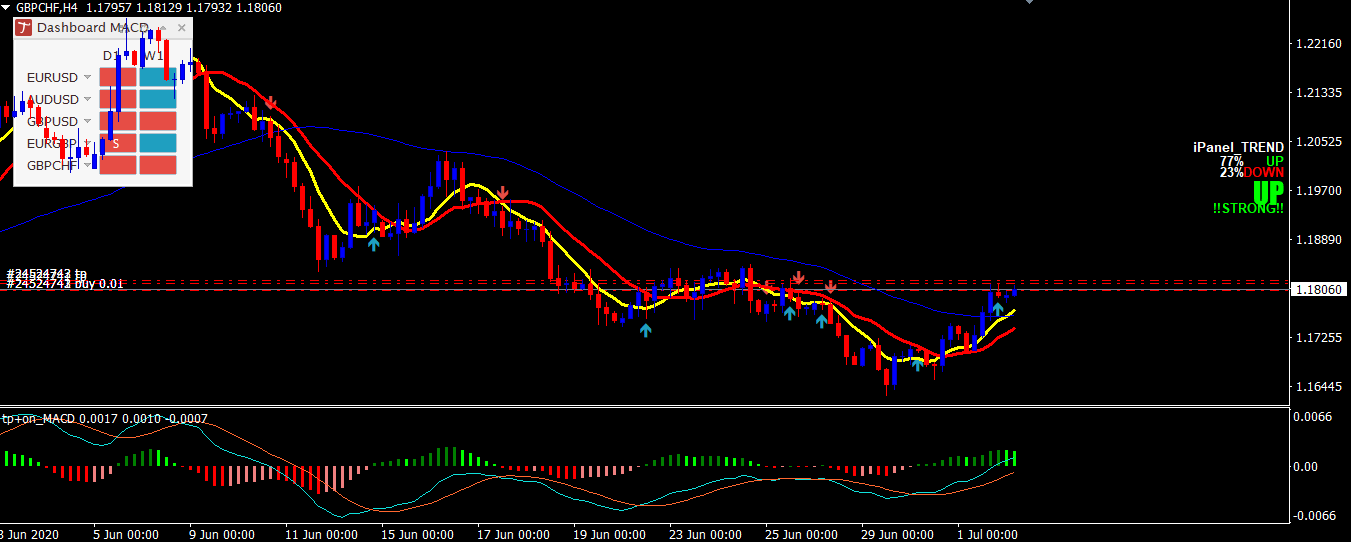
On the chart your first arrow is in Red for entry and Blue arrow for exit- is this correct . Or Blue for entry and Red for exit?
Sorry, you did a good job by posting your proven idea but may be it is not very clear to understand the strategy.
Your MA lines are fine but understanding the trend and arrow are confusing.
If you can answer my points as above then it will be highly appreciated.
1 Account don’t do anything for a month. If you were try to grow your account by 2% per day would be $10 a day x30=$200
So by this time August your Account will have $700 or more. Don’t touch it
Here Are the Trades For July 2020
USDCHF LONG WEEKLY/DAILY
GBPUSD LONG MONTHLY/WEEKLY/DAILY
EURUSD LONG MONTHLY/WEEKLY/DAILY
USDJPY LONG WEEKLY/DAILY
USDCAD SHORT MONTHLY/WEEKLY/DAILY
EURGBP SHORT MONTHLY/WEEKLY/DAILY
GBPCHF LONG MONTHLY/WEEKLY/DAILY
CADJPY MONTHLY/WEEKLY/DAILY
GBPJPY MONTHLY/WEEKLY/DAILY
EUROCAD SHOR TMONTHLY/WEEKLY/DAILY
CADCHF LONG MONTHLY/WEEKLY/DAILY
EURNZD SHORT MONTHLY/WEEKLY/DAILY
NZDJPY LONG MONTHLY/WEEKLY/DAILY
NZDCHF MONTHLY/WEEKLY/DAILY
The 2nd Account Demo Account start $500 and trade the pair above
your Goal is just 20 pips a day. Not $$$$
First I want to thank Shafatar for asking questions. I am also interested in trying Tabiuslee’s strategy.
Tabiuslee - In the first post of yours I read you discussed the 50MA and trading long above or short below. Many of the trades you listed do not follow that advice. For example, USD/JPY the yellow and blue MAs are both below the 50 MA on the Monthly, Weekly, and Daily charts, yet you advise going long. Is your strategy to trade WITH the trend or counter-trend trades? The way you write of your strategy it seems you believe in trading with the trend, but some of your recommendations do not agree. Perhaps you have typos in the list? Can you please clarify?
In later posts, you write only of the yellow and red (14/7) MAs. What is the difference (perhaps in time frames or duration) for when you trade the 50 MA or the 14/7 MAs? It is very confusing about what you intend to tell us about this. It is also difficult to know if you use the 14/7 cross for entries only or also for exits.
Thank you for your time and efforts in assisting traders to reach success.
I use the same. Here I am GOING TO CONFUSE YOU that’s because I am still undecided on whether to use a Stop Loss myself. I do not like to use them with this Strategy . I feel their is NO NEED.
Your not going to blow your account using .01 lots, just take your daily pip goal.
I mostly use the 14/7 Ma cross 2nd candle as my entry Entry point . I have went back and forth on this and I NOT using STOP Losses. I am trading the Trend and I am taking Profit when it hits my Pip Goal.
Not all Indicators are going to be perfect together But Once in whiile they do as you see On the Chart Above. Tipu MACD and 50. On top of chart is the perfect entry. Trend trading you would rode the trend down and caught I don’t know probably 500 to 750 pips.
That’s how the Demo we dont touch goes into soooooo muchhhhh Profit by the End of the Month. We set it up and forget about it.
For Trading:
50 MA is only for me is a extra Guide so I see better what the market pairs are doing. The 50 Gauges the Strength of the Pair and long I have before it goes on Profit ( estimate only) if that
makes sense.
I am trying to be clear never went for all the technical terms in Forex although been trading for around three years. Like I say be patient.
Just follow the Trend use the 14/7 and follow the rules of this chart and don’t let the smaller times get you in a Trap.