Good morning Journal.
Let’s see. What am I gonna talk about?
Well, what I really want to do is make my way around the market. I haven’t done this in a while. This is my playground area where I can do this. Not only is this fun, but I kind of need to put things into the proper perspective in my brain. I honestly think the market is changing and I need talk about it. Look. I could be wrong. Very wrong. But I’m wanting to know. The future will come upon us and this is the place that I can always go back to and see in hindsight where I was wrong, in my thinking. And then again, if I’m correct about the future of things, I will be able to come back in here and see the whole before and after unraveling.
How else will I learn things, anyway?
Let’s go down the line. I’ll start with the most important and work my way down.
The USD.
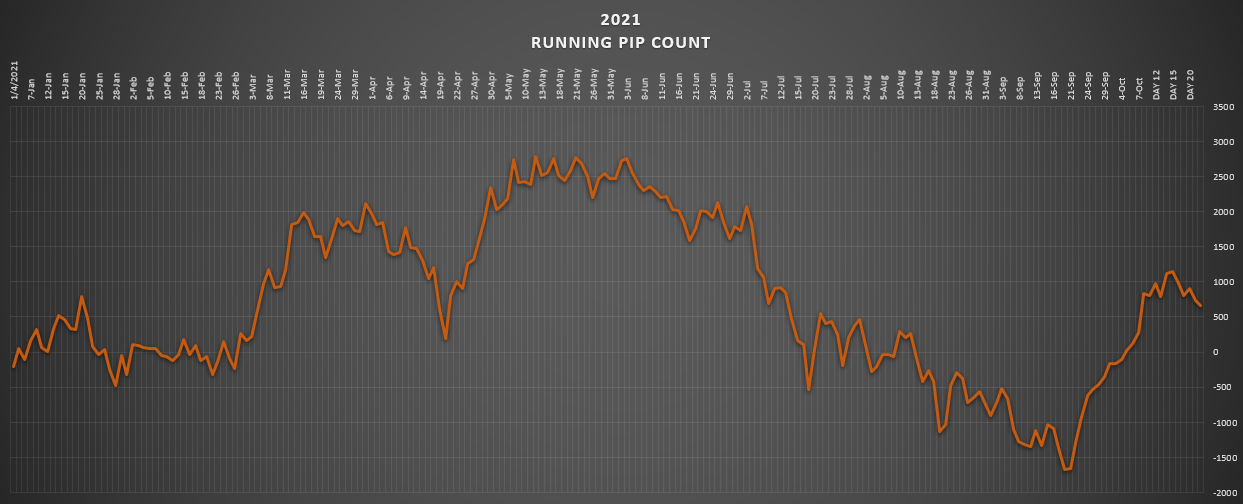
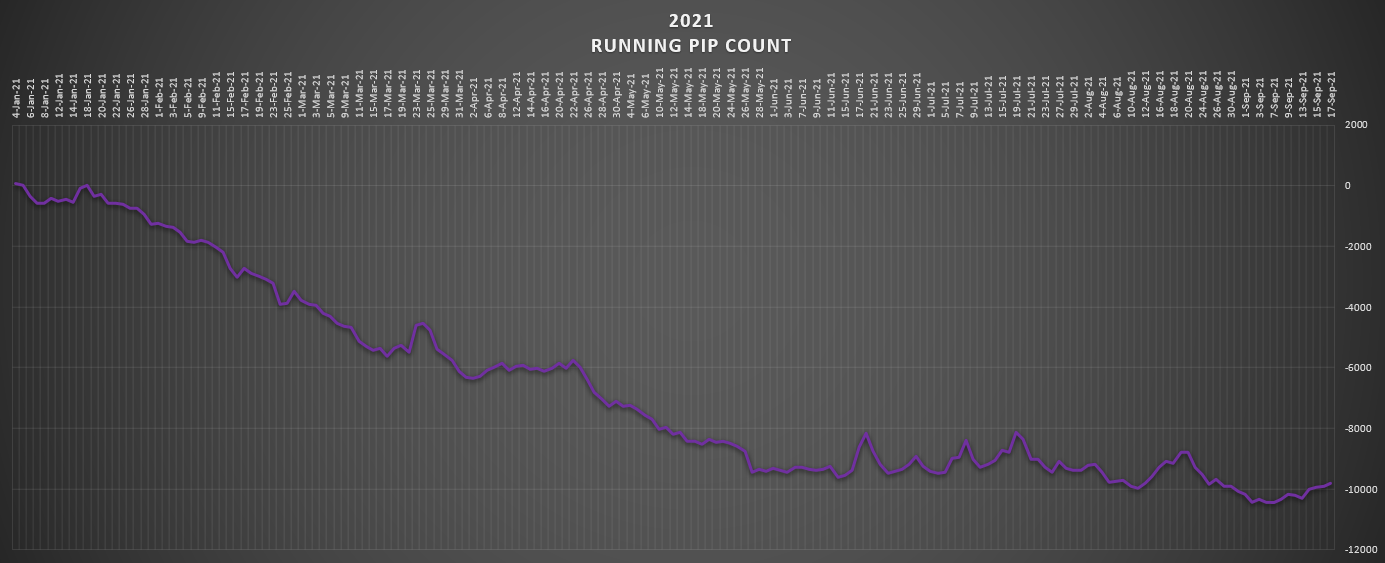
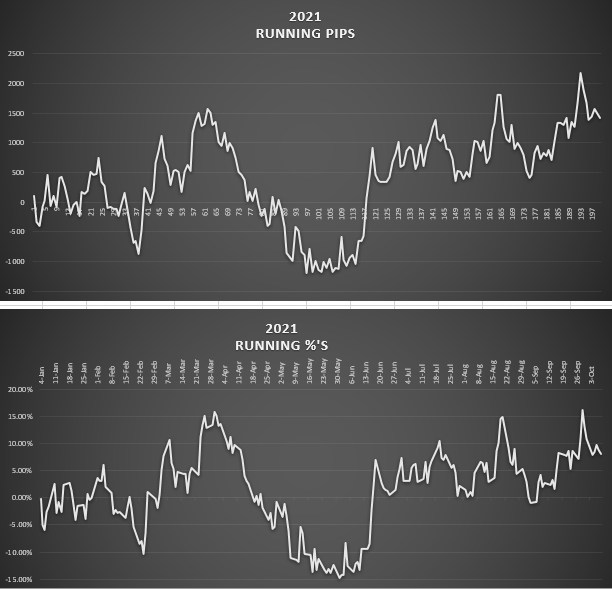
This is where we were last weekend at this time.

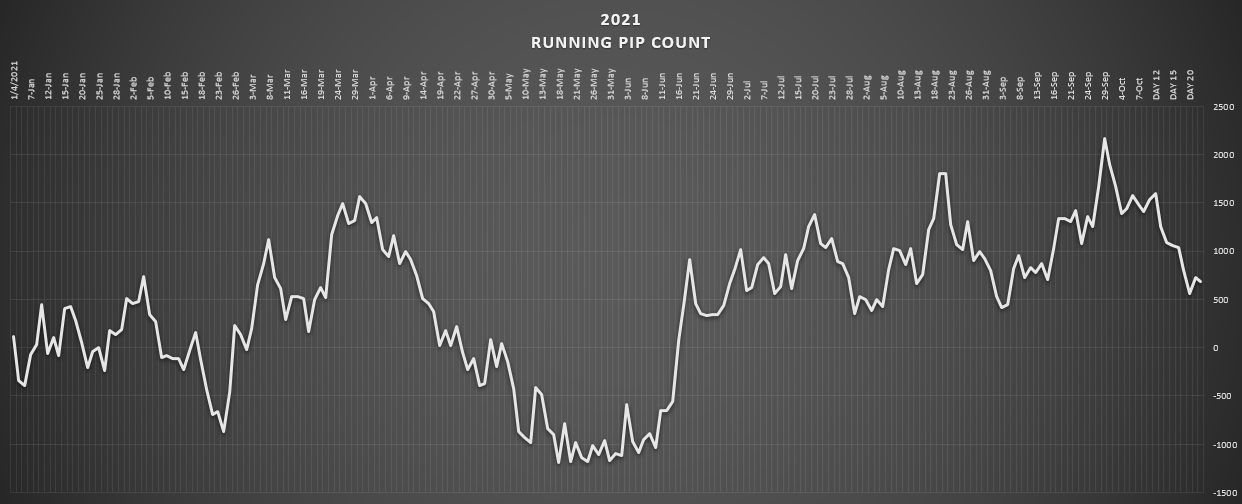
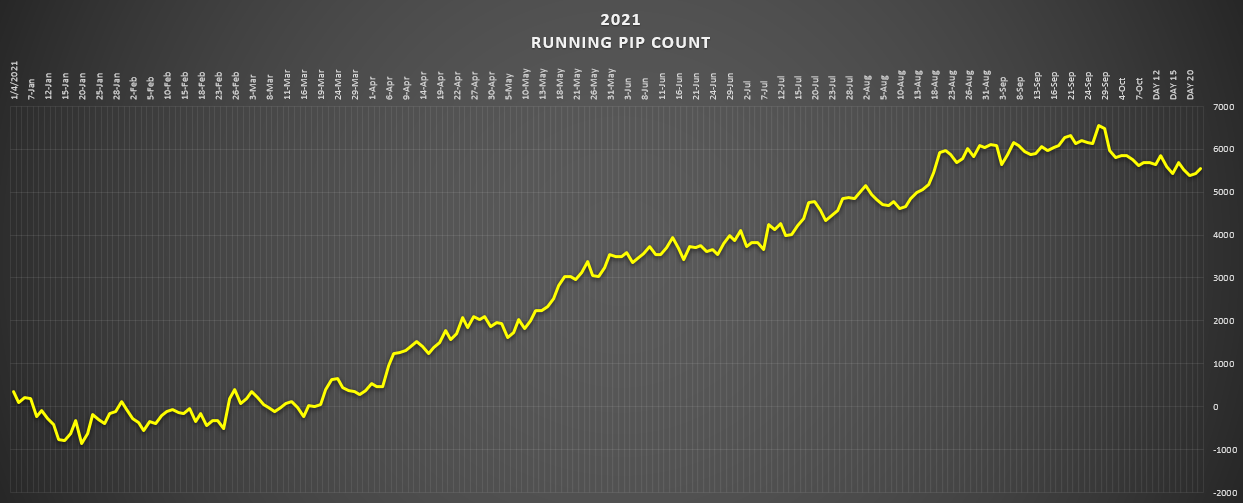
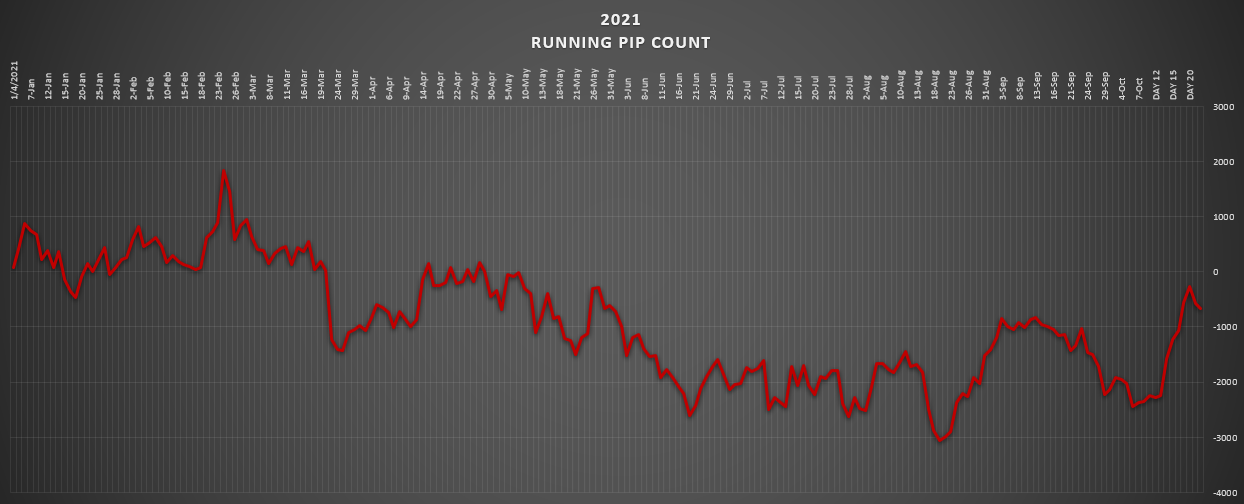
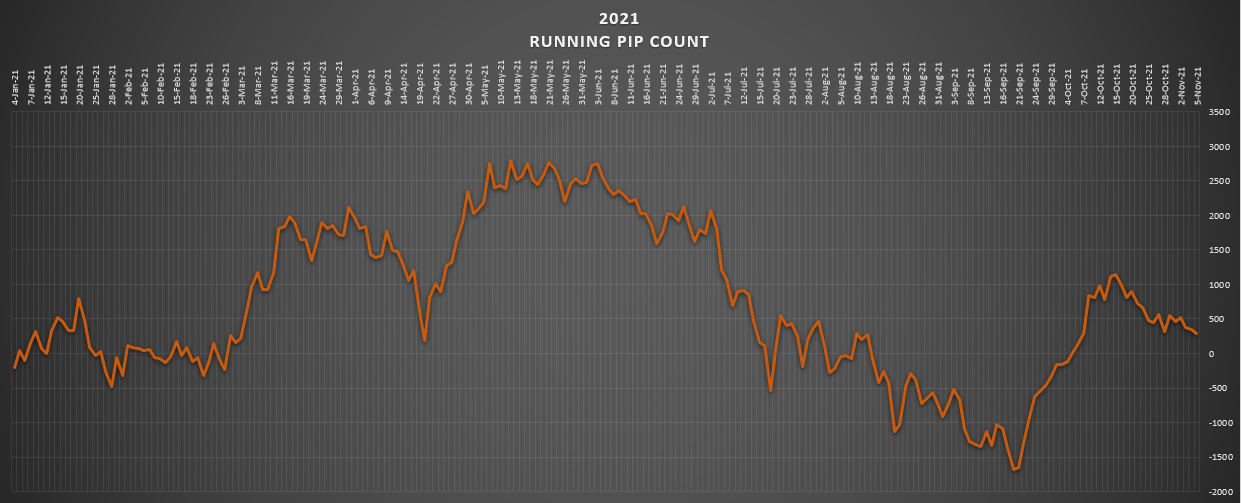
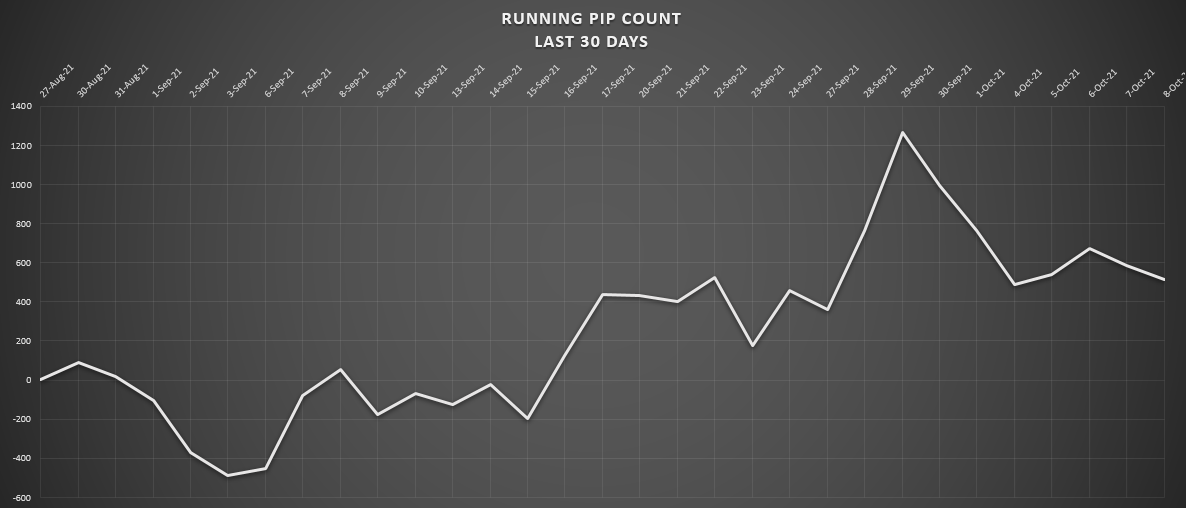
The USD aggregate tell. What I see here is an uptrend changing to a downtrend. I think a top was formed, and down it’s coming. The 1000 line I’m calling support broken. This was what I said. And believe. That most recent fall, I believe says it all.
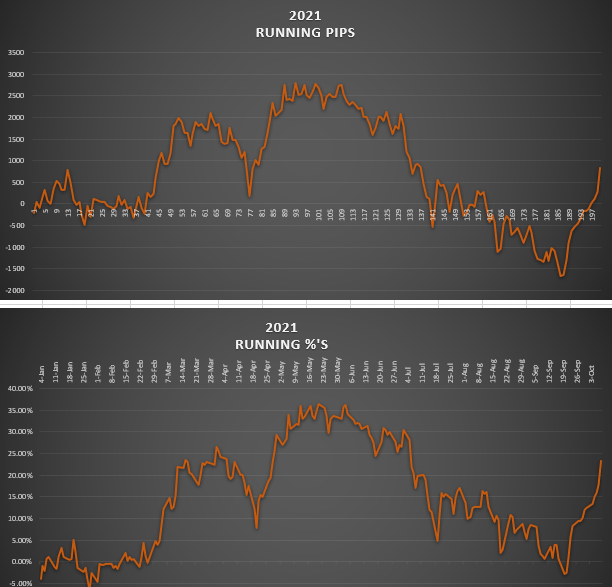
What happened this week?

This was up through Wednesday. The USD got strong. It retraced the losses. Ok. That makes all kind of sense. I’m not gonna change my mind just because of a little strength. That’s how the market works. But what I’m looking at is that 1000 line again. I believe that’s now a resistance level (previously support). And now we’ve come back up to it. Just look back at that 1000 line. How many times does it bounce on here? Too many, which tells me that it’s support or resistance. It’s all the same laws that are used on any other chart. I mean hey, if it goes higher, then I know I’m wrong. If it bounces, then my theory will be correct. Which is a change from an uptrend to a downtrend. Well, I believe it so much so that I’m gonna trade this. As I stated somewhere else, this was another indicator that shouted at me for an opportunity. Let’s see how the rest of the week went (2 days).
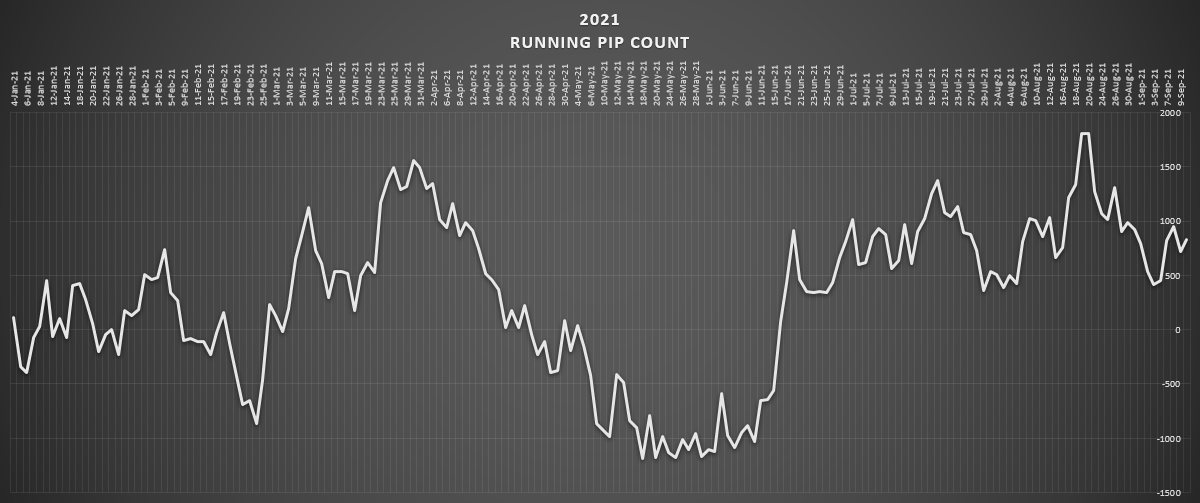
Thursday went down (second to last straight line). Then Friday went back up half of that. But this resistance level sure did hold the line. So my theory is still intact.
Which is, the USD on a change of trend.
I could be wrong. Always. And will always have that going through my mind. But I have to keep with the theory until it changes. For instance, that support level at the 500 line could very well hold and continue the USD for a continuation of the uptrend. Absolutely. But we haven’t gotten there yet. Until then though, I’m calling a downtrend for the USD. Because of that drop. That’s nasty! I don’t know, you got to read everything else on the chart, not just support and resistance levels. How about these dynamics of how price moves. Sure does look like moving down with a purpose, to me.
We’ll see though. I just think that this bull run that the USD had going ever since Jun 1st has run it’s course. That’s all. Plus, given the fundamentals surrounding the USA, that only makes sense to me. Who in their right mind throws money around like that? I mean, come on. That’ll be the day the UK does something like that. I mean, yeah, I know that the world is watching. And even doing the same thing, helicopter money flying. But this is ridiculous. We’re gonna pay for it. The laws of physics, finance, and everything else will eventually come to roost. We just don’t know when.
Sorry.
This is my macro sentiment concerning the USD. I’m calling the present time the USD in a downtrend. And when, or if, this changes, then so be it. I’ll be wrong. Won’t be the first time. I’ll admit it. I’ll look back on this and find out where I went wrong. And I’ll learn something by it. But this is my indicator. And I believe in it.
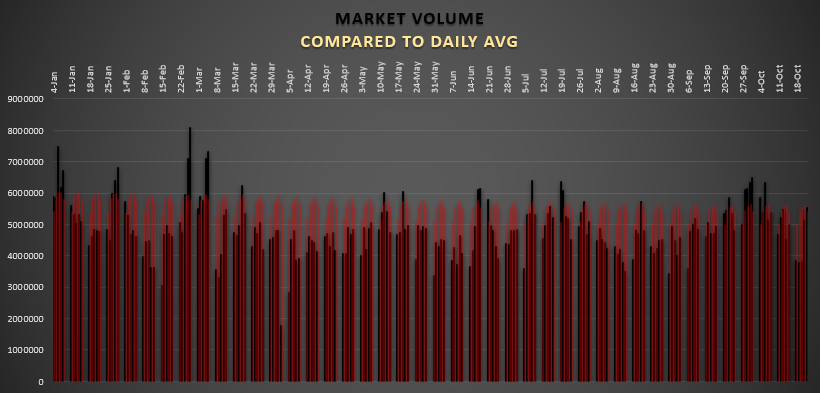
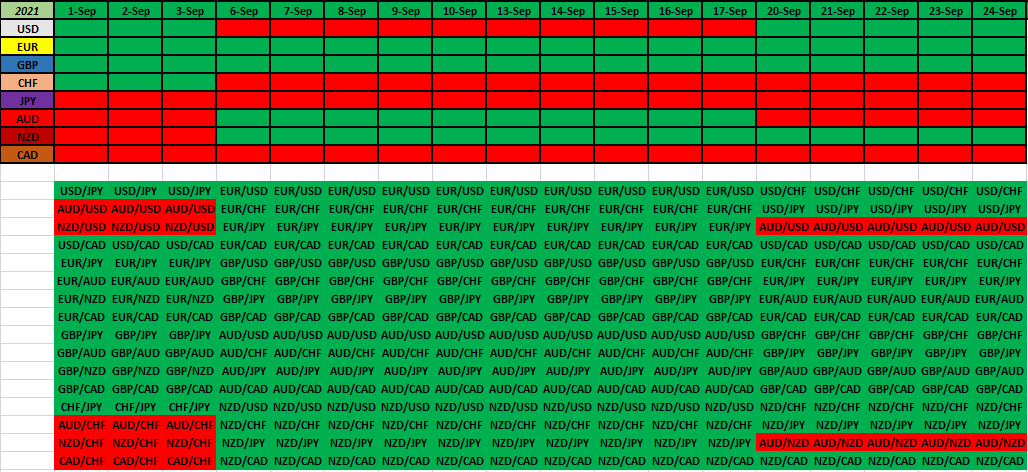
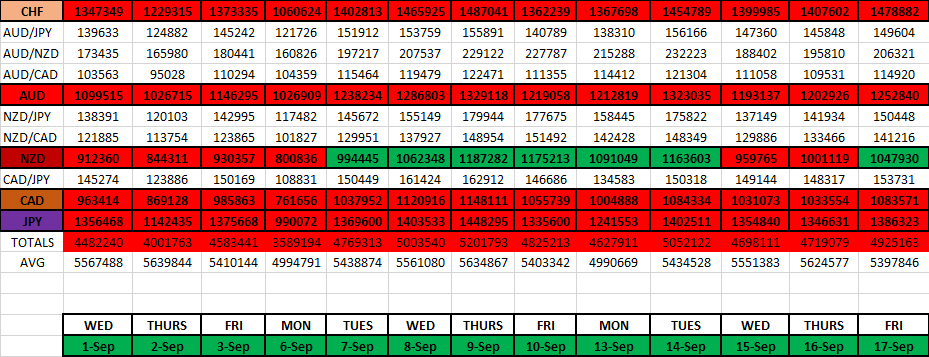
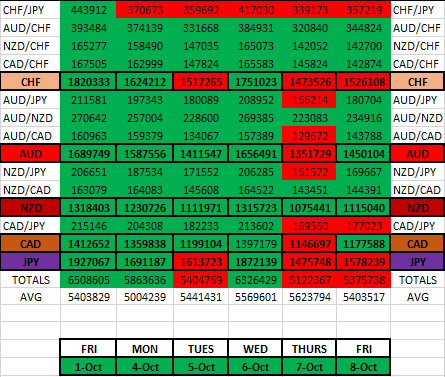
Well, I want to put to use this other indicator I’m starting to use. Here’s a shot of the volume that took place this week.
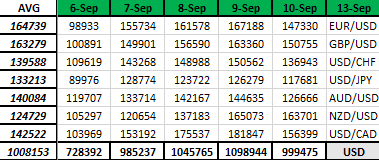
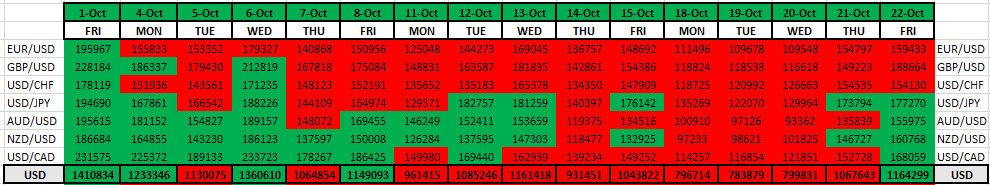
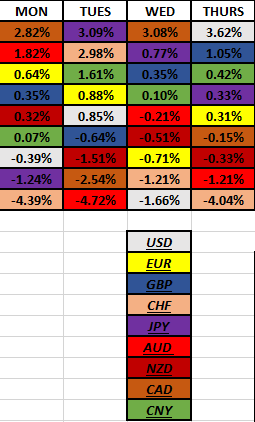
USD pairs. Daily results. With each pairs daily avg (on the left side). And the USD as a whole on the bottom. That daily avg is on the bottom left corner. And all I’m gonna do is compare what happened to it’s average. I just care about being more than it’s avg.
- Monday — Aggregate = below avg day. And every pair below it’s avg.
- Tuesday — Aggregate = below avg day.
2 pairs above their average. USD/CHF, and the USD/CAD. - Wednesday — Aggregate = above avg day.
4 pairs above avg (USD/CHF, AUD/USD, NZD/USD, USD/CAD). 3 pairs below avg (EUR/USD, GBP/USD, USD/JPY). - Thursday — Aggregate = above avg day.
6 pairs above avg (EUR/USD,GBP/USD, USD/CHF, AUD/USD, NZD/USD, USD/CAD). 1 pair below avg (USD/JPY). - Friday — Aggregate = below avg.
2 pairs above avg (NZD/USD, USD/CAD). 5 pairs below avg (EUR/USD,GBP/USD,USD/CHF,USD/JPY,AUD/USD).
I’ll tell you what I think is most interesting.
— The USD/CAD pair.
- 4 days above avg. The most of every pair. Monday was a holiday, or else it probably would be 5.
Let’s remember what happened with the USD this week. Aggregately speaking.
It rose up the entire first half of the week, through Wed. It was more of less avg volume. Then mid week the volume became greater. Well then, that was when the change, or turn, occurred. Then the volume decreased towards the end. Maybe I should write down these possible volume principles.
More volatility occurs during trend turns.
Less volatility occurs during trend flowing.
I don’t know. We’ll have to see if those should stand, as principles. I just don’t want to forget about this possibility, that’s all.
But the rest of the week, I feel, went to the Comms. Most of the above volume went to those pairs. And my theory of more risk on, in the market, just might be true.
I wonder whether this is true or not.
Risk-on results in more volatility.
Risk-off results in less volatility.
I have no idea. But I want to keep this in mind. I guess it could go either way.
Greed = more volatility?
Fear = more volatility?
Trend = more volatility?
Changing trends = more volatility?
This is what I’m out to answer.
Alright, let’s move on.
I’m done talking.
The EUR.

The trend is up. Long bias. Can’t be anything else. Cause they are not depreciating. It’s been that way all year long. And frankly, I’m getting tired of saying this. Cause the whole point of this is, to buy the EUR, not sell. Simple as that.
No changes are being signaled.
The GBP.
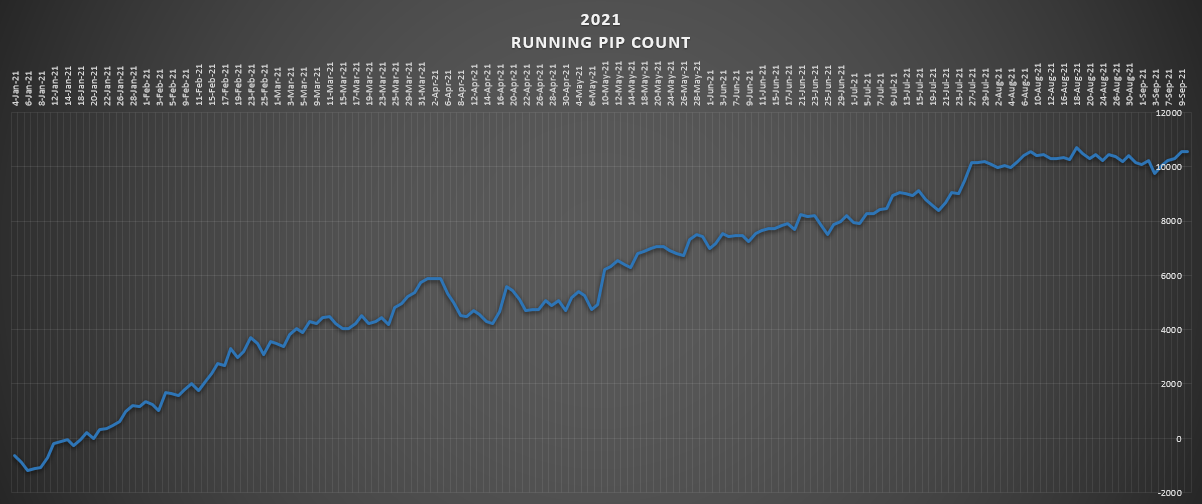
Technically speaking, their a bull bias. Uptrend in tact. But I got to say. It just might be wavering lately. Not making any higher highs. Leveling out. Took a dip this past week. But bounced right back in it. Modestly that is. So, the trend is up, but not as strong as it used to be, as it has been all year long.
The CHF.
Well, along with the USD, I called this a change in trend last weekend at this time. And the way it went this week, confirms the theory. It bounced at some support, and we need to see where it goes from here. I knew this was premature to call a change in trend, but I had to go with it. So far, so good. A double top formed.
Maybe I didn’t officially make the call last week, in here anyway. But I made these trend changes. Look.

I go a week at a time. I won’t change trends mid week.
Moving on.
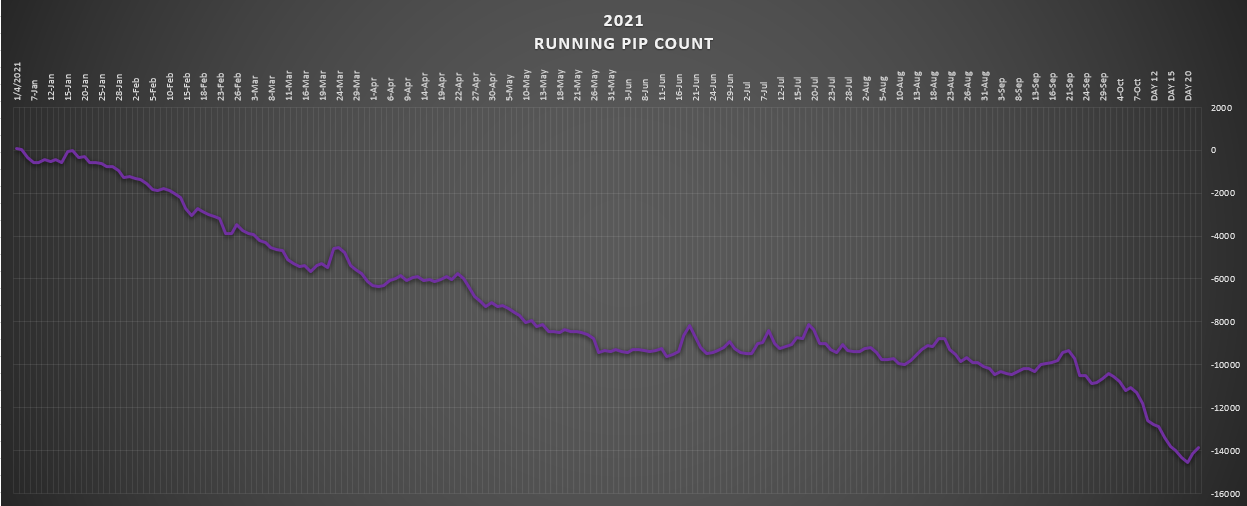
The JPY.

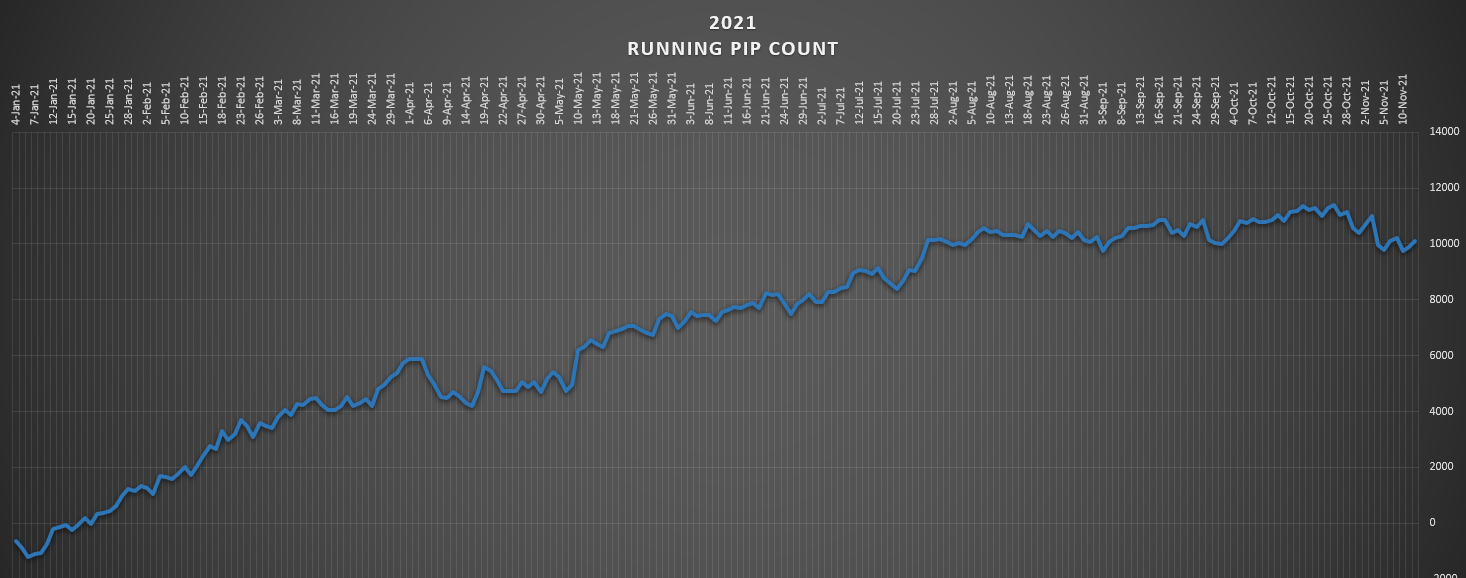
The trend is low. Sure, they tried to fool you with looking like making a floor for a good many months there. But nope. The market is keeping with the prevailing down trend that’s been in place the entire year. Simple as that. And for the record, I never called a change in trend, until it would reach that -8000 level line. It never did. Got to see it first, right?
Now it’s gonna get interesting.
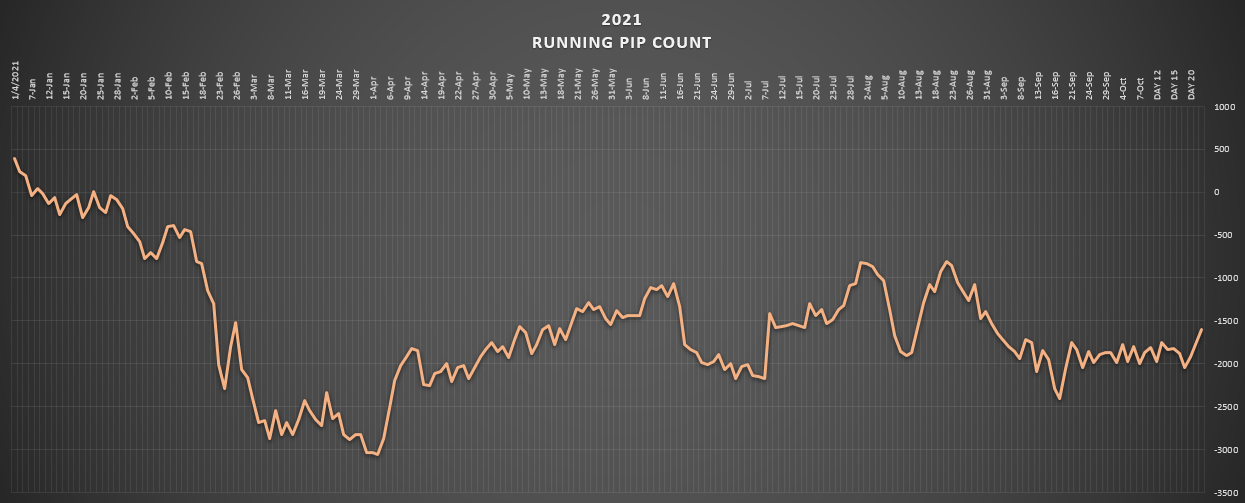
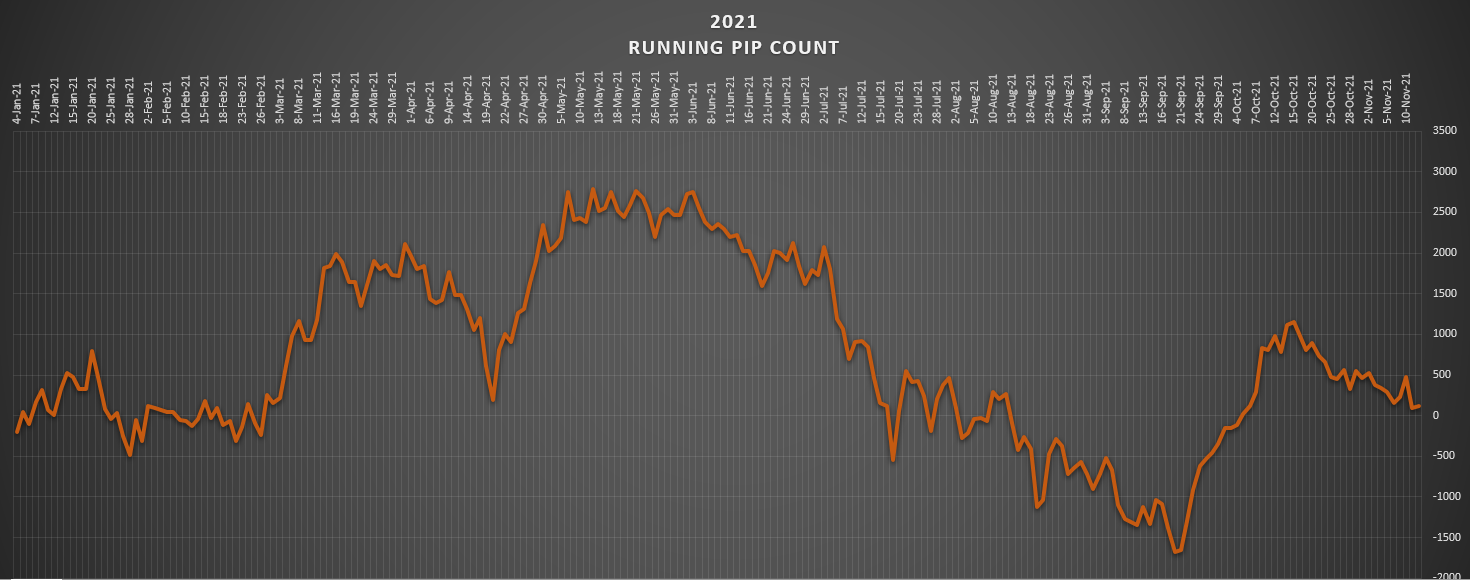
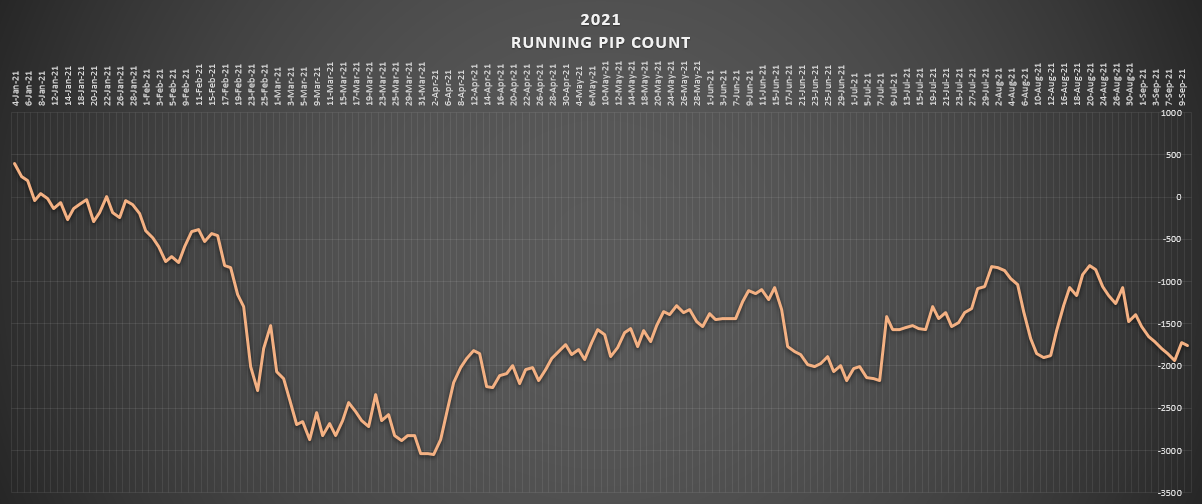
The AUD.

I did change their trend from low to high last weekend. But they took quite a dive this week. And I am calling that -3000 line the resistance / support level. And that’s where they’re at right now. Sure, a bit under it at the present moment. But I’m calling where we are at the inflection point. Surely this coming week will be the tell. Will we have the resistance level turn support (-3000 line)?
That’s what I think.
But the market will tell me the truth.
If I have to change back their bull trend to bear, then so be it. But I got to see it first.
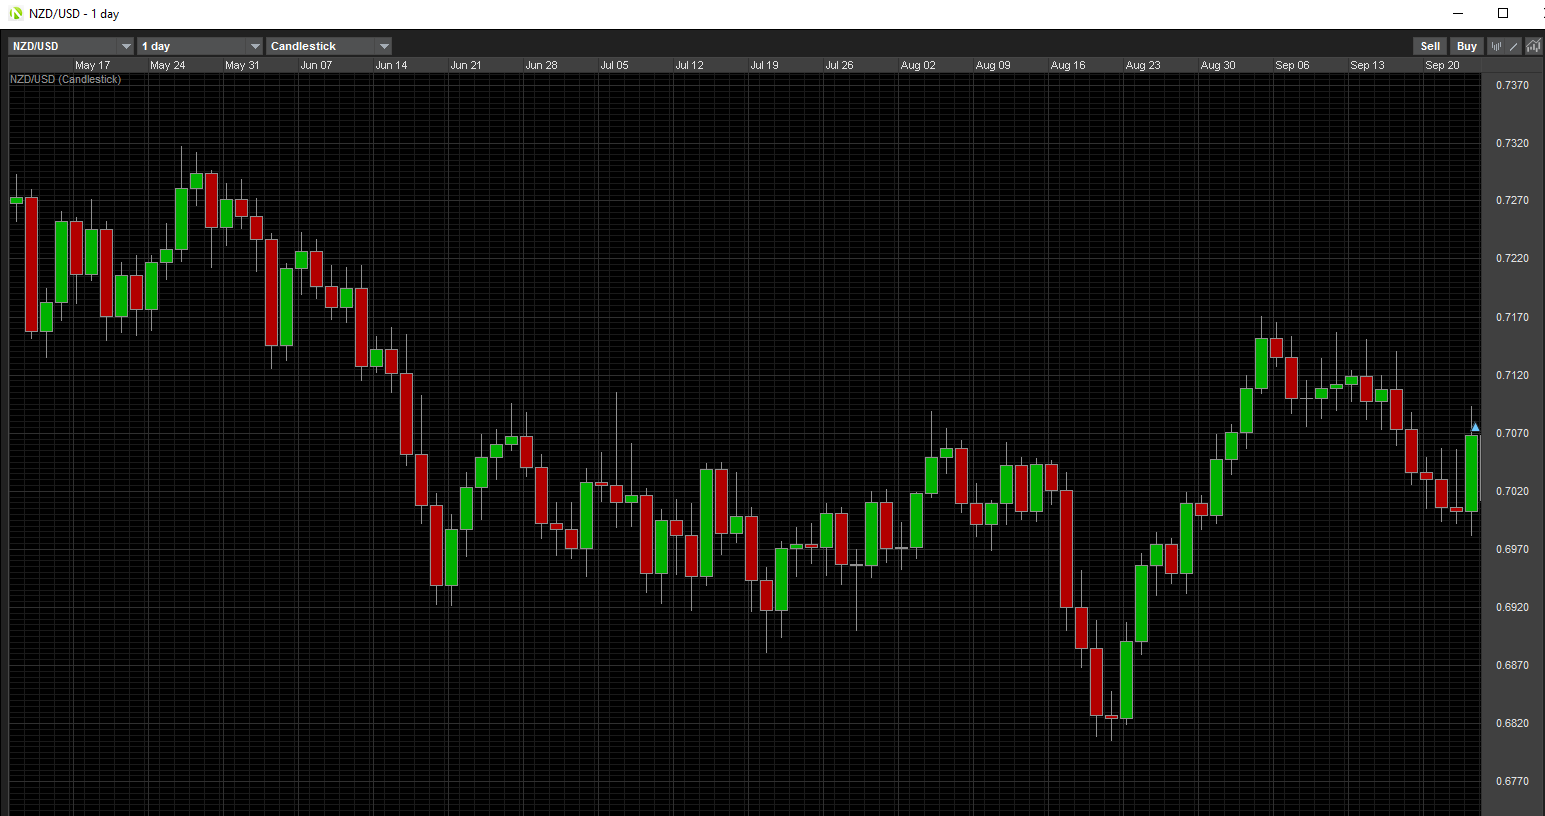
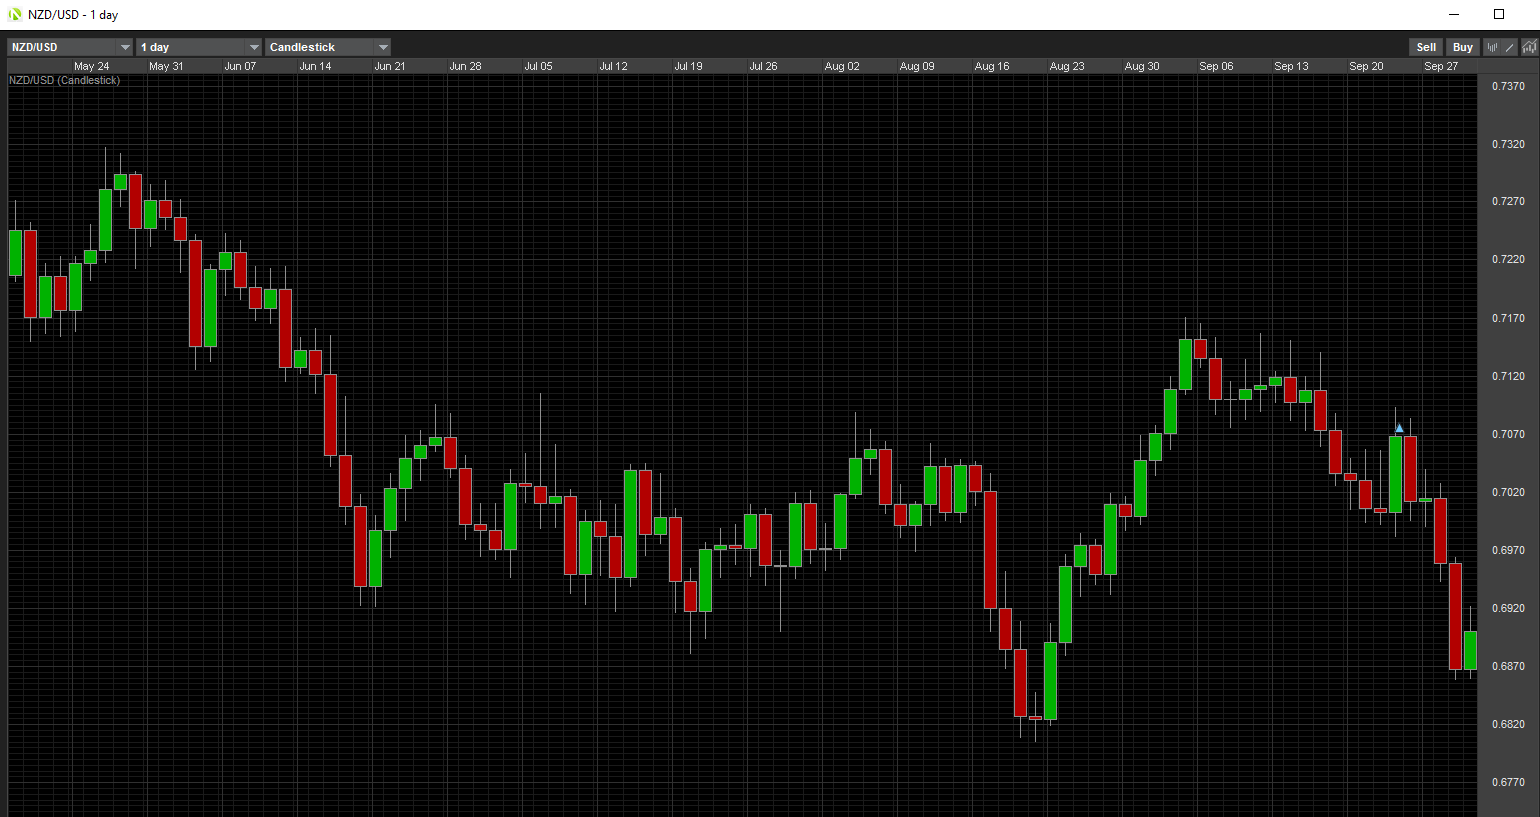
The NZD is some kind of factor, also. Little brother just might have something to say.

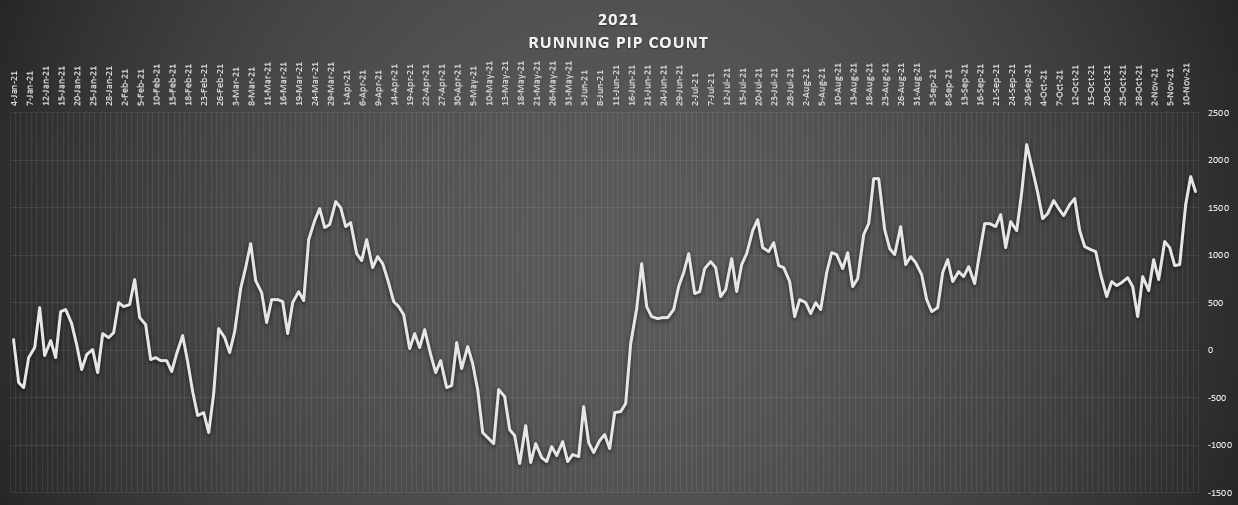
Uptrend. They broke up and over the -1500 line. I was calling that resistance.
But what divergence to the AUD, huh? But this is the reason why I think the Comms will take over the bias, broadly speaking. It is this chart. The NZD is strong. Their trend has finally changed. Up to this point anyway. It’s been a long time coming. Their down trend has been ever since the end of Feb. So. Now’s a good time for it. Maybe it’ll go all the way to the end of the year. We’ll have to see.
Look. It’s just what I’m seeing right now. Can they go to where they started the year from? That would be from the 0 line. It only takes about 2 weeks for them to consume 1000 pips. Got plenty of time before the end of the year for that to be accomplished. No problem buddy. Let’s just see what happens.
The CAD.

The down trend continues. And I won’t call anything different till this chart reaches above the 0 line, minimum. Man…I just don’t know what happened to the CAD. It’s not because of the oil, is it? That’s been a mostly bullish market. And being the favored trading partner to the US, that shouldn’t have given them reason to fall apart like that. So therefore, the only reason I see is from their own internal fundamentals. They rely so much on their export business that maybe it’s the supply chain issues. I just don’t know. But something’s got to be behind all that. Maybe even their own central bank, who knows. All I know is, it’s a trend. And that’s what we like the most…a trend to continue. Maybe that’s what they want, a devalued CAD. Cause we all know that that is not always a bad thing! In fact, that’ll help with their trade competition.
Anyway.
That’s all of them.
I’m not going to change any of these trends. The only one in question is the AUD. That’s gonna be settled this coming week.
And if I see a rising AUD, then that’ll be my cue for a trade. Long AUD.
But then short who?
Well, who’s trending low?
I showed you all their stated trends above.
There’s 4 of them.
- USD
- CHF
- JPY
- CAD
Ok fine then. I’ll go through these with you.
Let’s see. From the top.
AUD/USD.
I first look at the weekly chart.

Nicely looking. Those 2 weeks of gains tell me the buyers have been in town. And a nice retracement last week brings it back to a cheaper place. Actually, is it sitting on some kind of level now. If it’s a resistance level (downtrend in place), then it should go back on down. But if it turned into a support level, then a change in trend would occur. Well, that’s what I’m thinking is going to happen.
My trading plan consists of waiting till a minimum of Wed to see the direction. So, I’m not gonna chance anything until around then. But how about the daily chart.

There’s, easily, a hundred pips up to that most recent swing high. Anything is tradable in between now and that point. No doubt. But I got to see how the week goes first.
Next.
AUD/CHF.

Kind of looks the same as the previous. Weekly. But then again, this might be sitting up higher than where the support level is at. I think it’s at .6650 area. And my o my are they 2 pretty big green candles. Telling me some good buying been going on there. No wicks. Right?
Daily chart.

Well, this latest swing high reaches higher than the previous swing high. Encouraging. Telling me that it can go higher. Maybe the next real resistance level is at the .6910 area. So basically, I think it has room to go, if it wants. So again, promising. I kind of like this better than against the USD.
Next.
AUD/JPY.
Weekly.

Same thing. Came back down to the level (one of them). That retracement surely makes for a good place to get in, if it starts to move up. But look at the Daily chart.

I think anything between 81.00 & 82.00 looks good. But that daily wick spike up looks good. Sure, someone would say that it’s a hammer (or something like that). Which signifies a move down. I don’t necessarily agree. At all. I think price tested the waters up there. And could possibly go back up there. If I was a day trader, this would be on my radar, for sure. But again, I have to see how the week is playing out first.
Time.
It’s the biggest factor in trading.
Not where.
But that happens to be what I’m talking about right now. Is where.
Time is more important to me though.
One more.
AUD/CAD.
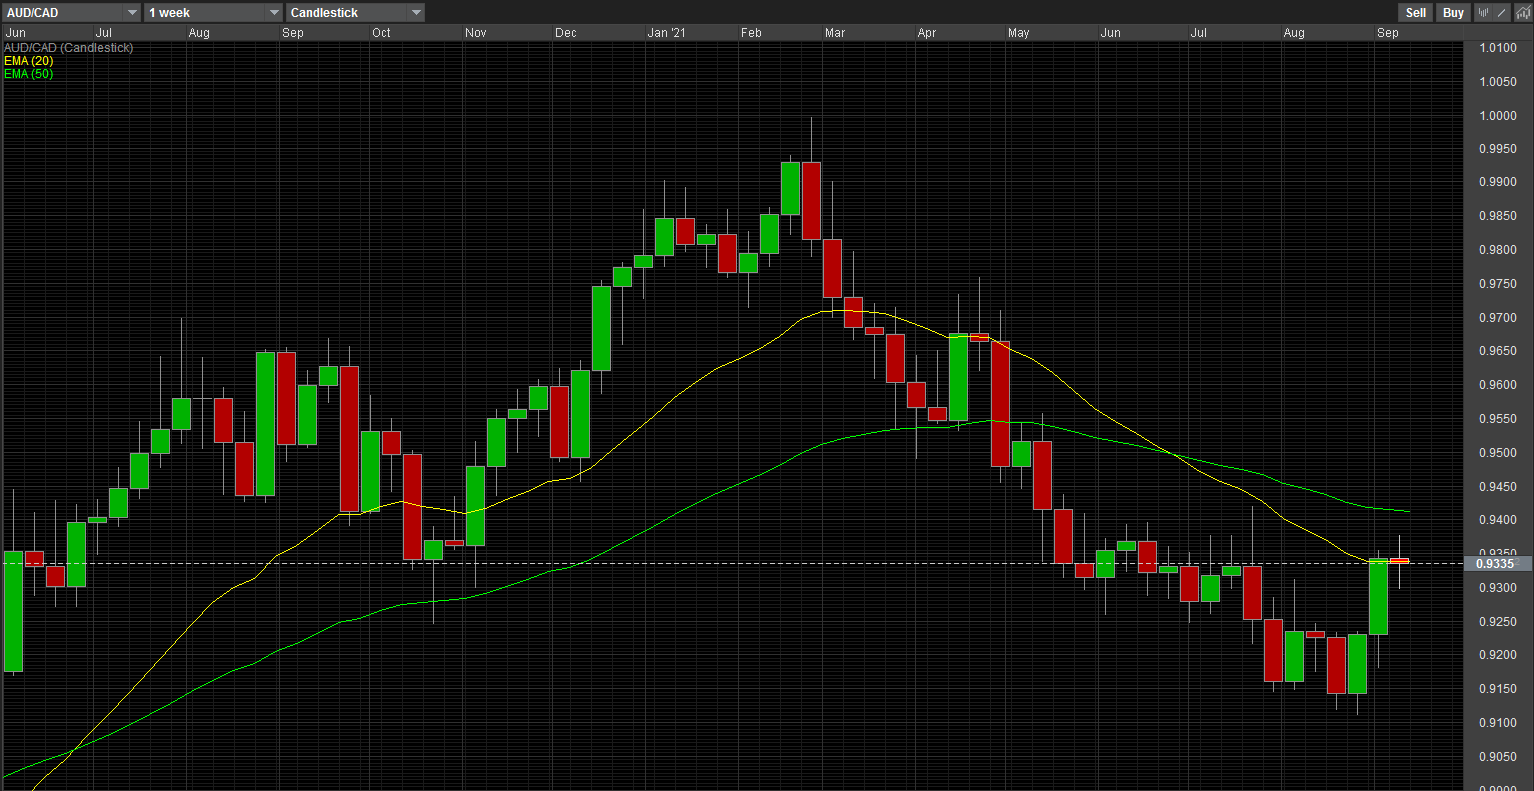
This definitely is at a major level. It might stay around here for a time, who knows. If, somehow, it takes off from around here, then I’d say the trend would be strong. Either way. North…a definite change in trend. South…a continuation. But I think it’ll hang out around here for a while. Someone likes it here. We’ll have to see.
Daily.

I don’t see a whole lot. Other than the fact of the 20 about to cross over the 50 soon. As an indicator, that should mean something. But in regards to price action, I got nothing.
Zoomed out.

I don’t know. I’m not a fan. Price action doesn’t show me anything. Ok. .9540 area is where it’ll shoot for next, if it wants to go high. 200 pips away.
Honestly, I’m afraid to trade the CAD. Let’s just say that there’s better chances with many other pairs out there than these guys. I mean, are they one of the Comms currencies? Sometimes they are, sometimes they aren’t. Their just not that cut and dry anymore (like they used to be).
Ok. So. That’ll be 3 pairs on my radar then.
See. This is my preparation for the week.
Couple things.
- Risk on to make a real come back.
- Need to see the market flow in the first 3 days of the week.
- Have my 3 pairs that I’m particularly watching.
This about sums up my trading for the week.
If all hell breaks loose, and we have the safe havens take over, then so be it.
I don’t mind being wrong whatsoever. It’s just that I need a certain scenario to play out. If I don’t see it, then I won’t trade. Simple as that.
And hey, if I have to change all my trends back to where they were 2 weeks ago, then I will. I’ve been wrong before, I will be wrong again. But if I am, I will get to the bottom of why. Maybe the market doesn’t know the breadth of how dire the world’s situation really is. And then go back to some big time USD buying, JPY buying, and CHF. Could happen, but I got to see it first, though.
I follow.
Not speculate.
Alright Journal, I’m done babbling.
Sorry for all that nonsense.
Thanks for listening though.
Mike


 ]
]