This thread has kind of evolved into more of a live journal and how I view trading. I now want to have a thread that gives insight on the psychological side of trading and having the right mindset. Along with posting charts and going through trades as well. I have links to videos I find useful and will add more as we go through the weeks. But I think fear is what keeps people from being successful traders. If not, they why if everyone is reading the same books and using strategies they have learned from pros and such that we still lose(brokers websites usually state over 70% with negative account balances)? It starts with your mindset, letting fear dictate your trading decisions rather than your strategy(trading plan). You’ll notice if you was to start at post 2 and go through you’ll see how my trading has evolved and changed but keeps some core values while also dealing with fear. Hopefully someone will get some use from this thread and we can walk this road together as we learn and grow.
Where I started:
Where I started, but have evolved. But this thread really helped me get going in a good direction. It’s a very simple strategy, requires patience and discipline. Price action but only using a few candlestick patterns to enter at certain levels. Which is very effective(well was for me). Also he isn’t active anymore on Babypips and seems his website isn’t ran by him anymore as well. But still a good thread.
I backtested for about 6 months before I started trading live with this strategy.
Read through the first 3000 or so pages and built it from there, I have a few different changes I do.
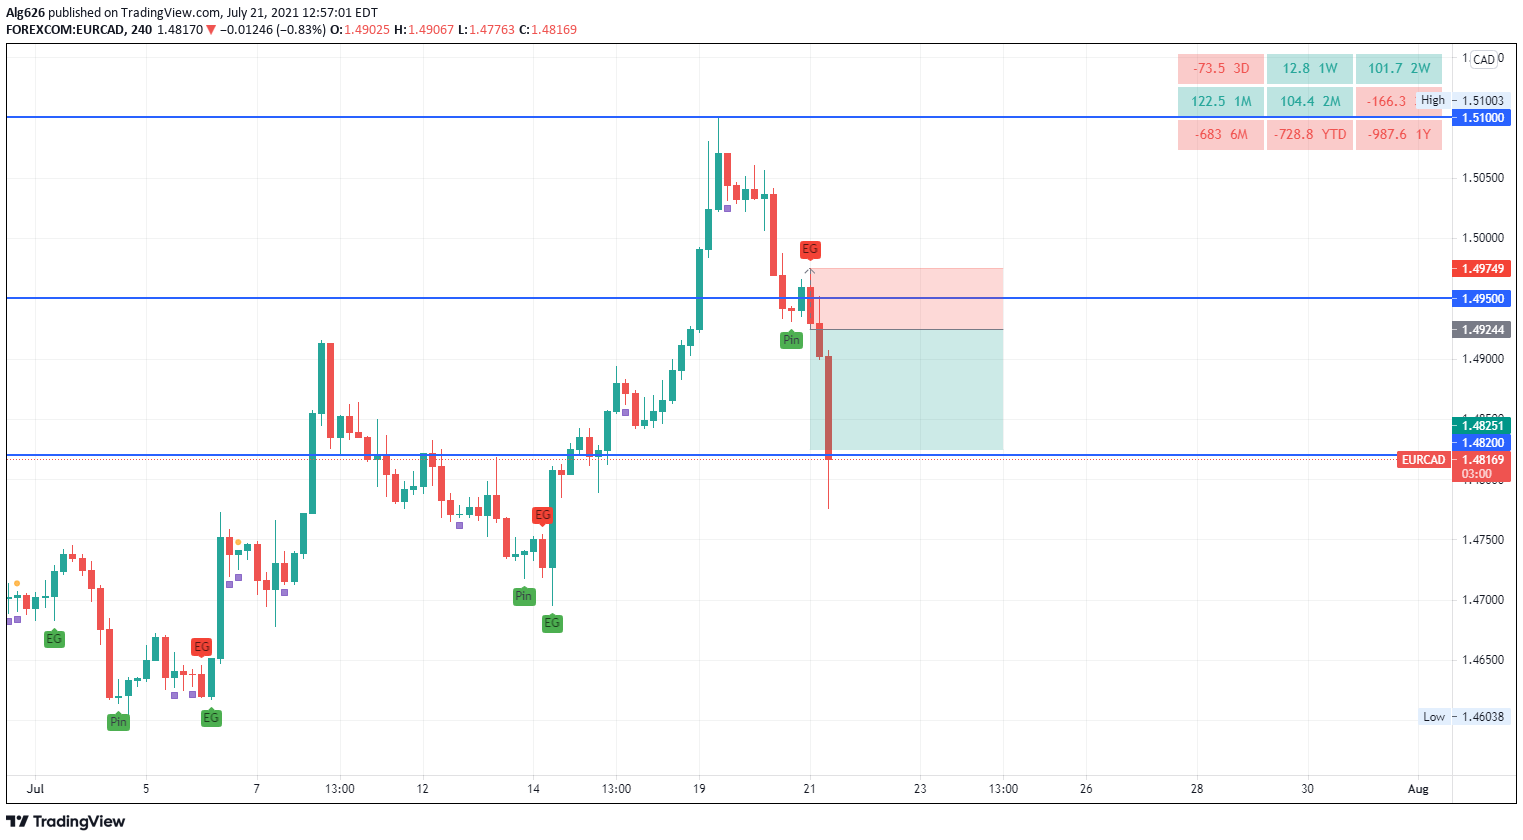
I trade based off support and resistance zones(usually placed around round numbers). Though I don’t wait on them to enter but if I see an engulfing(outside bar really), pin bar, and 2 bar reversal at a good level I’ll enter as well. Along with seeing the chart and what the whole picture says, just don’t trade based on a candlestick pattern but use them as a level of confirmation.
I also incorporate supply and demand into my trading, paying mind to when price really takes off from and if it comes back to that area. I’ll watch and see how price reacts and may enter a trade there as well.
Backtesting:
Make sure your strategy works. Backtest it like crazy, if you have some way to do chart replay so you can’t cheat and see the results before entering a trade. That will help with knowing how accurate your system really is. Also work on your exit strategy as you do. But nothing can take the place of live trading, experience and time is what is needed on the charts along with an understanding of what goes on behind the numbers. But for someone who is brand new just focus on learning important levels first whether its supply and demand or support and resistance.
Timeframes:
I also recommend anyone pretty new at it to start on the Daily or at least no lower than 4HR time frame. The lower the time frame the faster the data is moving which doesn’t give you much time to react. So I think it may be a little better for someone starting out to start on a higher time frame then work your way down. Price action doesn’t change based on time frame, just the speed it happens.
FTMO:
I am a funded trader through FTMO. Yes they are a legit company. Yes I failed the first 4 times I took the challenge(didn’t have any business taking the challenges, was not where I needed to be). And 10% in 20-22 trading days with their drawdown limits can be tough. So wouldn’t tell beginners to try FTMO. Backtest, and journal so you can review your strategy.
And no I don’t have a link I’m trying to get you to sign-up with them. I have no affiliation with any broker or prop firm.
If you’re trying to pass a prop firm or even if you’re not.
Don’t try and rush through and take trades because you’re on a time-frame. Let the market come to you. Trade what you see not what you think it should do or will do. There are plenty of opportunities in a week. So don’t take a trade if not a good setup. Another is always around the corner even if you have to wait a day or two.
Emotions:
Emotions have always been the toughest for me in this. Nailing down a strategy was way easier in my eyes lol. I have plenty of backtesting to know mine works just have to let the trades play out and stick to the trading plan as the trade unfolds.
Sometimes you end up getting caught in maybe a false breakout or such. There isn’t a trader in the world that hasn’t been caught in one before. Just the name of the game, it happens so get use to it. In fact get use to losing, fear is what causes a lot and I mean a lot of traders to fail including myself. There is not a chart pattern, a book, a mentor or nothing but yourself that can wage that battle for you. You just have to go through it and learn how to deal with fear and not let it drive your trading decisions. I have to do that everyday.
Some others I have read or traders I look at.
-
Chris Caprie, he also has a thread here. Don’t think he is active but it’s still a good thread I think
Understanding Price Action by Chris Capre -
Johnathon Fox, he also isn’t active anymore I believe. But this is where I built my trading plan and strategy
Forex Price Action -
Tradertom.com, nice site and doesn’t cost anything. The more I follow this guy the more I am liking him, he does also focus on the psychology side of things as well. His name is Tom Hougaard.
-
The James16 thread from the other site. (don’t want to get in trouble lol)
How I set up my charts, look for entries and exit trades.
• Trade off 4HR charts. Set my entries and stops based off the 4HR chart.
• Look for reversals and trend continuation (after breaking through a zone and retesting). Will also do a little more aggressive set up if it looks the price is really moving through a zone, but has to close through it first.
• Support and Resistance: Usually place them around a round number. No one ever says “hey, you think AUDCAD will get to 0.93156?”. No, usually in conversation traders talk in round numbers such as 0.93000. Doesn’t mean it always happens like that but the important zones are usually around round numbers. I also use the Daily and 4HR to draw my support and resistance zones.
• Go through the Daily chart first marking zones, those are the green lines. Then go through the 4HR chart marking zones, those are the blue lines. I do my chart zones usually on the weekend, may take an 1-2 hours. If one is broken I make adjustments as needed. I also incorporate supply and demand zones in my charts as well, you’ll see them sometimes marked by having a box draw around.


This is how I will approach supply and demand zones as well. Even in the charts above you could spot the supply/demand zones and accumulation of orders. Also note that not all supply/ demand zones line up with support/ resistance.

• Remember all zones are going to fail sometime or another. So don’t get too attached to one. Just read the chart and see what the price is doing. Have a trading plan but don’t be so biased that it keeps you from being profitable.
Entry:
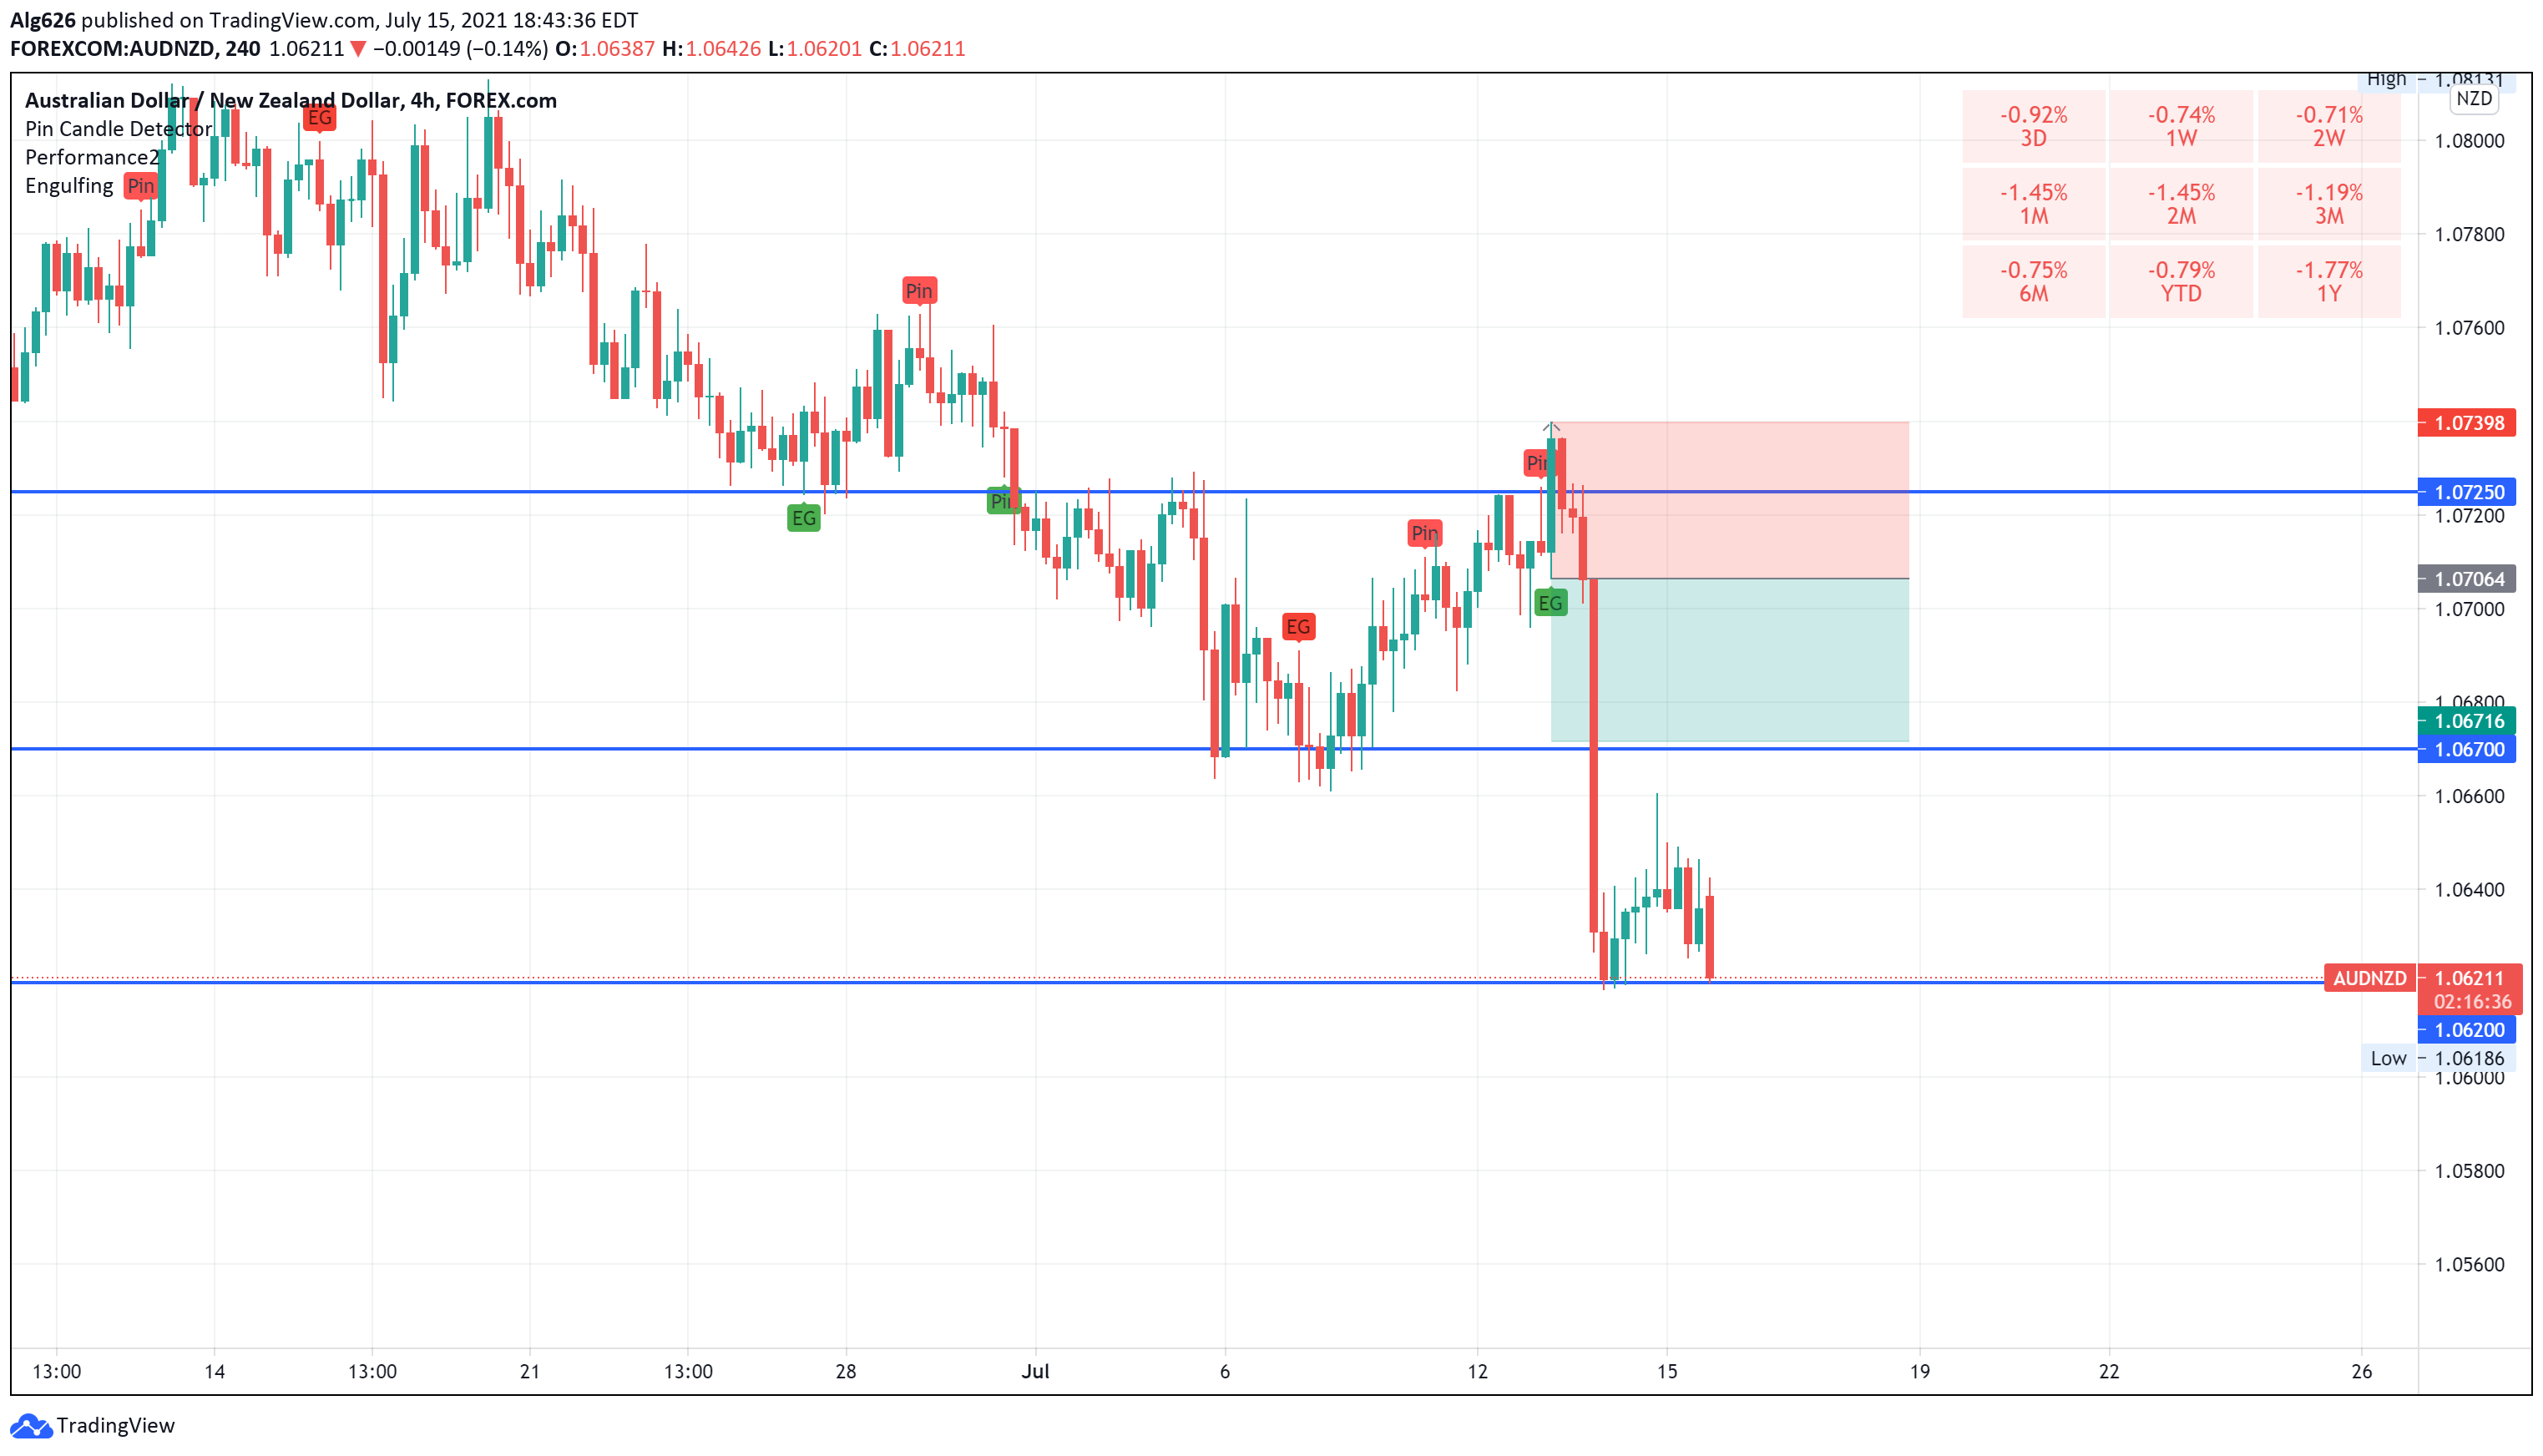
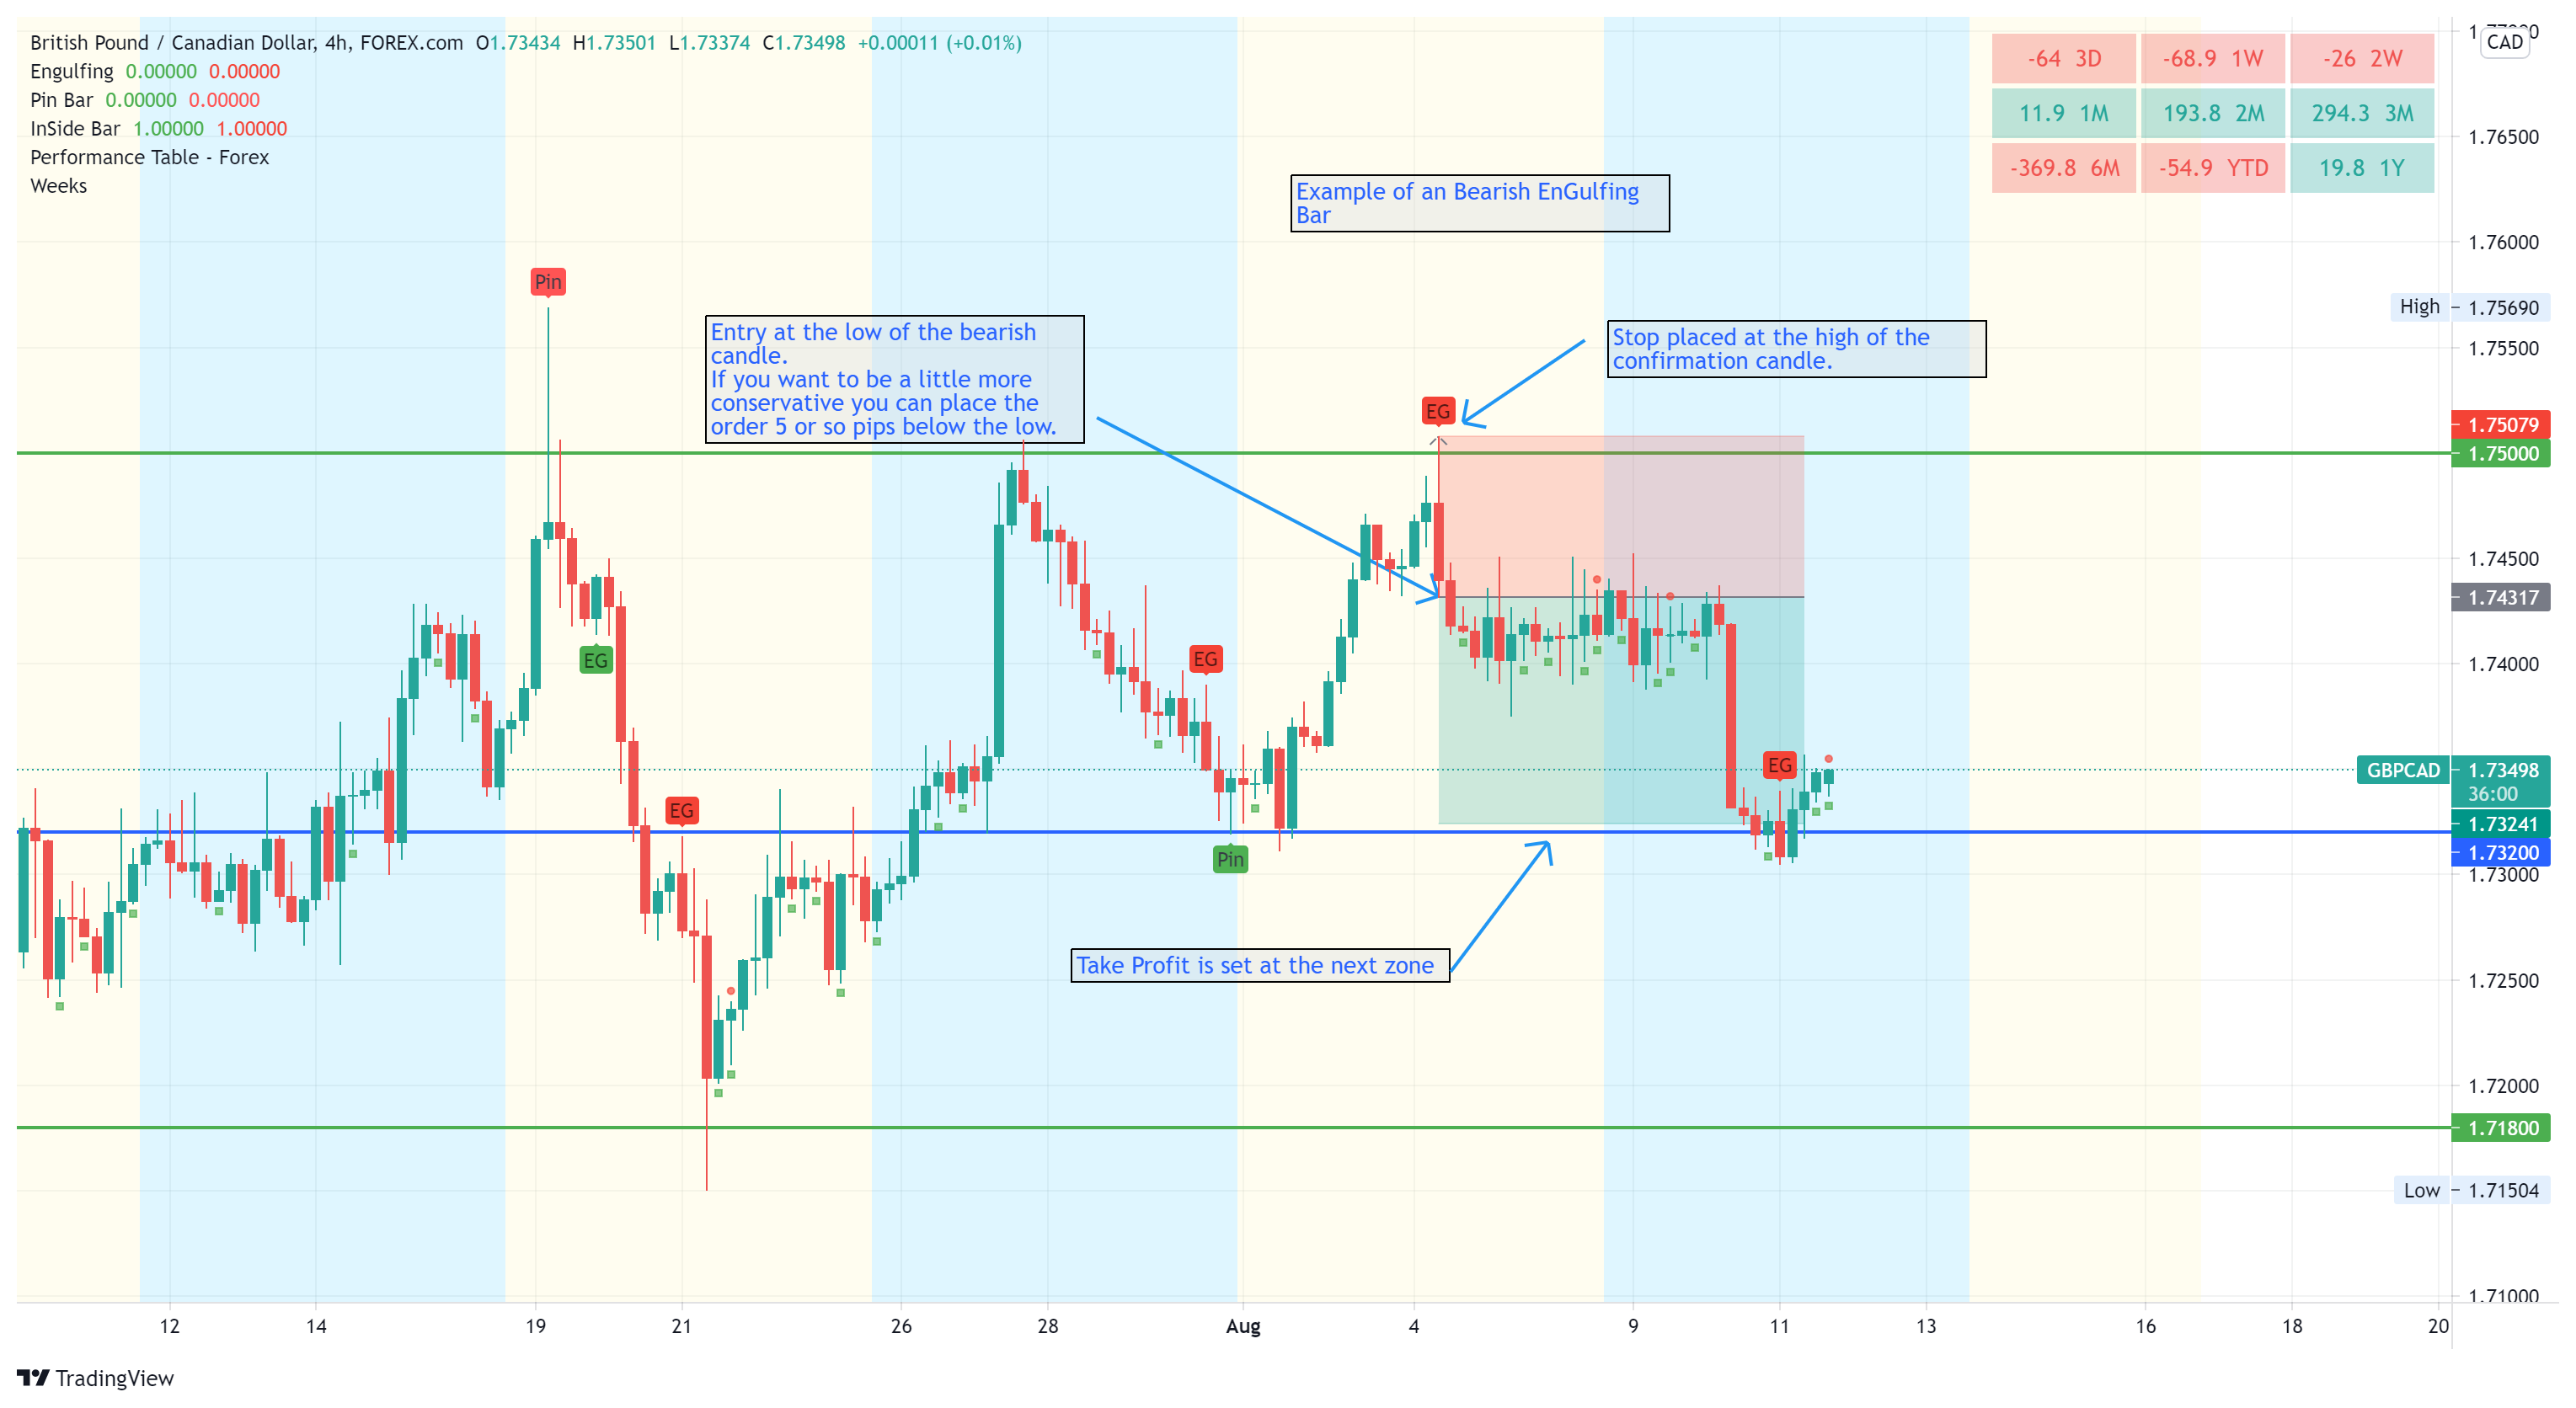
• I use this if I’m entering based off a EG, Pin, or 2 Bar Reversal or if price has broken through a zone and I’m looking to get in. Entry of a trade is placed at the high/low of entry candle, with the stop being placed at the other. So if it’s a bullish candle and our position is long the order is placed at the high and the stop loss is placed at the low of the confirmation candle.
• Some Entries are based on where price is and how the price action is looking. Those times I don’t wait for a certain candle I enter once my trade has been validated or have orders ready. You will see purple lines on my charts, those are where I may enter a trade.
Exit:
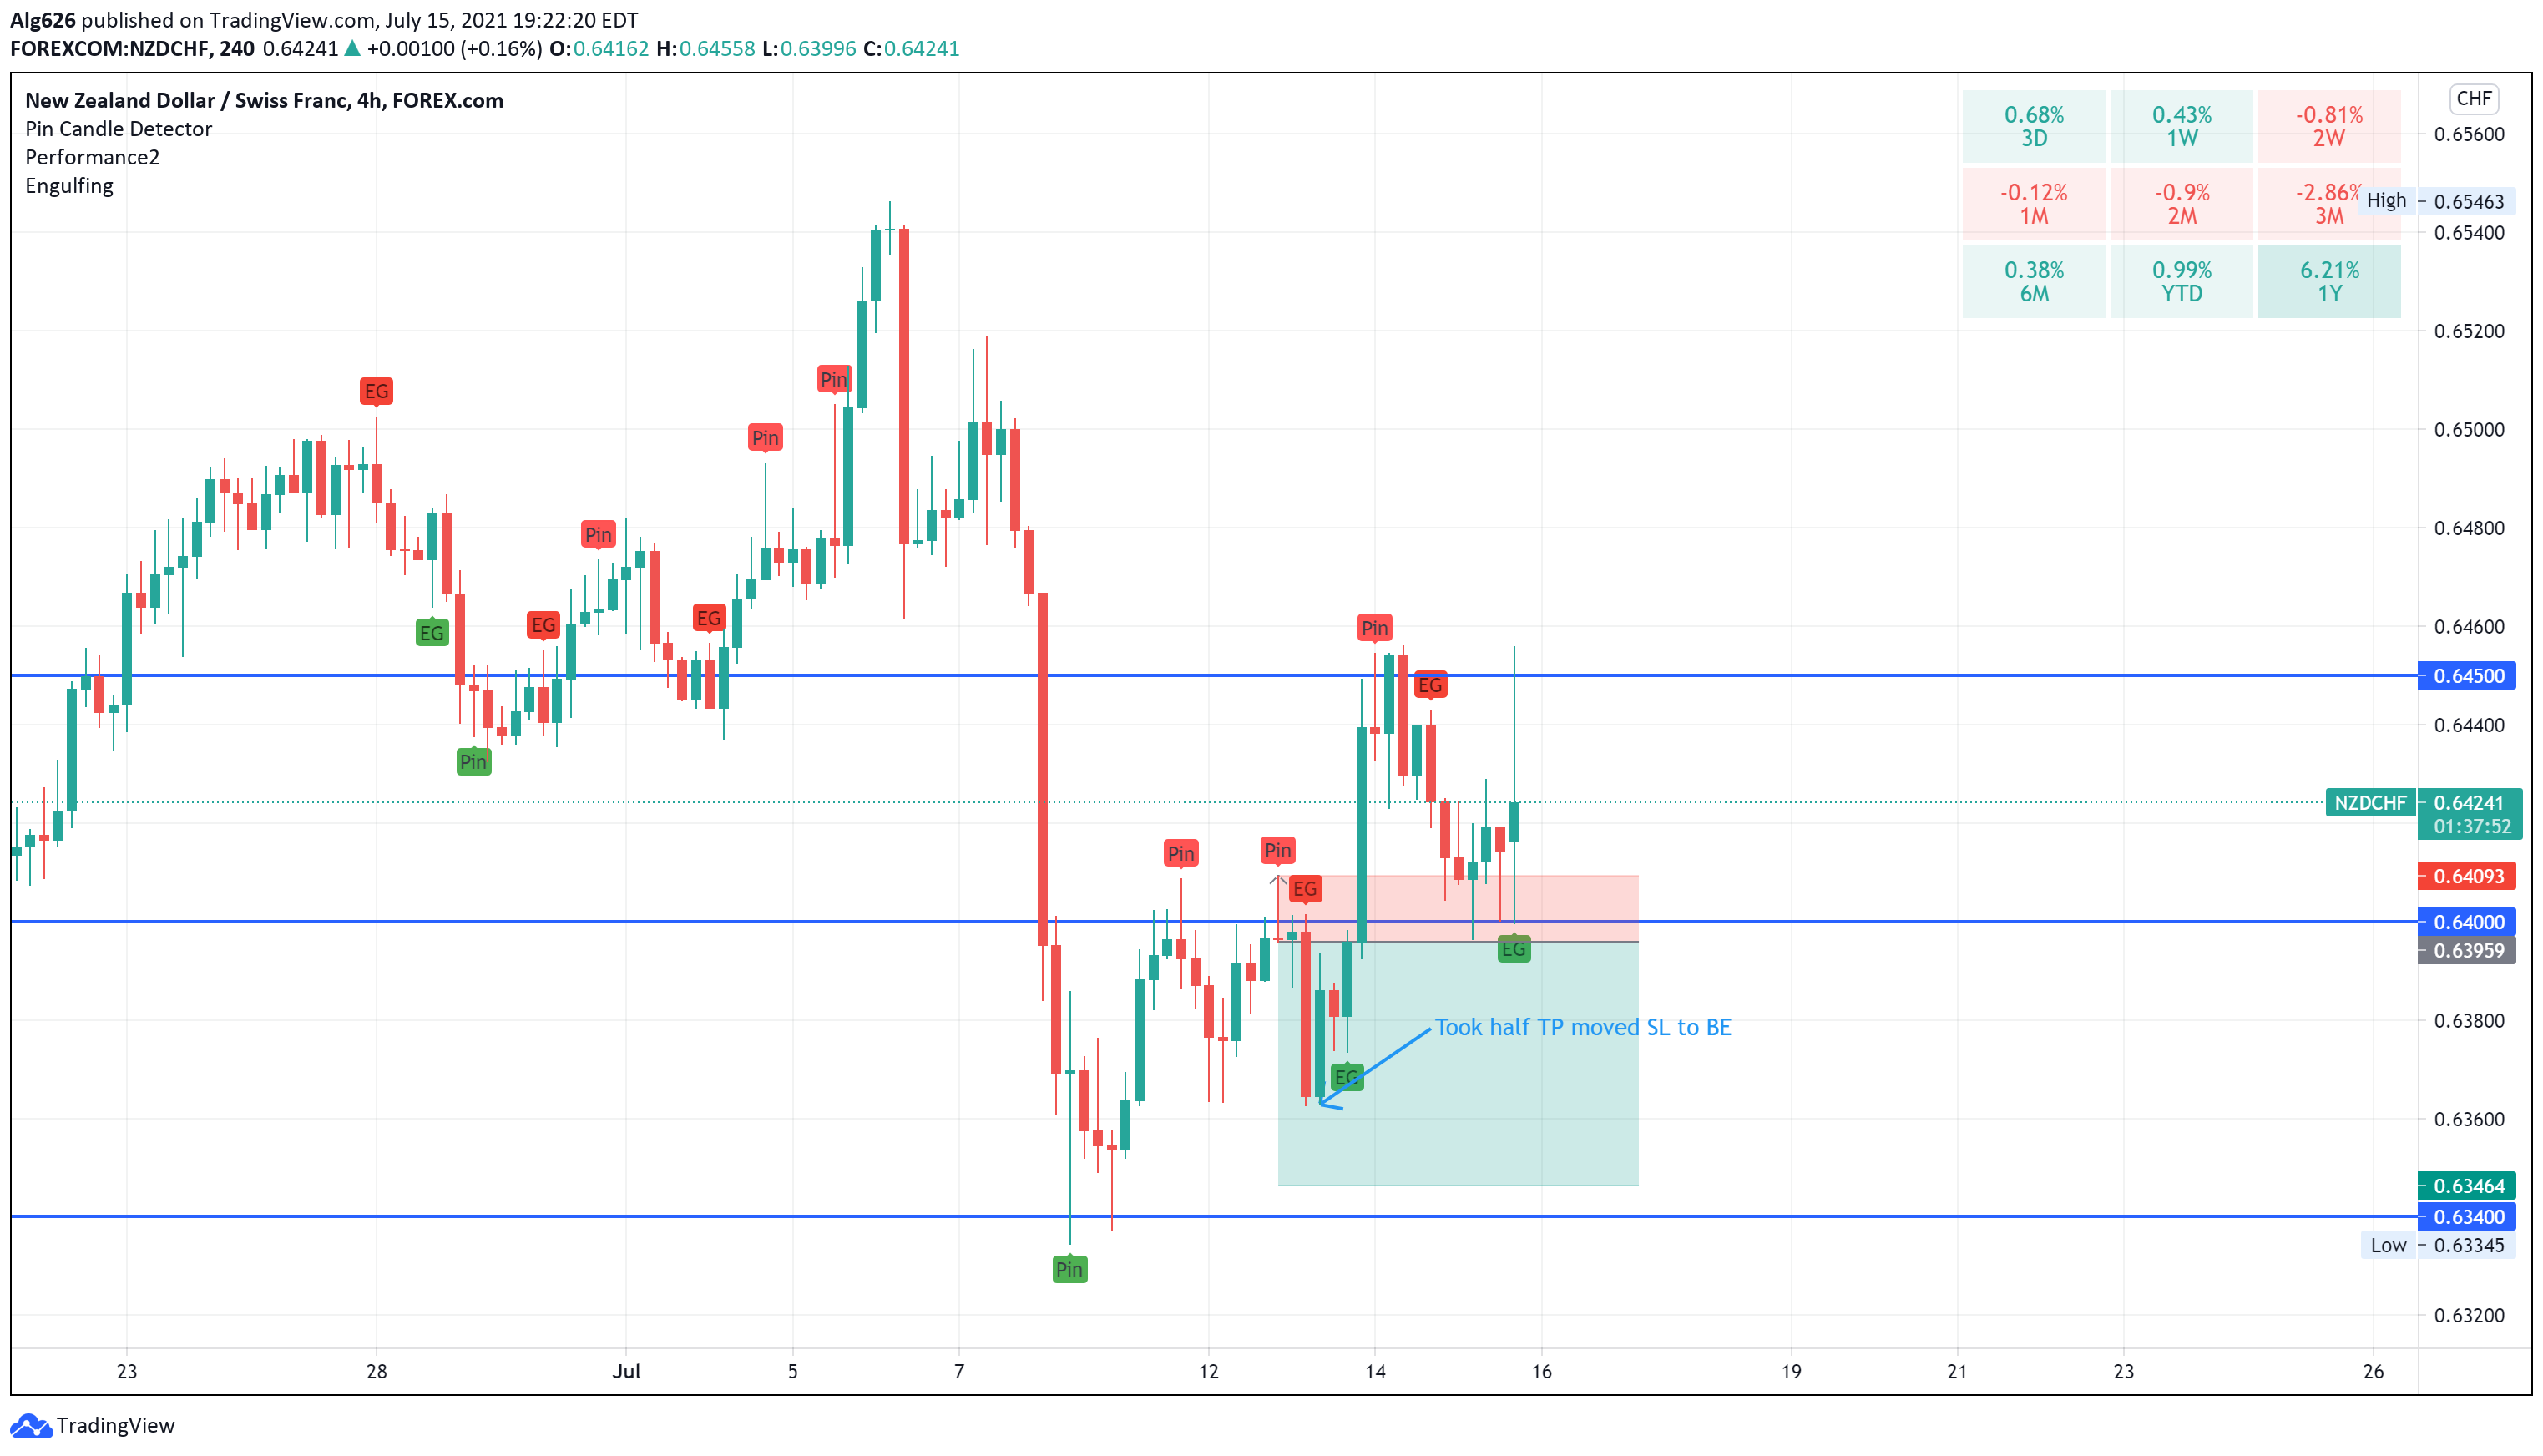
• I exit my trades like this. If the trade has a 60pip target. I place my first TP at 20 pips, once there, I close out a 2/3rds of my position and move my SL to BE. Once my trade reaches 40pips I move my SL to the first TP and let the trade run, but do not close out anymore of my position. It’s either going to hit full TP or retrace back down and hit my SL that sits at my first TP.
So if it’s a 120pip move then my first TP is 40 pips, I usually set my first TP at the 1/3 mark of the trade.
• If the trade is a smaller trade, let’s say 40 pips or so. I place my first TP at the halfway mark(20 pips). Once price reaches there, I close half my position and move SL to BE. Now if you’re trading with micro lots you won’t be able to do this as that’s as small of a lot you can have.
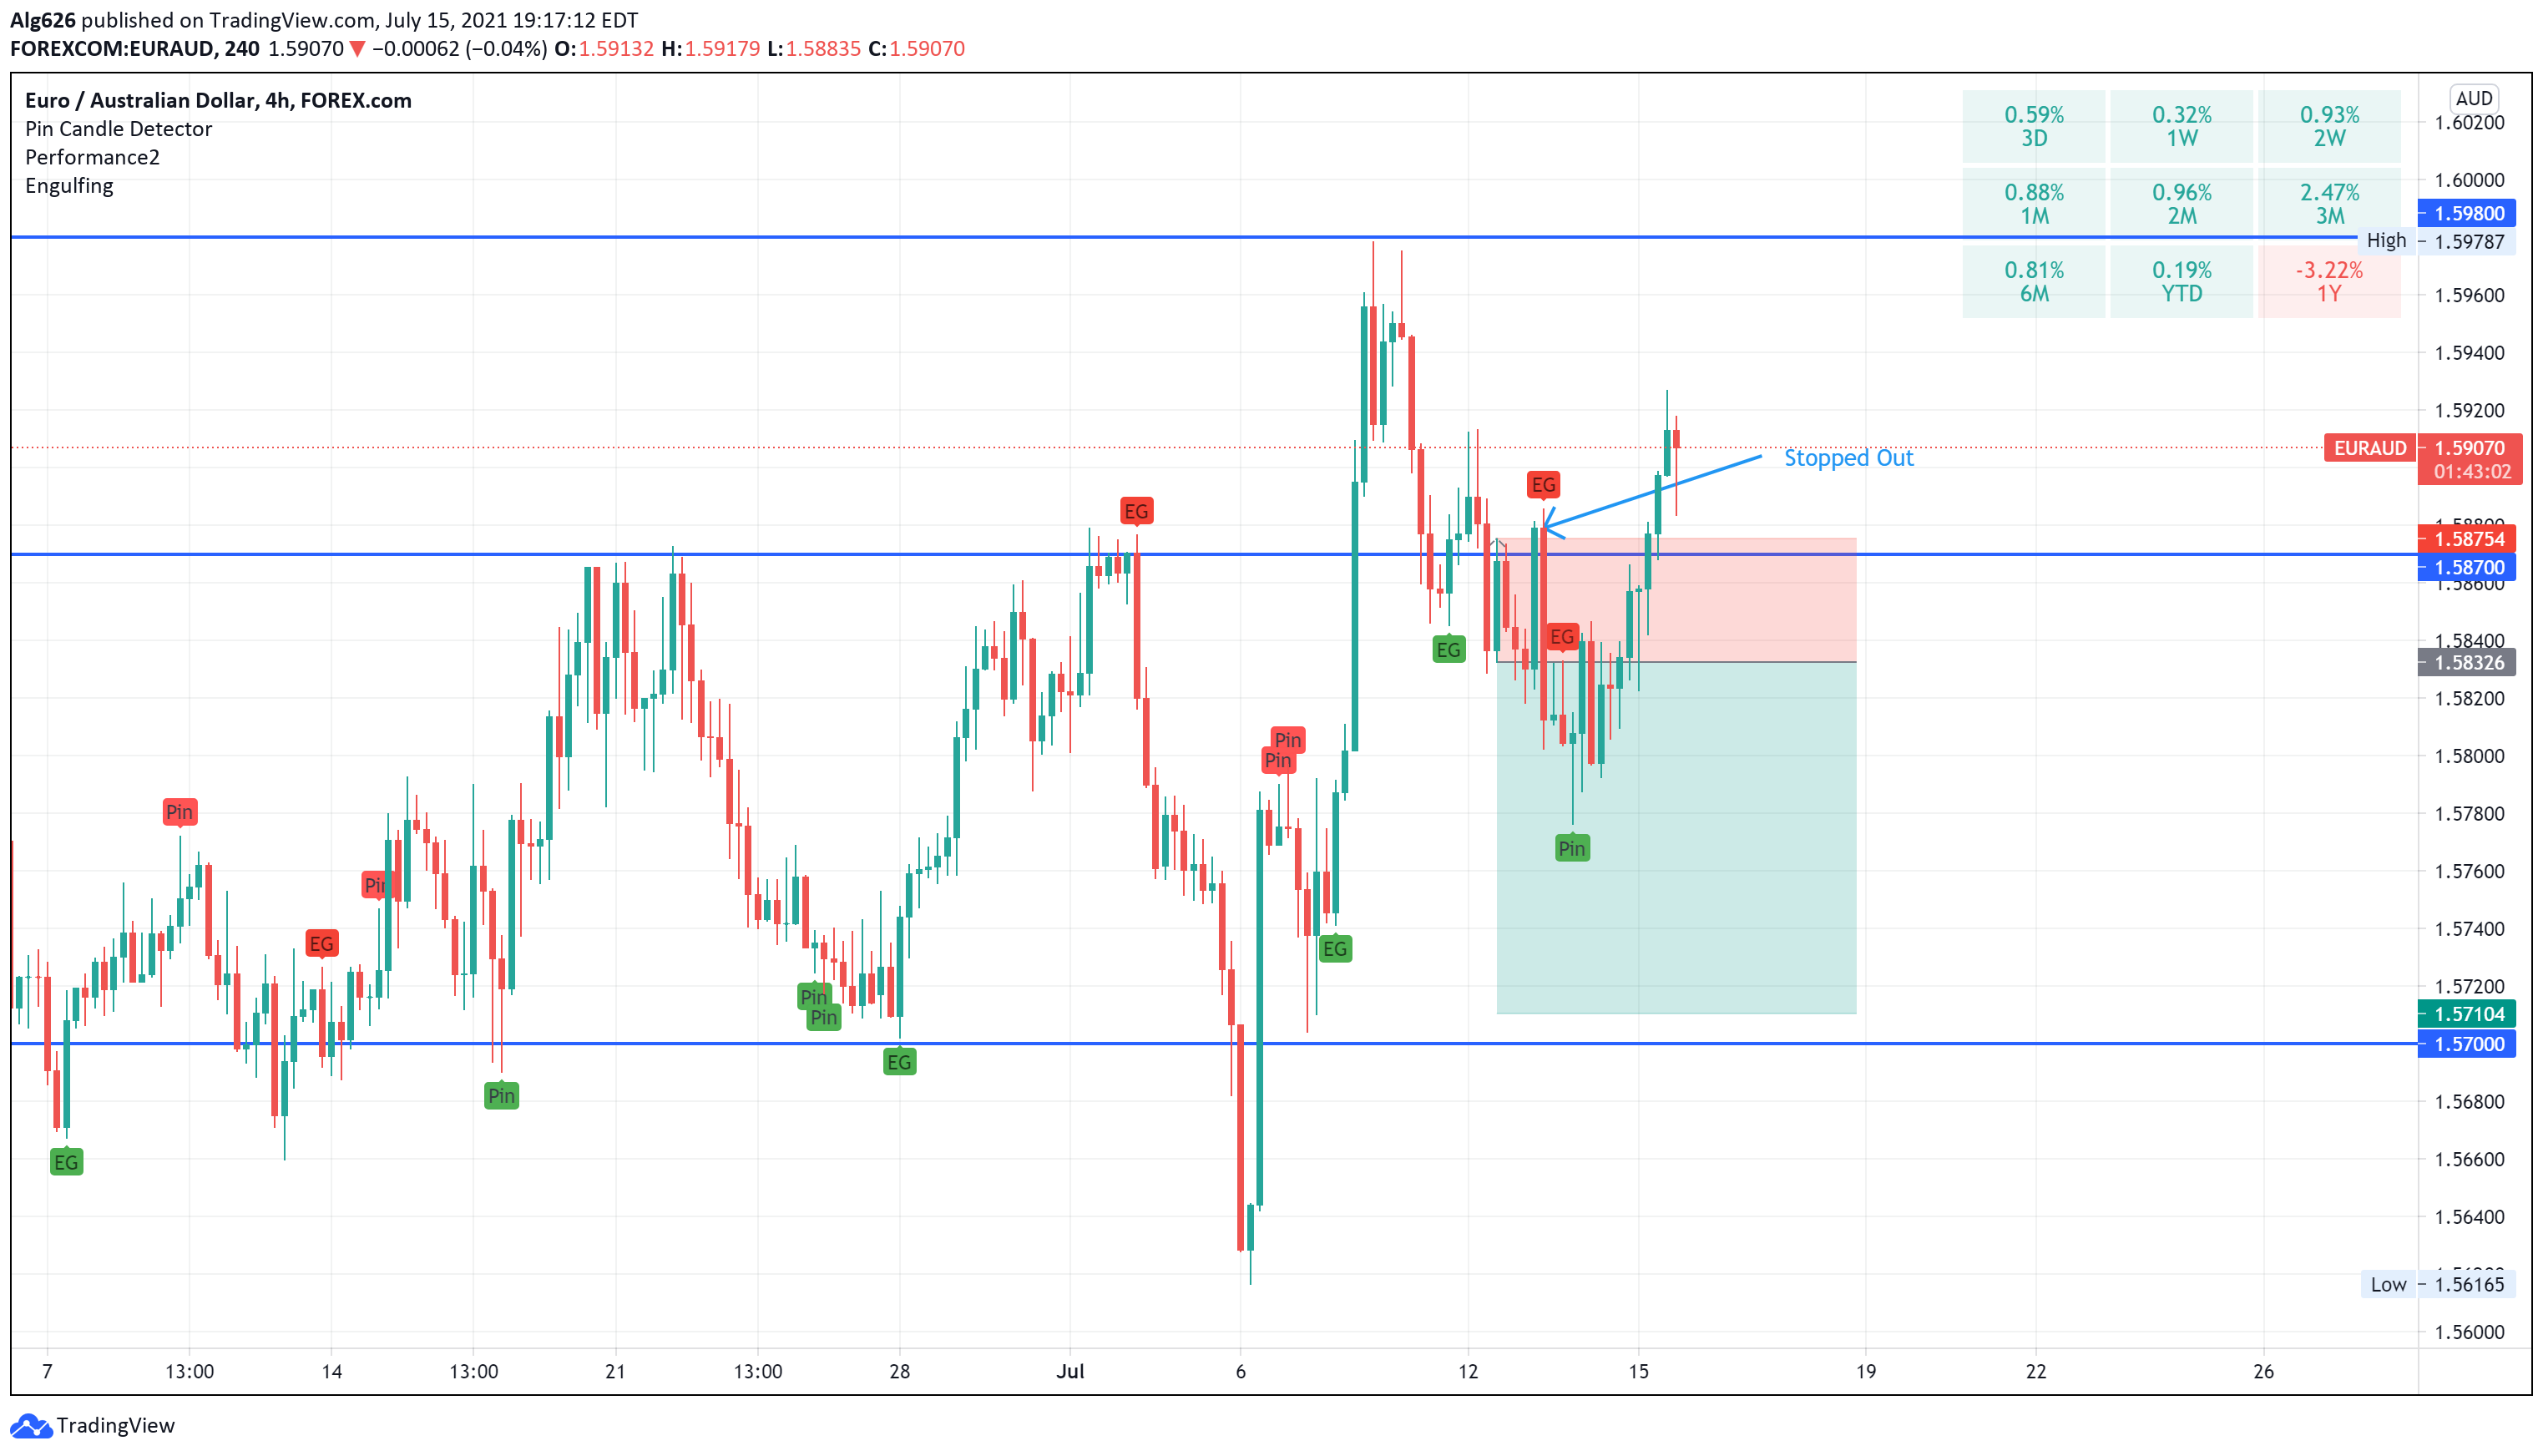
• Once I enter a trade it either hits a TP or a SL, I don’t exit early(unless it’s the end of the week). I risk what I’m comfortable with losing. So if it goes against me, it is what it is at that point.
• Cancel trades, I will cancel if my order hasn’t filled and the price retraces past where my SL would be set which for me makes the set up invalid. Other than that I keep the order in place.
Multiple Positions/ Trades:
• Let me say that I understand at times I have multiple positions open for or against a particular currency. I do realize that they all could turn against me and hit my SL. If so then that’s part of the game. I use money management that keeps me in the game after even taking multiple loses in a row.
• I will even have multiple trades open, I try to keep it to no more than 5-6 unprotected positions open at any given time. Unprotected meaning that I have not took a TP1 and moved my SL to BE.
I realize I may trade a little more aggressively than some and that’s ok. I wait for price to get to certain areas then enter. Well I also make sure it looks to be a good setup(in my eyes that is).
What Instruments I trade:
• I trade 43 pairs plus Oil, Gold, Silver, and some Indices.
Daily Routine:
• I sit down once a day for about 1 hour(usually around 5:30pm, during the swap) and review charts and place alerts and orders where needed and adjust zones as well. Don’t pay much mind to the charts after that until I get an alert for either an entry or a TP has been hit.
• I usually don’t open any trades after 9pm Thursday(eastern time) candle due to my FTMO account doesn’t allow me to hold over the weekend(they now have accounts that allow that, but wasn’t available when I got mine).
Charting Software:
I use TradingView for my charting software. You’ll notice a couple things. You’ll see little labels by my candles. These also are the confirmation candles I look for.
• The background rotates different colors, on my 4HR that represents the week. So each time it changes color that’s the start of the trading week. Which for me is Sunday at 5pm til Friday 5pm (eastern time). Just a quick reference doesn’t help with trading.
Some basic candlesticks:
• EG = Engulfing (Outside Bar)
EnGulfing : My EG can also be called an outside bar. Mine is set up that the close of the engulfing bar has to be higher than the high of the previous bar. Some do as long as the close is higher than the previous bars close but I wanted a bar that was more pronounced. I have attached a pic
• Pin = Pin Bar (Hammer/Shooting Star)
Pin Bar : On this one, it won’t label a pin unless the low/high of the pin was the lowest/highest of the previous 8 candles. Reason for that is I want to catch a pin at the swing of price, plus if a pin doesn’t stick out from the other wicks, it seems to be a little less powerful.
Rules for it to be labeled: Let’s use a buy for example.
The lower wick has to be 3 times the length of the body of the candle. The upper wick can’t be no longer than a third of the length of the lower wick. If the upper wick is also long it’s more of a undecisive candle than a pin.

• 2 Bar Reversal = Similar to an engulfing but doesn’t have to engulf the previous bar.
Notice if you blended the two together it would be a pin bar.
If it’s a bearish reversal, I want the highs to be close together usually with-in 5-10 pips. Then the open of the previous candle and close of confirmation candle should make the body of the blended candle.
Wicks shouldn’t be too long from the candles. You want the bodies to be solid and to stand out.

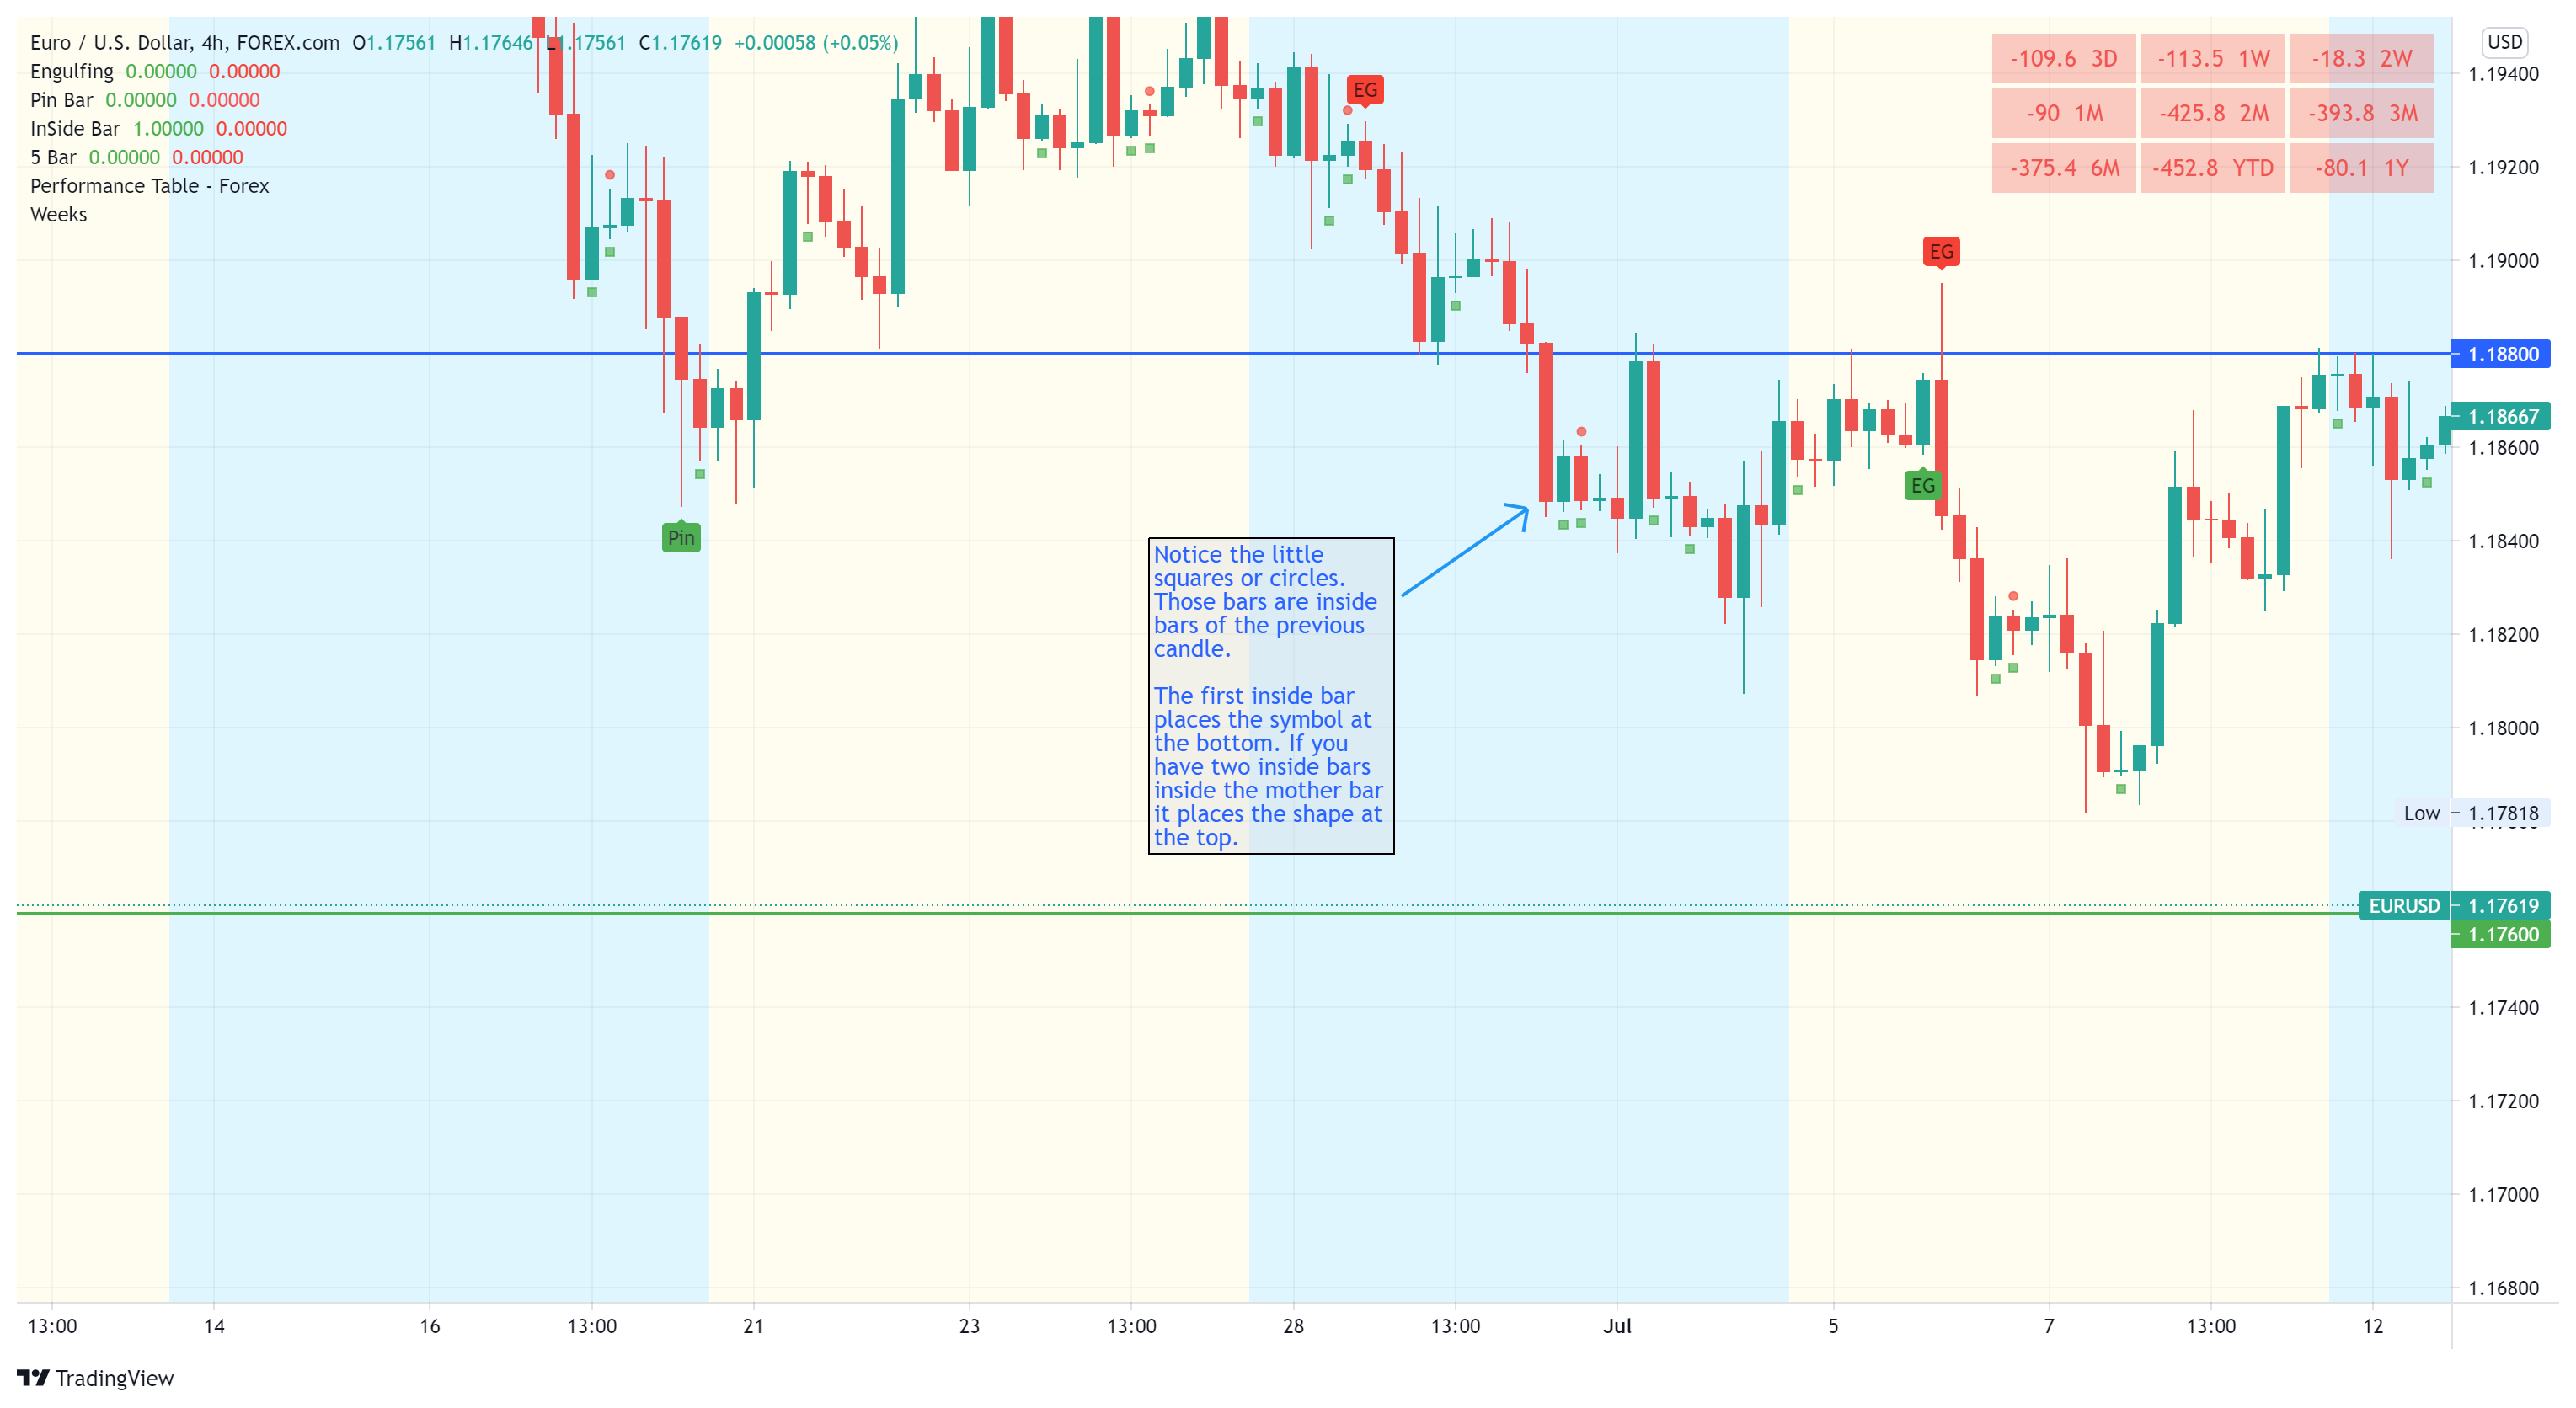
• Inside Bar : Little green squares and red circles = Inside Bar (pattern I don’t trade but keep it there)
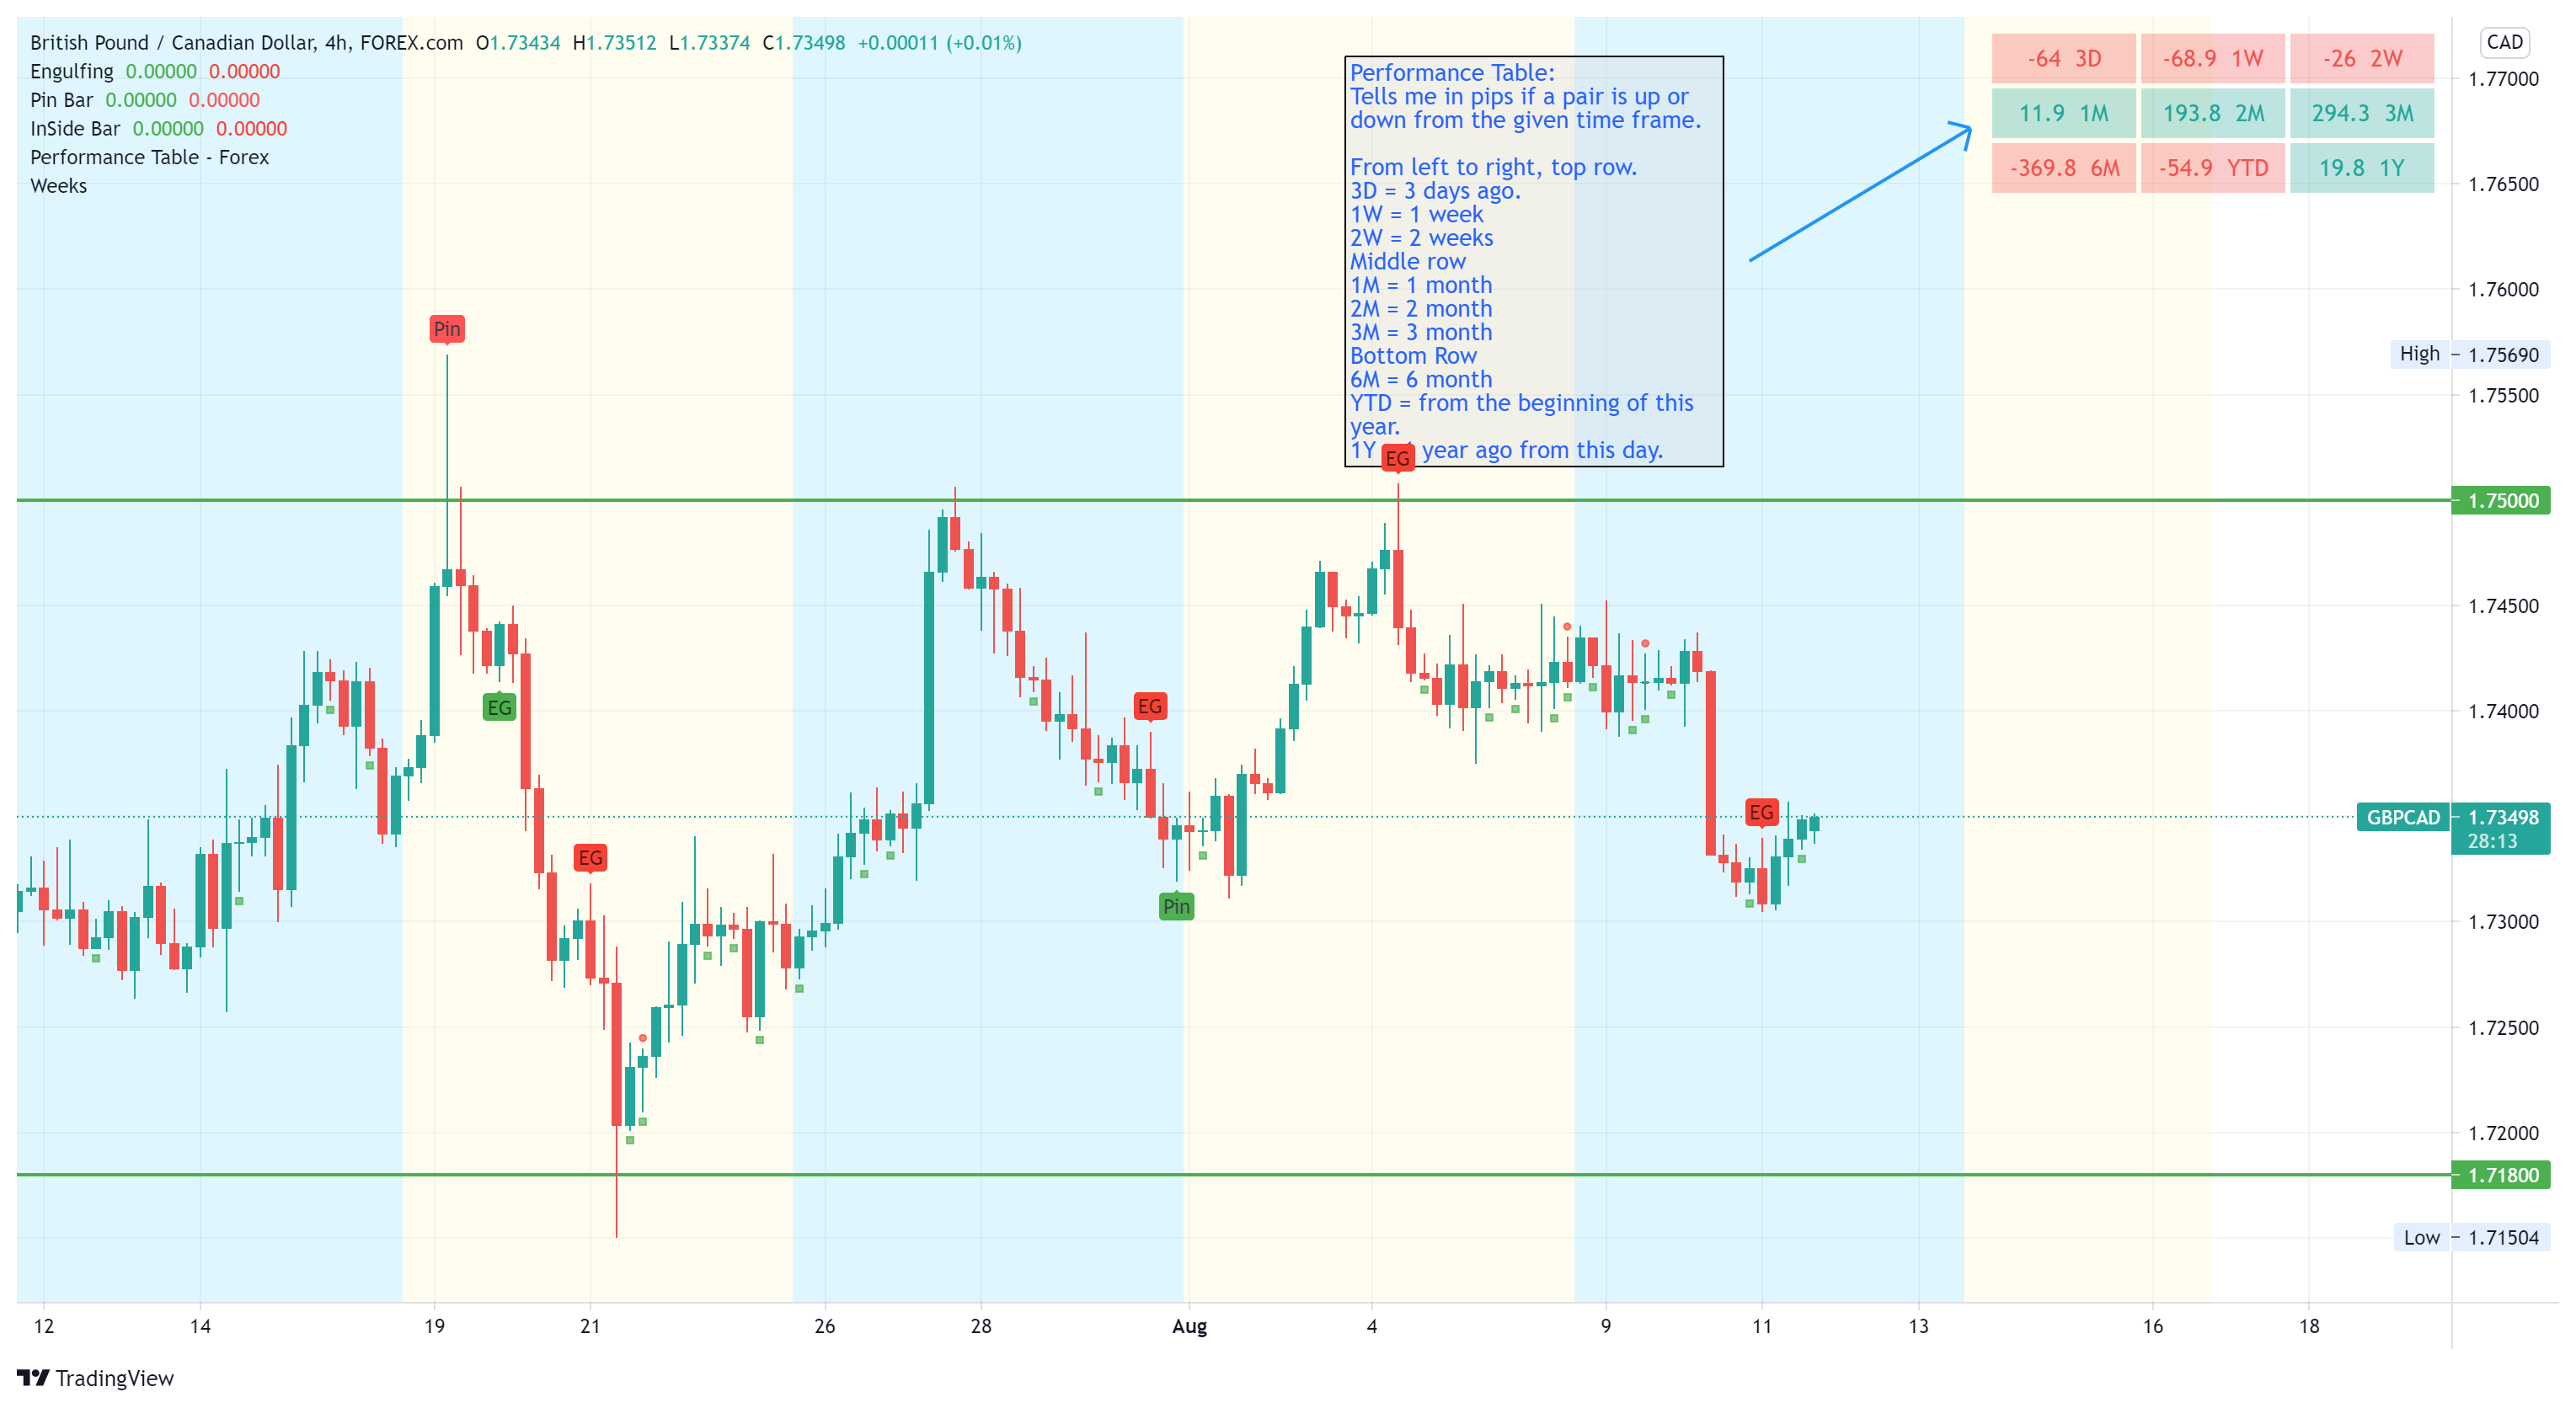
• Performance Table at the top right. The time frames are always from the current day to whatever time-frame back. Calculated in pips.
From left to right, top row.
3D = 3 days ago.
1W = 1 week
2W = 2 weeks
Middle row
1M = 1 month
2M = 2 month
3M = 3 month
Bottom Row
6M = 6 month
YTD = from the beginning of this year.
1Y = 1 year ago from this day.
Backtesting
I have attached some backtesting using three candlestick patterns and trading them at support and resistance zones. They are all reversal patterns. EnGulfing, Pin Bar, and 2 Bar Reversal.
PA - Backtesting - 4HR-1.xlsx (76.7 KB)
Some Thoughts:
• I don’t go by a lot of things you read online or in books about how many trades you should take or risking only 1-2% per trade or keeping a certain R:R, or this chart pattern looks good. I know any of those can fail at anytime(meaning the chart patterns, good trade management never fails). And if everyone is going by everything they read in the books then why do 75% of people have negative accounts or not making money(going by the brokers published stats). I still use money and risk management, you’d be crazy not to, I just don’t maybe in the more traditional since that you read a lot about. Just giving a little insight on how I view things. I have evolved a little more from the original thread that I read and started to learn how to trade, which is a cool thing about trading is the growth that can happen and at times the pruning that happens too.
• I also try and post my trades live as best I can when I’m at my computer. Anyone can look at past price chart and make it look like they know what their doing(why you should be careful of social media guys, not all are scammers but there are a lot). So just want to be transparent for everyone. I post during the week the trades I take or maybe even missed, then at the end of the week maybe Friday night or Saturday morning I do one post with all the charts and trades through the week so we can see how we did for the week. Have also started posting a journal as well to go along with the charts.
I do this thread now as a place to practice what I preach and to help keep me accountable for my trading method and staying with the plan.
Post I want linked at top:
Fear and Losing
Does your strategy fit you?
Price Action - Backtesting - 4HR Chart
How I chart support and resistance, and thoughts on not being profitable.
Weekly Round Up Post:
Week of 10/3/21
Week of 10/10/21
Week of 10/17/21
Week of 10/24/21
Week of 10/31/21
Week of 11/7/21
Week of 11/14/21
Week of 11/21/21
Week of 11/28/21
Week of 12/5/21
Week of 12/12/21
Week of 12/19/21
Monthly Totals
October 2021
November 2021
December 2021
Quarterly Trading Analysis
2021 - 4th Quarter - Ongoing
2021 - 4th Quarter - Completed
Links to videos that I found good to me:
Tom Hougaard - Behavior Modification
Tom Hougaard - Why Normal Doesn’t Make Money , This is a good series.
Trevor Neil - How Do Retail and Institutional Traders Differ , This is a good little series as well
Mark Douglas: How to Think Like a Professional Trader
Mark Douglas: Probabilities
Anton Kreil - Why 90% Traders Lose Money
Some guidelines if you wish to contribute or post your charts:
- TimeFrame: Please post 4HR or Daily charts (just what I trade and what the theme is of the thread)
- Please feel free to ask questions on why I entered, could help us all with some discussion. Kind of the point for being here, right.
- And just be respectful to others opinions on the charts and just in general be respectful.
- If you’re posting a Indice or Stock trade I understand that be not be in a 4HR chart, I trade from 15min to 1HR as well on those. So feel free to post those with whatever timeframe you trade. But please keep the forex and metals to 4HR charts.
Hope this helps someone and good luck trading.
Last Update of this Post : 12/26/21